
RESEARCH Open Access
An imbalance in progenitor cell populations
reflects tumour progression in breast cancer
primary culture models
Simona Donatello
1
, Lance Hudson
1
, David C Cottell
2
, Alfonso Blanco
3
, Igor Aurrekoetxea
1,4
, Martin J Shelly
5
,
Peter A Dervan
6
, Malcolm R Kell
7
, Maurice Stokes
7
, Arnold DK Hill
1
and Ann M Hopkins
1*
Abstract
Background: Many factors influence breast cancer progression, including the ability of progenitor cells to sustain
or increase net tumour cell numbers. Our aim was to define whether alterations in putative progenitor populations
could predict clinicopathological factors of prognostic importance for cancer progression.
Methods: Primary cultures were established from human breast tumour and adjacent non-tumour tissue. Putative
progenitor cell populations were isolated based on co-expression or concomitant absence of the epithelial and
myoepithelial markers EPCAM and CALLA respectively.
Results: Significant reductions in cellular senescence were observed in tumour versus non-tumour cultures,
accompanied by a stepwise increase in proliferation:senescence ratios. A novel correlation between tumour
aggressiveness and an imbalance of putative progenitor subpopulations was also observed. Specifically, an
increased double-negative (DN) to double-positive (DP) ratio distinguished aggressive tumours of high grade,
estrogen receptor-negativity or HER2-positivity. The DN:DP ratio was also higher in malignant MDA-MB-231 cells
relative to non-tumourogenic MCF-10A cells. Ultrastructural analysis of the DN subpopulation in an invasive tumour
culture revealed enrichment in lipofuscin bodies, markers of ageing or senescent cells.
Conclusions: Our results suggest that an imbalance in tumour progenitor subpopulations imbalances the
functional relationship between proliferation and senescence, creating a microenvironment favouring tumour
progression.
Background
Breast cancer is a heterogeneous disease of considerable
social and economic burden. Significant interest sur-
rounds the question whether cancer stem/progenitor
cells drive tumour formation [1,2], however it remains
to be understood if progenitor analysis has prognostic
value in cancer patients. One approach towards interro-
gating this involves using patient tumour primary cul-
tures to correlate in vitro data and clinicopathological
information.
Breast progenitor cells are isolated based on expression
of markers suggesting capabilities to generate cells of
mixed myoepithelial and luminal epithelial lineages [3,4].
Other methods involve isolation of cells positive for alde-
hyde dehydrogenase (ALDH) activity [5], or ultrastruc-
tural identification [6]. Importantly, primary breast
cultures retain progenitor/stem cell populations [7].
Using primary cultures from human breast tumour
and non-tumour tissue, we sought to define correlations
between progenitor cell numbers and clinicopathological
or functional indicators of cancer aggressiveness. Our
results demonstrate an imbalance between two putative
progenitor cell populations inclinicopathologically-
aggressive tumours, in conjunction with functional
alterations promoting increased proliferation or reduced
growth arrest. Taken together, full investigations of pro-
genitor populations in relation to clinicopathological
parameters could make an important contribution
* Correspondence: annhopkins@rcsi.ie
1
Department of Surgery, Royal College of Surgeons in Ireland; Dublin, Ireland
Full list of author information is available at the end of the article
Donatello et al.Journal of Experimental & Clinical Cancer Research 2011, 30:45
http://www.jeccr.com/content/30/1/45
© 2011 Donatello et al; licensee BioMed Central Ltd. This is an Open Access article distributed under the terms of the Creative
Commons Attribution License (http://creativecommons.org/licenses/by/2.0), which permits unrestricted use, distribution, and
reproduction in any medium, provided the original work is properly cited.

towards a better understanding of breast cancer
progression.
Methods
Reagents
Suppliers: trypsin-EDTA, penicillin/streptomycin, peni-
cillin/streptomycin/neomycin, fungizone, Cyquant, X-
gal, Alexa-Fluor antibodies (Invitrogen); soybean trypsin
inhibitor, collagenase I, hyaluronidase 1-S, DMEM/
Ham’s F12, bovine insulin, peroxidase-labelled secondary
antibodies (Sigma); HMEC, mammary epithelial growth
medium (MEGM) kits, foetal bovine serum (FBS,
Lonza); glutaraldehyde (Fluka); osmium tetroxide (Elec-
tron Microscopy Services). Antibody suppliers: actin,
ESA and SMA (Sigma); cytokeratin-19, PE-conjugated
CALLA, FITC-conjugated EPCAM, FITC- or PE-conju-
gated IgG controls (Dako); cytokeratin-18 (Abcam);
cytokeratin-14 (Millipore); vimentin and p63 (BD
Biosciences).
Primary cultures
Breast primary cultures were generated from patient lum-
pectomy/mastectomy samples with informed consent as
approved by the Medical Ethics committees of Beaumont
Hospital and the Mater Misericordiae Hospital, in accor-
dance with the Declaration of Helsinki. One piece each of
tumour tissue and non-tumour margins (Additional file 1)
were cultured as described [8]. Tissues were incubated in
10X penicillin/streptomycin/neomycin, minced in
DMEM/F12 containing 1X penicillin/streptomycin/neo-
mycin, 10% FBS, 10 μg/ml insulin, 5 μg/ml fungizone,
100U/ml hyaluronidase 1-S, 200U/ml collagenase and
rotated for 2 hours/37°C. Supernatants were pelleted,
washed and cultured in MEGM. Occasional fibroblast
contamination was removed by brief trypsinization (to
remove fibroblasts but not underlying epithelial cells), and
cultures containing >30% fibroblasts were discarded. In
some experiments, primary human mammary epithelial
cells (HMEC, Lonza) were cultured in MEGM.
Breast cell lines
MCF10A and MDA-MB-231 cells (ATCC) grown nor-
mally in DMEM-F12, 5% horse serum, 0.5 μg/ml hydro-
cortisone, 10 μg/ml insulin, 100 ng/ml cholera toxin, 20
ng/ml human recombinant EGF (MCF10A) or DMEM,
10% FBS, 2 mM L-glutamine(MDA-MB-231) were con-
ditioned in MEGM for 2-3 weeks and used in flow cyto-
metry experiments as controls for normal and
tumourogenic phenotypes respectively.
Proliferation assays
Primary cells (5 × 10
3
) were plated in triplicate and har-
vested after 0, 3 or 6 days. Cyquant solution was incubated
on freeze-thawed cells (5 min), and emitted fluorescence
detected at 520 nm on a Wallac plate-reader. Fluorescence
readings of unknown samples were translated into cell
numbers by referring to two separate fluorescence stan-
dard curves - one for non-tumour and one for tumour
cultures- constructed from known cell numbers (Addi-
tional file 2). The slope of each proliferation graph was cal-
culated from the linear regression line using the formula y
=mx+c,wherem=slopeandc=y-intercept.
Senescence-associated b-galactosidase assays
Primary cells (5 × 10
4
) were plated in duplicate, and
stained for senescence-associated b-galactosidase activity
[9]. Three brightfield micrographs per condition were
captured, and blue senescent cells expressed as a per-
centage of total cells/field.
Immunofluorescence staining for epithelial and
myoepithelial markers
Primary cells (passage 1-2) grown in chamber slides
were fixed in 3.7% paraformaldehyde and immunos-
tained for epithelial (K19, K18, ESA) or myoepithelial
(SMA, K14, VIM) markers using DAPI as a nuclear
counter-stain. Primary antibodies were omitted in nega-
tive controls, and slides visualized on a Zeiss LSM510-
meta confocal microscope.
SDS-PAGE and Western blotting
Confluent primary cultures were harvested in RIPA (20
mM Tris-HCl pH7.5, 150 mM NaCl, 5 mM EDTA, 1%
Triton-X100) containing protease and phosphatase inhi-
bitors. Lysates were dounced and 25 μg supernatant
subjected to SDS-PAGE and Western blot analysis for
K19, K18, VIM and p63.
FACS analysis of putative progenitor cell populations
Confluent passage 0 primary cells (T25 flask/condition)
were trypsinized, blocked in human serum and co-incu-
bated with FITC-conjugated mouse anti-human EPCAM
and PE-conjugated mouse anti-human CALLA (4°C/30
min). Negative controls were unlabelled or single-
stained with FITC-EPCAM, PE-CALLA, FITC-IgG or
PE-IgG. Cells were analyzed on a Beckman Coulter
Cyan-ADP and/or an Accuri-C6 flow cytometer. Cells
were sorted into CALLA
+
/EPCAM
+
, CALLA
+
/EPCAM
-
,
CALLA
-
/EPCAM
-
or CALLA
-
/EPCAM
+
populations on
a BD FACSAria cell sorter. Some passage 0 cells were
analyzed for activity of the stem cell marker ALDH by
Aldefluor assay [5]. Briefly, 2 × 10
5
cells were resus-
pended in assay buffer and incubated with activated sub-
strate or the negative control reagent before analysis.
Transmission electron microscopy (TEM)
Passage 0 primary cultures or HMECs were fixed with
2.5% glutaraldehyde, processed as described [10] and
Donatello et al.Journal of Experimental & Clinical Cancer Research 2011, 30:45
http://www.jeccr.com/content/30/1/45
Page 2 of 10

analyzed on a FEI-Tecnai transmission electron micro-
scope. TEM was also performed on sorted DN subpopu-
lations expanded in 24-well plates.
Calculations and statistics
Data are expressed as mean ± standard error of the
mean. Non-tumour versus tumour results were com-
pared using non-parametric tests and one-tailed
unpaired t-tests. Population variances were first com-
pared using Instat-3.3.6 to inform the choice of equal/
unequal variance between populations. The prolifera-
tion:senescence ratio was calculated based upon the data
shown in Figure 2B - the linear regression slopes of pro-
liferation graphs and the percentages of senescent cells
at the timepoint measured.
Results
Primary breast cultures recapitulate the cellular balance
of human breast
Primary cultures of both non-tumour (NT) and tumour
(T) human breast tissue yielded adherent organoids with
outwardly-proliferating colonies (Figure 1A, left). Two
cellular populations were observed - large polygonal
cells in colony centres (lpc; Figure 1A, right), and small
polygonal cells (spc) at the peripheries. Since spc and
lpc resembled respectively myoepithelial and luminal
epithelial cells, expression of epithelial and myoepithelial
markers was examined by immunofluorescence micro-
scopy (Figure 1B). In comparison to the negative control
(-ve), cultures were mostly dual-positive for epithelial
markers such as K18, K19 or epithelial-specific antigen
(ESA) and myoepithelial markers such as K14, vimentin
or smooth muscle actin (SMA). Western blot (Figure
1C) detection of K18 was not as sensitive as immufluor-
escenceanalysis,sinceonlysomeofthecultures
expressed K18. Interestingly our analysis (Figure 1C)
also revealed that 3 out of 4 non-tumour cultures
expressed high levels of the epithelial marker K19 and
low levels of the myoepithelial marker p63. In contrast,
3outof4tumourculturesexpressedlowlevelsofK19
but high levels of p63. Western blotting analysis also
confirmed high expression of the myoepithelial marker
vimentin.
Ultrastructural and functional properties of breast
primary cultures separate non-tumour and tumour
primary cultures
Ultrastructural analysis of matched cultures was under-
taken to confirm differences between tumour and non-
tumour specimens (Figure 2). Firstly, tumour cells were
considerably larger than non-tumour cells (~100 μm
versus 16 μm respectively along widest axis, data not
shown). Extensive abnormal vesiculation patterns were
identified in the peri-nuclear regions of tumour versus
non-tumour cultures (Figure 2A, V
NT
versus V
T
). Multi-
nucleation of tumour cells was frequently observed, in
parallel with compromised nuclear membranes (Figure
2A, NM
NT
versus NM
T
). Furthermore, tumour cell
mitochondria were abnormal, elongated and occasionally
fused (Figure 2A, M
NT
versus M
T
). Finally, non-tumour
cells displayed a well-differentiated rough endoplasmic
reticulum (RER) while that in tumour cells was frag-
mented and dispersed (Figure 2A, R
NT
versus R
T
).
We next investigated if morphological differences were
accompanied by cell fate differences (Figure 2B). Prolif-
eration abilities were assessed by Cyquant assay on 4
non-tumour cultures and 12 tumour cultures - 5 low
grade (LG, grade 1-2) and 7 high grade (HG, grade 3).
Values were calculated relative to a standard curve of
fluorescence intensity versus known cell numbers (Addi-
tional file 2). A significant increase in proliferation was
observed in high grade tumour cultures (HG; grade 3)
relative to non-tumour or low grade tumour cultures
(LG; grades 1-2; Figure 2B, left). Since Cyquant prolif-
eration assays quantify all cells rather than just actively-
proliferating cells, we performed senescence-associated
(SA) b-galactosidase assays [9] to estimate growth arrest
(Figure 2B, right). Non-tumour cultures had two-fold
higher SA-b-galactosidase staining than that in tumour
cultures. This was independent of the grade of the origi-
nating tumour, and did not reflect an impaired capacity
to senesce in response to exogenous stimulation (data
not shown).
As the balance between proliferation and senescence is
more important than either parameter alone, we exam-
ined whether altered proliferation:senescence ratios in
breast primary cultures could identify aggressive
tumours. The proliferation:senescence relationship was
estimated based on proliferation graph slopes and senes-
cence values (Figure 2B). Our data revealed a stepwise
increase in proliferation:senescence ratio from non-
tumour through LG and finally HG tumours, correlating
with a simple model of tumour progression (Table 1).
Alterations in putative progenitor cell subpopulations
correlate with aggressive tumours
Since progenitor cells control the generation of new
cells in a tissue, we questioned if alterations in progeni-
tor populations could distinguish between aggressive
and non-aggressive tumours. Several pieces of evidence
suggested the presence of progenitors in primary cul-
tures. Firstly, tumour and non-tumour cultures exhib-
ited epithelial and myoepithelial co-differentiation
(Figure 1). Secondly, they expressed the myoepithelial
marker p63 (Figure 1C) which is also a progenitor mar-
ker [11]. Thirdly, filter-grown cultures had basal elec-
tron-lucent, glycogen-rich cells (Figure 3aarrow)
resembling those described as progenitor/stem cells in
Donatello et al.Journal of Experimental & Clinical Cancer Research 2011, 30:45
http://www.jeccr.com/content/30/1/45
Page 3 of 10
B.
NT14
K18ESA
SMAK14VIM K19
NT20NT19
NON-TUMOUR
EPITHELIALMYOEPITHELIAL
T16T13 T18
TUMOUR
Negative
controls
NON-TUMOUR TUMOUR
A.
spc
lpc
lpc
spc
NON-TUMOUR TUMOUR
C.
K19
Actin
NT23 NT30 NT40 NT41 T25 T26 T28 T39
p63
K18
Vim
NON-TUMOUR TUMOUR
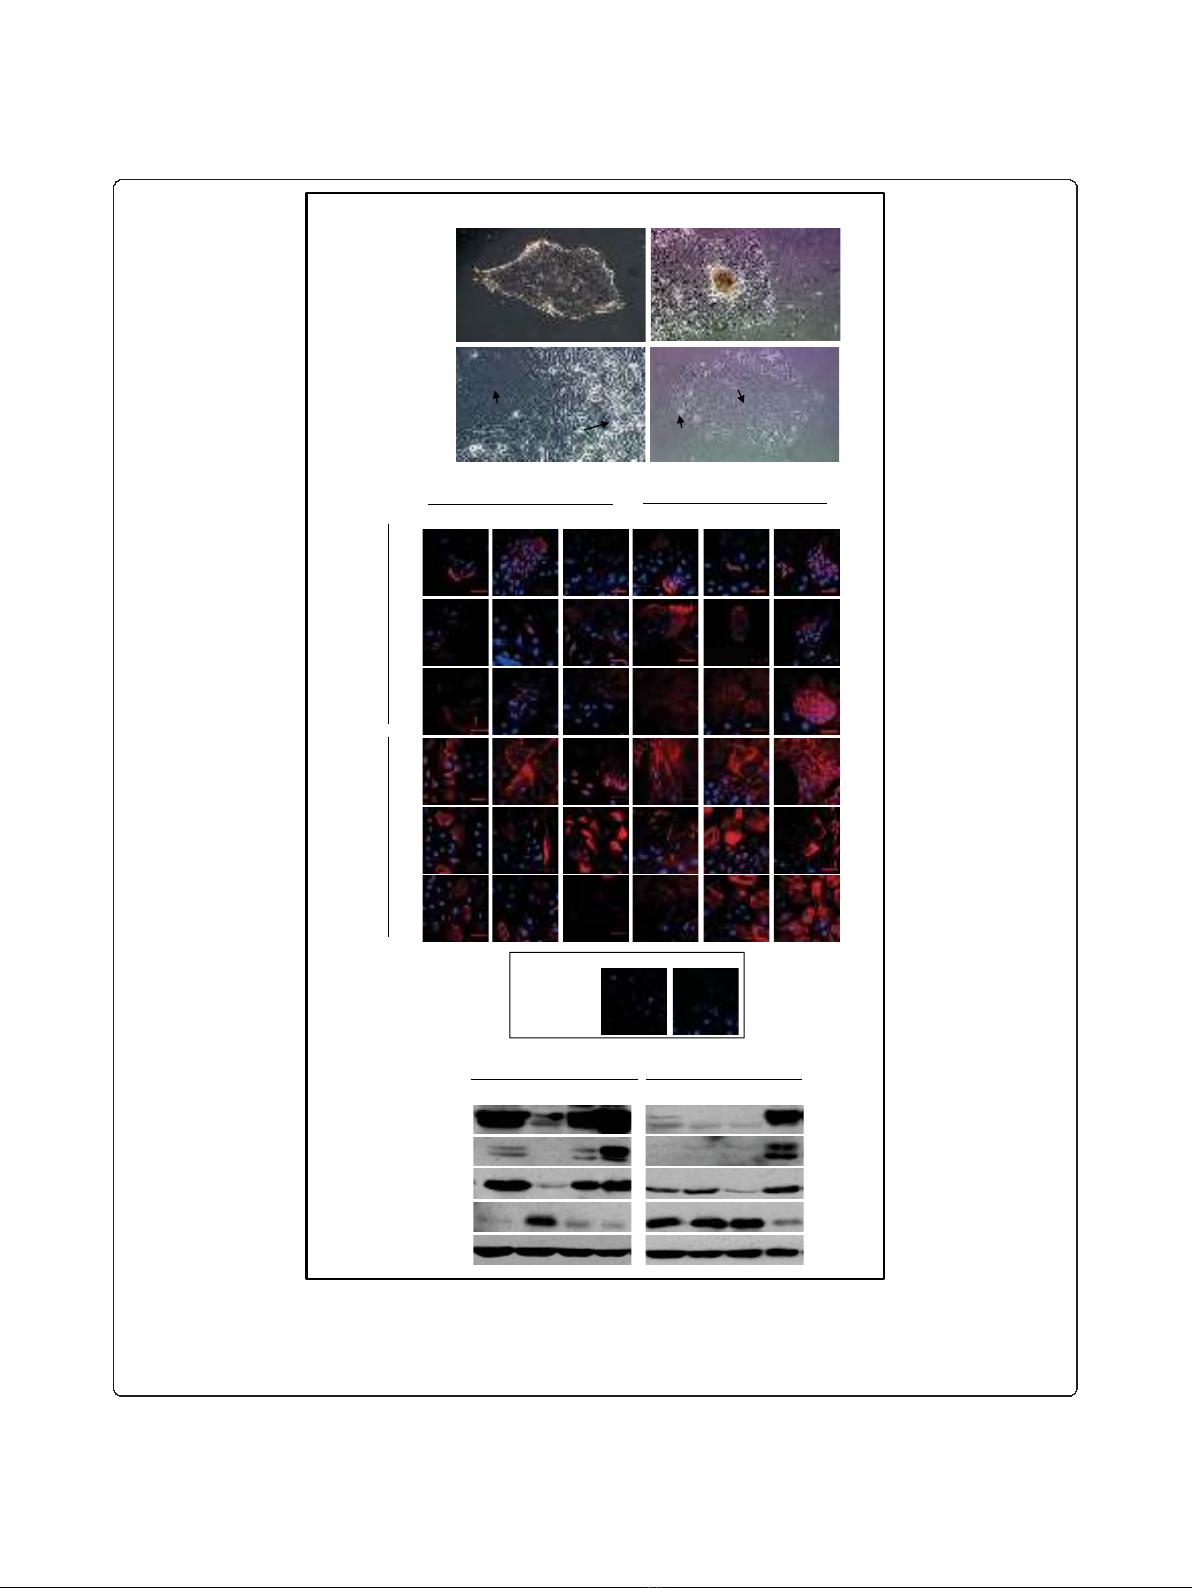
Figure 1 Characterization of tumour and non-tumour primary cultures.A. Organoid-derived cultures (A, top panels, 10X magnification)
from both tumour and non-tumour specimens had large polygonal cells (lower panels, lpc) surrounded by small polygonal cells (lower
panels, spc, 20X magnification).B. Representative tumour and non-tumour cultures (passages 1-3) were analyzed for expression of the
epithelial markers K19, K18 and ESA and the myoepithelial markers SMA, K14 and vimentin (scale bar 50 μm). C. Representative cultures were
immunoblotted for expression of epithelial (K19, K18) and myoepithelial (vimentin, p63) markers.
Donatello et al.Journal of Experimental & Clinical Cancer Research 2011, 30:45
http://www.jeccr.com/content/30/1/45
Page 4 of 10
mammary duct basal laminae [6]. Apically-located cells
were attenuated and squamous-differentiated (Figure 3b,
top arrow). Layering of dark filament-rich cells (Figure
3b arrows) with light glycogen-rich cells (Figure 3b
arrowhead) was observed in all cultures (Figure 3c).
Flow cytometry was used to isolate putative progenitor
populations from primary cultures and search for links
with clinicopathological evidence of tumour progression.
Non-tumour and tumour cultures were analyzed for
expression of CALLA (myoepithelial) and EPCAM
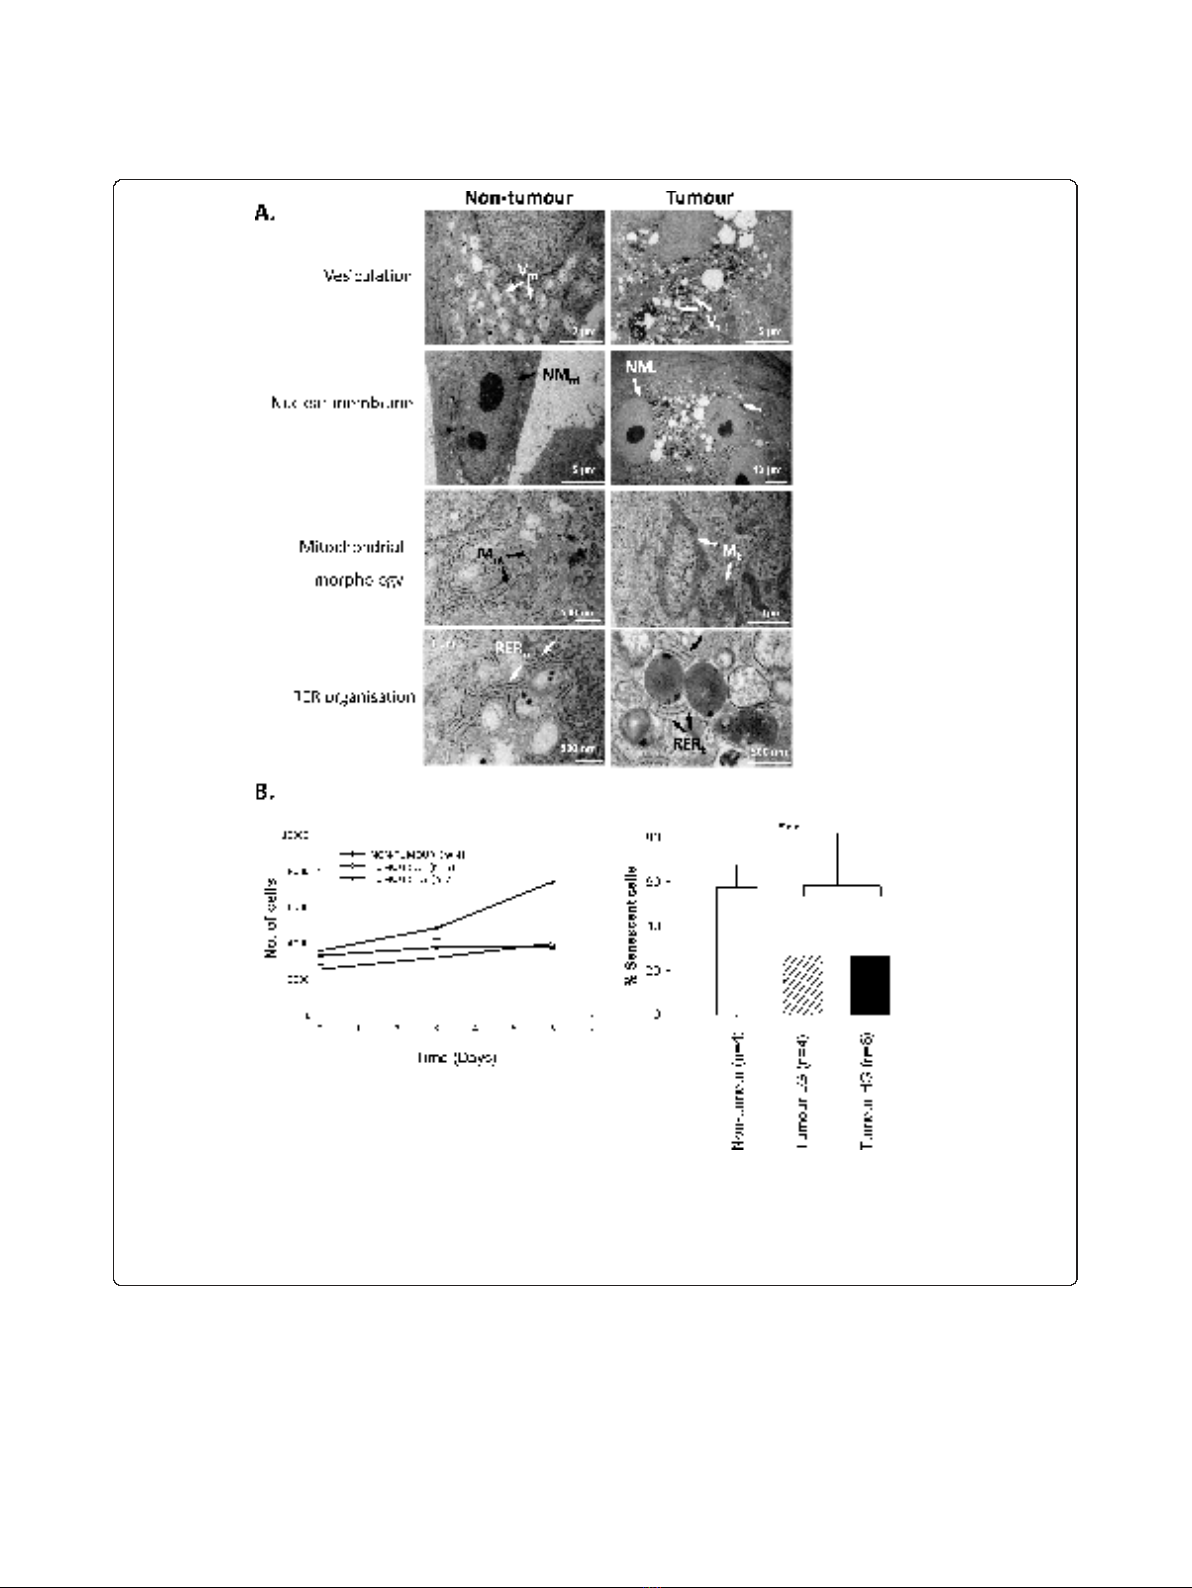
Figure 2 Ultrastructural and functional differences distinguish non-tumour from tumour primary cultures.A. TEM analysis of non-tumour
cells revealed modest numbers of cytoplasmic vesicles (V
nt
), single nuclei, distinct nuclear double membranes (NM
nt
), regular mitochondria (M
nt
)
and well-organized RER (R
nt
). Tumour cells showed abnormal peri-nuclear vesicles (V
t
), >1 nucleus per cell with thin nuclear membranes (NM
t
),
abnormal mitochondria (M
t
) and disorganized RER (R
t
). B. Proliferation was enhanced in HG tumour cultures relative to LG tumour cultures or
non-tumour cultures (left). Basal senescence, estimated by SA-b-galactosidase staining, was lower in tumour versus non-tumour cultures (right;
p < 0.001).
Donatello et al.Journal of Experimental & Clinical Cancer Research 2011, 30:45
http://www.jeccr.com/content/30/1/45
Page 5 of 10


![Báo cáo seminar chuyên ngành Công nghệ hóa học và thực phẩm [Mới nhất]](https://cdn.tailieu.vn/images/document/thumbnail/2025/20250711/hienkelvinzoi@gmail.com/135x160/47051752458701.jpg)


%20--%3e%3cdefs%3e%3cstyle%3e%20.st0%20{%20fill:%20%23fff;%20}%20.st1%20{%20fill:%20%237800fa;%20}%20%3c/style%3e%3c/defs%3e%3cpath%20class='st1'%20d='M117.78,12.18H43.11c2.9,3.47,4.65,7.94,4.65,12.82,0,5.6-2.3,10.66-6.01,14.29h76.02l7.22-13.56-7.22-13.56Z'/%3e%3cg%3e%3cpath%20class='st0'%20d='M53.58,26.17h-.59v-1.46h.59v-4.96h2.83c1.78,0,2.67.94,2.67,2.82v5.76c0,1.87-.89,2.81-2.67,2.81h-2.83v-4.96ZM55.36,21.37v3.34h1.1v1.46h-1.1v3.34h1.01c.61,0,.91-.37.91-1.1v-5.93c0-.74-.3-1.1-.91-1.1h-1.01Z'/%3e%3cpath%20class='st0'%20d='M65.99,31.14h-1.8l-.31-2.07h-2.19l-.31,2.07h-1.64l1.82-11.39h2.62l1.82,11.39ZM65.28,18.04c-.25.46-.51.77-.75.94-.21.15-.47.22-.79.22-.26,0-.57-.07-.92-.22l-.38-.15c-.14-.05-.26-.07-.37-.07-.3,0-.53.18-.71.54l-.91-.68c.25-.46.51-.77.75-.94.21-.14.48-.21.79-.21.26,0,.57.07.92.21l.38.15c.14.05.26.07.37.07.3,0,.53-.18.71-.54l.91.68ZM61.91,27.52h1.73l-.87-5.76-.87,5.76Z'/%3e%3cpath%20class='st0'%20d='M74.53,26.89v1.52c0,1.91-.89,2.86-2.67,2.86s-2.67-.95-2.67-2.86v-5.93c0-1.91.89-2.86,2.67-2.86s2.67.95,2.67,2.86v1.11h-1.69v-1.22c0-.75-.31-1.12-.93-1.12s-.93.37-.93,1.12v6.15c0,.74.31,1.11.93,1.11s.93-.37.93-1.11v-1.63h1.69Z'/%3e%3cpath%20class='st0'%20d='M81.4,31.14h-1.8l-.31-2.07h-2.19l-.31,2.07h-1.64l1.82-11.39h2.62l1.82,11.39ZM75.9,19.2l1.52-1.91h1.71l1.51,1.91h-1.61l-.76-.95-.75.95h-1.61ZM77.32,27.52h1.73l-.87-5.76-.87,5.76ZM83.1,15.99l-1.76,1.91h-1.26l1.17-1.91h1.86Z'/%3e%3cpath%20class='st0'%20d='M84.86,19.75c1.78,0,2.67.94,2.67,2.82v1.48c0,1.87-.89,2.81-2.67,2.81h-.85v4.28h-1.79v-11.39h2.64ZM84.01,21.37v3.86h.85c.58,0,.87-.36.87-1.08v-1.71c0-.71-.29-1.07-.87-1.07h-.85Z'/%3e%3cpath%20class='st0'%20d='M93.51,19.75c1.78,0,2.67.94,2.67,2.82v1.48c0,1.87-.89,2.81-2.67,2.81h-.85v4.28h-1.79v-11.39h2.64ZM92.66,21.37v3.86h.85c.58,0,.87-.36.87-1.08v-1.71c0-.71-.29-1.07-.87-1.07h-.85Z'/%3e%3cpath%20class='st0'%20d='M98.8,31.14h-1.79v-11.39h1.79v4.88h2.03v-4.88h1.83v11.39h-1.83v-4.88h-2.03v4.88Z'/%3e%3cpath%20class='st0'%20d='M105.36,24.55h2.46v1.62h-2.46v3.34h3.09v1.63h-4.88v-11.39h4.88v1.63h-3.09v3.18ZM108.17,17.29l-1.76,1.91h-1.26l1.17-1.91h1.86Z'/%3e%3cpath%20class='st0'%20d='M112.2,19.75c1.78,0,2.67.94,2.67,2.82v1.48c0,1.87-.89,2.81-2.67,2.81h-.85v4.28h-1.79v-11.39h2.64ZM111.35,21.37v3.86h.85c.58,0,.87-.36.87-1.08v-1.71c0-.71-.29-1.07-.87-1.07h-.85Z'/%3e%3c/g%3e%3ccircle%20class='st1'%20cx='25'%20cy='25'%20r='20'/%3e%3cpath%20class='st0'%20d='M32.78,19.27c2.92,0,4.43,2.55,5.28,5.33l.71,2.17c.14.38-.33.75-.71.75h-5.61c.19-.33.24-.71.09-1.08l-.75-2.45c-.43-1.32-.99-2.64-1.79-3.77.75-.57,1.65-.94,2.78-.94h0ZM25,18.38c3.25,0,4.9,2.78,5.89,5.89l.76,2.45c.14.42-.33.8-.8.8h-11.69c-.42,0-.94-.38-.8-.8l.75-2.45c.99-3.11,2.64-5.89,5.89-5.89h0ZM25,11.35c1.74,0,3.11,1.37,3.11,3.11s-1.37,3.11-3.11,3.11-3.11-1.41-3.11-3.11,1.41-3.11,3.11-3.11h0ZM17.27,19.27c1.08,0,1.98.38,2.73.94-.8,1.13-1.37,2.45-1.74,3.77l-.8,2.45c-.14.38-.05.75.09,1.08h-5.56c-.42,0-.9-.38-.75-.75l.71-2.17c.9-2.78,2.41-5.33,5.33-5.33h0ZM17.27,12.91c1.51,0,2.78,1.27,2.78,2.83s-1.27,2.83-2.78,2.83-2.83-1.27-2.83-2.83,1.27-2.83,2.83-2.83h0ZM32.78,12.91c1.56,0,2.78,1.27,2.78,2.83s-1.23,2.83-2.78,2.83-2.83-1.27-2.83-2.83,1.27-2.83,2.83-2.83h0ZM27.07,28.56v.09c0,.57-.24,1.08-.61,1.46h0v.05c-.38.33-.9.57-1.46.57s-1.08-.24-1.46-.61h0c-.38-.38-.61-.9-.61-1.46v-.09h1.41v.09c0,.19.05.38.19.47v.05c.09.09.28.19.47.19s.38-.09.47-.19v-.05c.14-.09.24-.28.24-.47t-.05-.09h1.41ZM30.99,28.56v.09c0,1.65-.66,3.16-1.74,4.24-1.08,1.08-2.59,1.79-4.24,1.79s-3.16-.71-4.24-1.79l-.05-.05c-1.04-1.08-1.7-2.55-1.7-4.2v-.09h1.41v.09c0,1.27.47,2.4,1.27,3.25h.05c.85.85,1.98,1.37,3.25,1.37s2.4-.52,3.25-1.37c.85-.8,1.37-1.98,1.37-3.25v-.09h1.37ZM34.99,28.56v.09c0,2.78-1.13,5.28-2.92,7.07-1.79,1.79-4.29,2.92-7.07,2.92s-5.23-1.13-7.07-2.92c-1.79-1.79-2.92-4.29-2.92-7.07v-.09h1.41v.09c0,2.4.94,4.53,2.5,6.08,1.56,1.56,3.72,2.5,6.08,2.5s4.52-.94,6.08-2.5c1.56-1.56,2.5-3.68,2.5-6.08v-.09h1.41Z'/%3e%3c/svg%3e)