70 Journal of Mining and Earth Sciences Vol. 65, Issue 6 (2024) 70 - 81
Landslide hazard assessment for the Batxat area of
Vietnam using GIS-based spatial prediction models
Binh Van Duong1,*, Igor Konstantinovich Fomenko2, Ha Viet Nhu1,
Phuong Huy Nguyen3, Olga Nikolaevna Sirotkina4, Kien Trung Nguyen5, Ha Ngoc
Thi Pham1
1 Hanoi University of Mining and Geology, Hanoi, Vietnam
2 Sergo Ordzhonikidzе Russian State Geological Prospecting University, Moscow, Russia
3 Vietnam Association of Engineering Geology and Environment, Hanoi, Vietnam
4 Lomonosov Moscow State University, Moscow, Russia
5 Institute of Geological Sciences - Vietnam Academy of Science and Technology, Hanoi, Vietnam
ARTICLE INFO
ABSTRACT
Article history:
Received 25th Apr. 2024
Revised 17th Aug. 2024
Accepted 9th Sept. 2024
Located in the northwest of Laocai province, Batxat district has been
frequently affected by natural disasters, including landslides and debris
flows. Therefore, landslide hazard assessment (LHA) has been a
significant task for planning, economic development, and minimizing
human and property damage. For this purpose, landslide hazard maps
were established in this study using the Analytic Hierarchy Process (AHP)
and the combined Analytic Hierarchy Process - Frequency Ratio
(AHP&FR) models. Ten landslide-related factors were selected, including
elevation, slope, distance to road, distance to drainage, land use and land
cover (LULC), average monthly rainfall, lithology, aspect, distance to fault,
and relative relief. Afterwards, the weighted value of landslide-related
factors and the landslide susceptibility index (LSI) were determined using
the Analytic Hierarchy Process. The Frequency Ratio method was used to
calculate the weighted value of factor classes. Two landslide hazard maps
were established, and the study area was divided into five hazard zones:
very low, low, moderate, high, and very high. The performance of the
models was determined using the area under the curve (AUC) of the
receiver operating characteristic (ROC), the seed cell area index (SCAI),
and the precision of the predicted results (P). The AUC values for the
success rate of these models were 0.72 and 0.75, and for the prediction
rate were 0.67 and 0.70, respectively. The evaluation results of the models
showed that, although both the AHP and combined AHP&FR models have
good performance for landslide hazard mapping, the AHP&FR model
produces more accurate outcomes than the AHP model.
Copyright © 2024 Hanoi University of Mining and Geology. All rights reserved.
Keywords:
Analytic Hierarchy Process,
Batxat,
Frequency Ratio,
GIS,
Landslide hazard.
_____________________
*Corresponding author
E - mail: duongvanbinh@humg.edu.vn
DOI: 10.46326/JMES.2022.65(6).07

Binh Van Duong et al./Journal of Mining and Earth Sciences 65 (6), 70 - 81 71
1. Introduction
Landslide is one of the most devastating
natural disasters that occurs worldwide, causing
significant damage to people and property
(Althuwaynee et al., 2012; Mandal & Mondal,
2019; Nguyen et al., 2021; Tran et al., 2021). Their
occurrence is attributed to the Earth's geological
environment and meteorological processes (Ma
et al., 2021). Landslides are frequently caused by
geologic, geographic, or climatic factors that are
common in large areas. Landslide causes and
triggers include slope-related factors that may
increase shear stresses and reduce shear strength
(Varnes, 1978). Therefore, knowing the
mechanisms of landslides and landslide hazard
mapping (LHM) is important and may be
regarded as a standard tool to assist decision-
making activities (Bui et al., 2016).
Landslide susceptibility, landslide hazard,
and landslide risk are the three fundamental
components of the landslide study (Shano et al.,
2020). Landslide susceptibility mapping (LSM) is
the process of determining the spatial distribution
and classifying terrain units based on their
tendency to generate landslides. A landslide
susceptibility map is the basis for establishing a
landslide hazard map, which indicates the
likelihood of landslide events throughout a
particular period and in a specific area (Varnes et
al., 1984).
Recently, numerous GIS-based models and
approaches have been used by scientists to
evaluate landslide hazards and generate hazard
maps depicting their spatial distribution (Akgun
& Türk, 2010; Vahidnia et al., 2009). In general,
these models can be classified into three groups:
1) heuristic, 2) deterministic, and 3) statistical
methods (Dou et al., 2019). In landslide studies,
various decision-making support tools for GIS-
based heuristic analysis methods, including the
Analytical hierarchy process (AHP), have been
developed (Akgun & Türk, 2010). The AHP (Saaty,
1977, 1990, 2008) is a decision-making method
that was originally suggested and developed by
Saaty. Its primary purpose is to provide solutions
to decision-making and estimating issues in
multivariate environments. There are many
bivariate statistical approaches for mapping
landslide susceptibility, of which the Frequency
ratio (FR) method is one of the most frequently
used (Shano et al., 2021).
In landslide studies, the AHP and FR have
been used by many authors all over the world,
including those in Vietnam for LHM (Dang et al.,
2020; Le et al., 2021; Senouci et al., 2021; Shano et
al., 2021). Additionally, the AHP has been
combined with other methods to improve the
effectiveness of LHA (Mokarram & Zarei, 2018;
Zhang et al., 2016). In this study, the AHP and the
combined AHP&FR models were employed for
LHM in Batxat, Laocai. In comparison with the
AHP, the FR considers the correlation between
the locations of historical landslides and the
related factors, so this approach can improve the
performance of the landslide prediction. To
evaluate the performance of the models, the
landslide susceptibility maps and landslide
hazard maps were compared with the landslide
inventory map using the area under the curve
(AUC) of the receiver operating characteristic
(ROC), the seed cell area index (SCAI), and the
precision of the predicted results (P) values.
2. Materials and methods
2.1. Study area
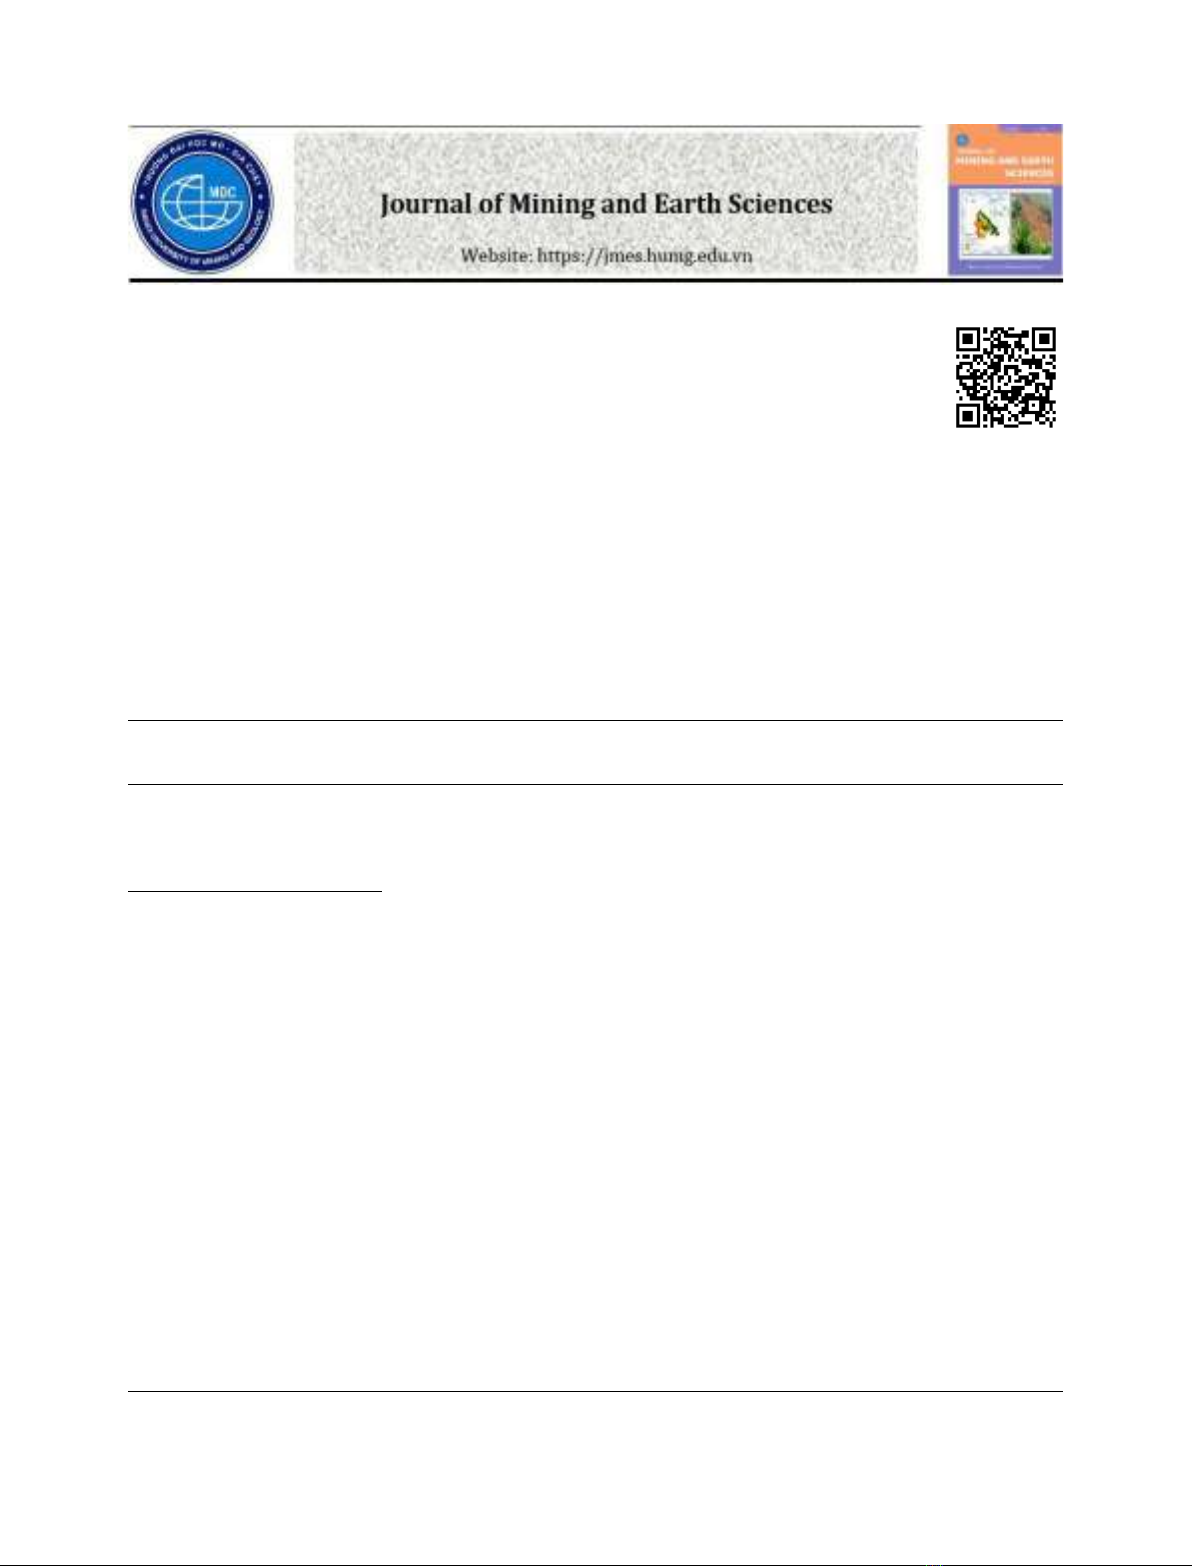
Batxat is a district in the Northwest Vietnam
mountainous region, which is known as one of the
most landslide-prone regions in the country (Bui
et al., 2017) (Figure 1a). Some landslide events
were recorded in the study, such as a landslide in
Phin Ngan commune (2004) that killed 23 people
(Figure 1b), medium-sized landslides in Muong
Hum commune (2013), Phin Ngan (2020).
Landslides in the Northwest Vietnam region are
caused by eight main factors that are (Nguyen &
Dao, 2007): 1) Relief slope: Landslides often occur
at slopes greater than 250 (most frequently
between 300 and 450); 2) weathering process of
rocks: Numerous landslides with a sliding surface
at the interface between the original rocks and the
incomplete weathering zone (Tran et al., 2019); 3)
Modem present tectonic movement; 4) Hydro-
system: Landslides often occur in regions with
heavy rainfall, and throughout the rainy season;
5) Vegetation density: Landslides occur most
often and strongly in areas with little plant cover;
72 Binh Van Duong et al./Journal of Mining and Earth Sciences 65 (6), 70 - 81
6) Striking and dipping of original rocks:
Numerous landslides occur in locations where the
relief slope direction coincides with the dipping or
foliation of original rocks; 7) Physical property
and structure of original rocks: Landslides often
occur in weakening and severely broken-up rock
zones; 8) Human activity that may trigger a
landslide directly or indirectly. The study area has
numerous geological formations that may be
divided into three groups: 1) Shales, sandstones,
and siltstones (SSS); 2) Quartz-biotite schists,
graphite schists, and amphibolites (QGA); 3)
Granodiorite, granite, and granite-migmatite
(GGM). The total annual rainfall in the study
region ranges from 2,000 to 3,600 mm due to its
location in the high rainfall zone of the Hoang Lien
Son mountain range (Bui et al., 2017).
2.2. Analytic Hierarchy Process (AHP)
In the AHP method (Saaty, 1990, 2008; Saaty
& Vargas, 2001), the landslide susceptibility map
of the study area could be prepared by utilizing
class weights and factor weights with a
reasonable consistency ratio (CR).
The Consistency Ratio (CR) is the ratio of the
consistency index (CI) to the average consistency
index (RI) for the same order matrix (Saaty,
2002). The consistency index (CI) is calculated
using the following formula (Saaty, 1990, 2002):
𝐶𝐼 =𝜆𝑚𝑎𝑥 −𝑛
𝑛 − 1
(1)
Where λmax - the largest eigenvalue and n –
the order of the matrix. If the consistency ratio
(CR) is less than 10%, the weight estimate (W) is
considered appropriate (Saaty, 1990). As a final
step, all of the weights of the classes and factors
are integrated into a single landslide susceptibility
index (LSI) (Cantarino et al., 2019):
𝐿𝑆𝐼 = ∑𝑊𝑗.𝑋𝑖𝑗
𝑛
𝑗=1
(2)
Where Wj - the weight of factor j, Xij - the
weight of class i of factor j, and n - the number of
factors.
2.3. Frequency ratio method (FR)
The FR method has been widely and
effectively applied in various studies for LSM
(Gholami et al., 2019; Shano et al., 2021). Based on
the analysis of relationships between the
distribution of landslides and each landslide-
related factor, the frequency ratio approach
determines the correlation between the locations
of landslides and these factors in the study area.
As a result, the frequency ratio values for each
Figure 1. Location of study area (a) and photo of a landslide in Phin Ngan commune (b).
Binh Van Duong et al./Journal of Mining and Earth Sciences 65 (6), 70 - 81 73
factor were calculated based on their association
with landslides (Yalcin et al., 2011). The frequency
ratio of each range/class of all landslide-related
factors is summed together to get the LSI (Mandal
& Mondal, 2019; Shano et al., 2020):
𝐿𝑆𝐼 = ∑𝐹𝑟
(3)
Where LSI – landslide susceptibility index; Fr
– frequency ratio/rating for each class/range of
landslide-related factor.
2.4. Landslide inventory map
Actual landslide mapping in the study area is
critical for defining the connection between the
landslide distribution and the influencing
variables (Pourghasemi et al., 2013). The
landslide inventory maps have been used to
assign or compute rating values for landslide-
related factors and validate analysis results. In the
study area, a total of 156 landslide sites were
identified and mapped, with the largest landslide
covering an area of about 20896.06 m2 and the
smallest covering an area of approximately
917.65 m2. The training and testing data sets were
prepared using 70% and 30% of the landslide
locations, respectively.
2.5. Landslide-related factors
The landslide-related factors are considered
to depend on the features of landslides, data
available, and the connection with historical
landslides. In this study, rainfall is the main
landslide triggering factor, and most landslides
occurred along the roads. In addition, the set of
factors has been selected in previous studies for
LSM (Bui et al., 2017; Le et al., 2021). Therefore,
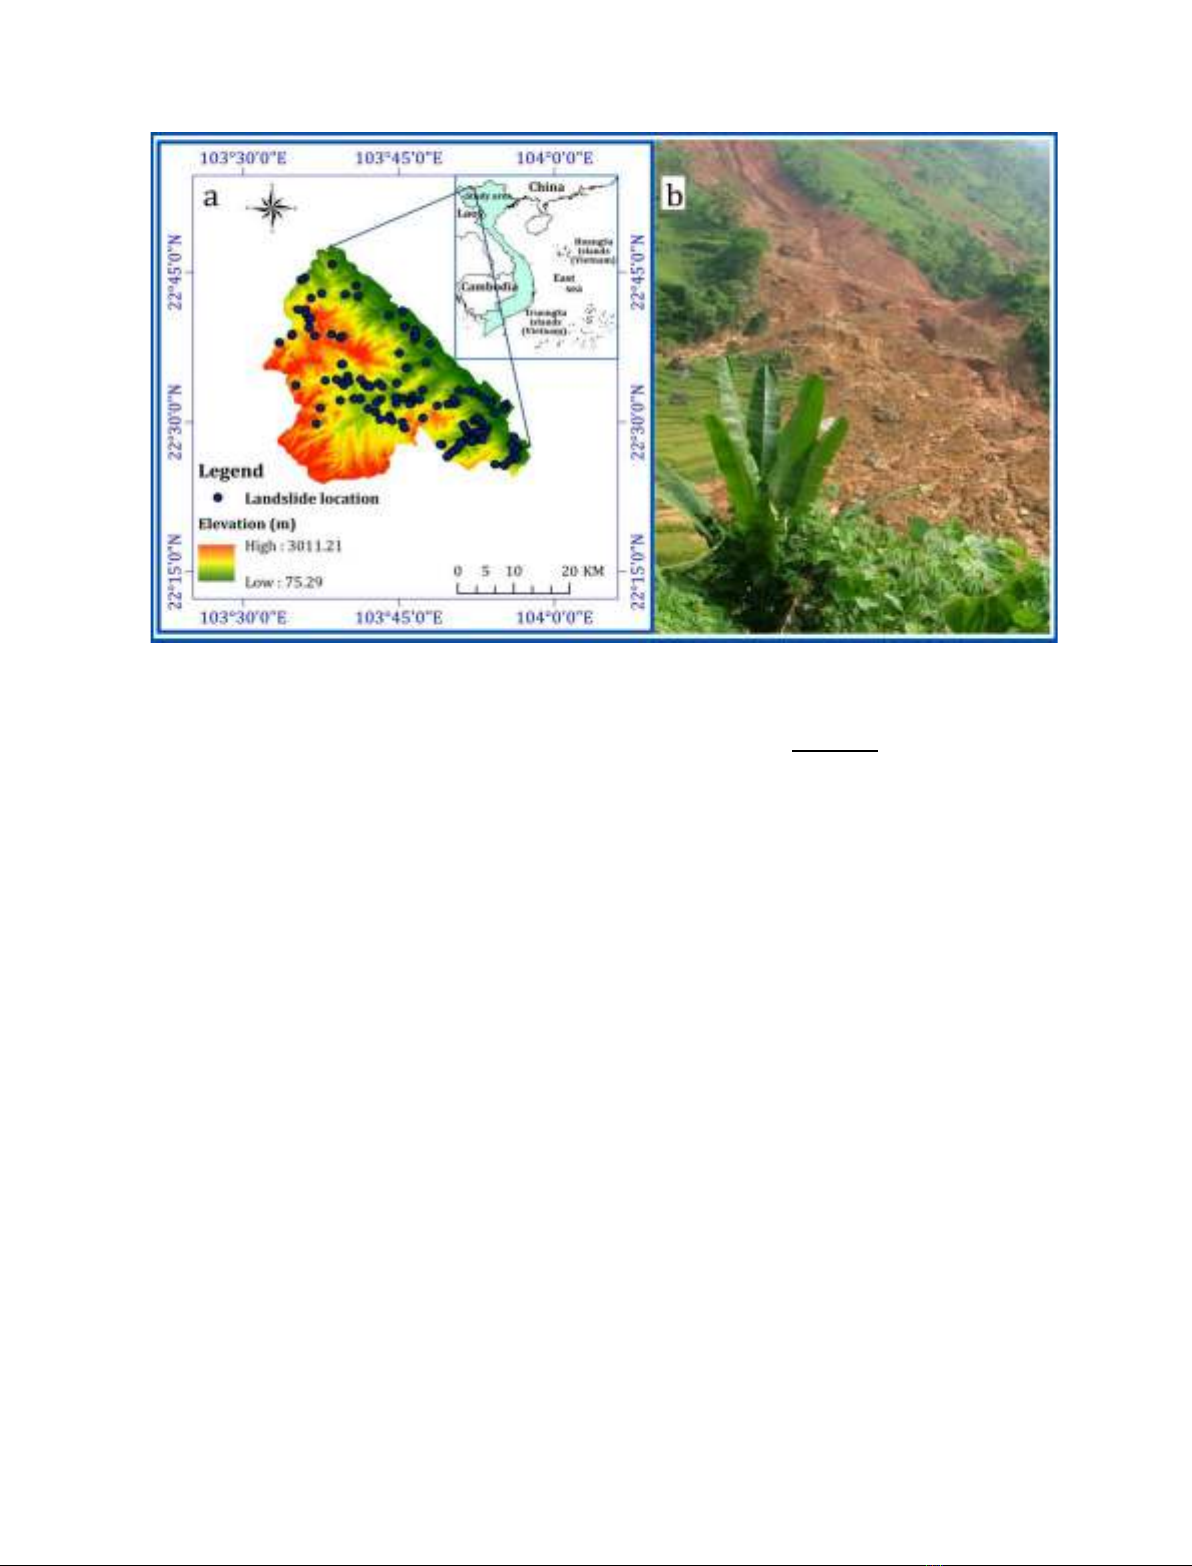
ten landslide-related factors were selected for
LSM and LHM: Elevation, slope, distance to road,
distance to drainage, land use and land cover
(LULC), rainfall, lithology, aspect, distance to
faults, and relative relief (Figure 3). Two
estimators, "Accountability" (A) and "Reliability"
(R), were used in this study to determine the
importance of the factors causing landslide
occurrences (Greenbaum et al., 1995a;
Greenbaum et al., 1995b). The class weights of
these factors were determined using the AHP and
FR methods. The factor weights were determined
using the AHP method (Table 1).
Figure 2. Flow chat of LHA.
2.6. Validation of the landslide susceptibility
map
The validation was produced by comparing
the landslide susceptibility and landslide hazard
maps to the landslide inventory map. In this study,
the AUC, SCAI, and P values were used for
evaluating the performance of the models. The
AUC value ranges between 0.5 and 1.0 (Cantarino
et al., 2019) and is divided into six categories
(Šimundić, 2009). The SCAI value, which indicates
the density of landslides within each class, is
calculated as the ratio of the area (%) of each
landslide hazard class to the area (%) of
landslides within each class (Süzen & Doyuran,
2004). The P value is calculated by the ratio of the
area covered by landslides in the upper-moderate
landslide hazard class (KS) to the total area
covered by landslides (S) in the study area
(Mokhtari & Abedian, 2019).
3. Results
Figure 2 represents the process of landslide
hazard assessment performed in this study.
According to the data analysis, LULC and Distance
to road play the most significant role in landslide
occurrences. The LSI was calculated using
formula (2) and two landslide susceptibility maps
were established in GIS (Figure 4). The calculated
LSI value, which ranged between 0.12 and 0.48
(AHP model), and 0.07 and 0.45 (combined
AHP&FR model), was categorized into five
landslide hazard classes: very low, low, moderate,
high, and very high (Figure 5).
74 Binh Van Duong et al./Journal of Mining and Earth Sciences 65 (6), 70 - 81
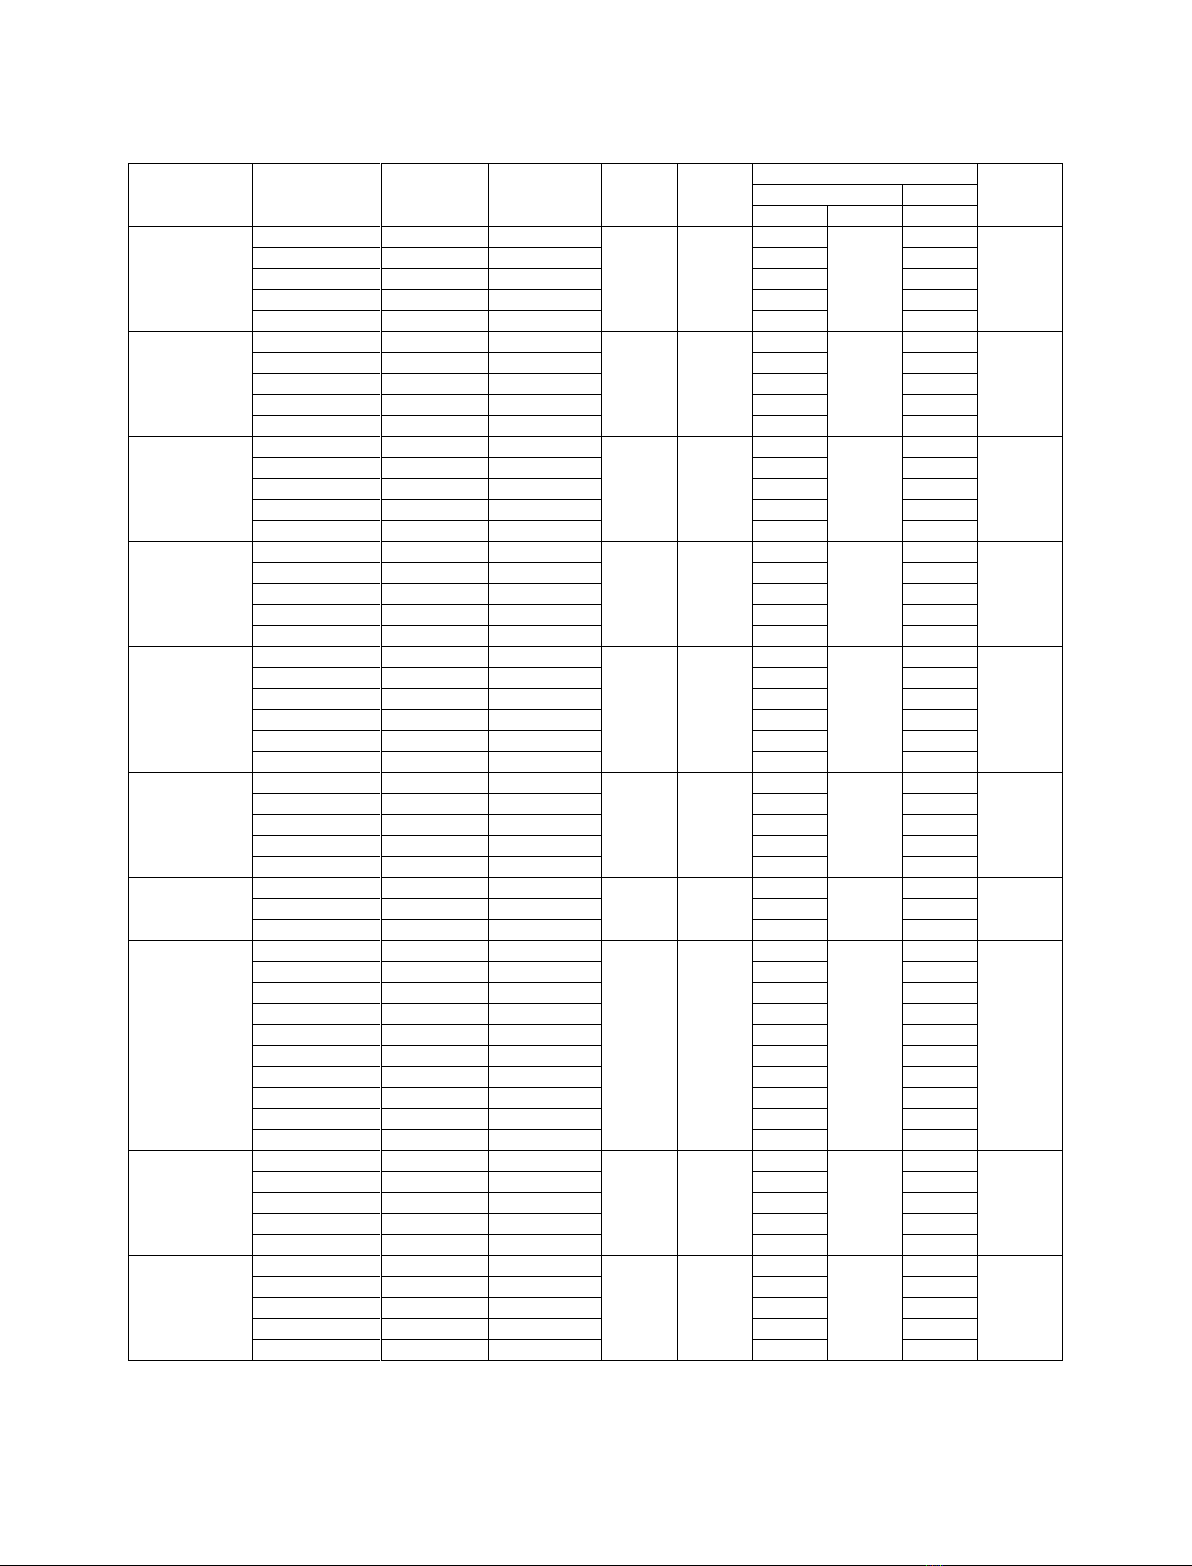
Table 1. Weights of classes and factors using AHP and FR.
Factor
Class
% Area
Landslide
A
R
Class weight
Factor
weight
(Wj)
AHP
FR
Xij
CR
FR
Elevation
(m)
< 500
23.32
54
76.85
8.51
0.429
0.027
2.124
0.112
500÷1000
24.15
31
0.278
1.178
1000÷1500
21.70
19
0.184
0.803
1500÷2000
18.50
5
0.065
0.248
> 2000
12.34
0
0.044
0
Slope
(Degree)
< 15
13.25
17
44.24
6.14
0.124
0.04
1.177
0.103
15÷25
24.62
36
0.343
1.342
25÷35
33.87
32
0.335
0.867
35÷45
21.6
22
0.158
0.934
> 45
6.66
2
0.04
0.276
Distance to
road
(m)
< 500
48.60
91
80.38
8.69
0.55
0.039
1.718
0.209
500÷1000
20.13
15
0.24
0.684
1000÷1500
10.21
2
0.082
0.179
1500÷2000
5.83
0
0.051
0
> 2000
15.23
1
0.077
0.06
Distance to
drainage
(m)
< 250
28.55
49
74.04
7.18
0.531
0.031
1.574
0.102
250÷500
25.62
29
0.118
1.039
500÷750
21.91
22
0.192
0.921
750÷1000
16.52
7
0.118
0.389
> 1000
7.41
2
0.04
0.247
LULC
Water
0.42
0
44.37
16.84
0.044
0.018
0
0.181
Forest
79.64
62
0.487
0.714
Agriculture
6.1
5
0.071
0.752
Shrub
11.18
28
0.232
2.298
Build area
1.56
12
0.122
7.058
Bare land
1.09
2
0.045
1.679
Average
monthly
rainfall
(mm/mth)
< 250
33.76
27
56.70
7.20
0.348
0.021
0.734
0.062
250÷280
26.94
29
0.492
0.988
280÷310
24.89
25
0.072
0.922
310÷350
9.85
19
0.044
1.77
> 350
4.56
9
0.044
1.811
Lithology
SSS
14.52
25
67.7
5.81
0.143
0
1.58
0.107
GGM
46.67
51
0.571
1.003
QGA
38.81
33
0.286
0.78
Aspect
Flat
0.18
0
72.97
6.78
0.02
0.021
0
0.027
North
8.13
11
0.088
1.241
Northeast
17.56
13
0.111
0.679
East
16.48
17
0.196
0.947
Southeast
11.25
10
0.077
0.815
South
9.52
15
0.144
1.445
Southwest
8.88
15
0.144
1.55
West
9.26
7
0.053
0.693
Northwest
11.51
12
0.1
0.957
North
7.25
9
0.067
1.139
Distance to
faults
(m)
< 900
48.71
54
98.59
5.87
0.437
0.026
1.017
0.048
900÷2200
27.6
33
0.286
1.097
2200÷4200
11.86
18
0.171
1.392
4200÷6500
7.04
2
0.06
0.26
> 6500
4.79
2
0.045
0.382
Relative
relief
(m/km2)
< 250
12.23
10
73.12
6.74
0.088
0.037
0.75
0.05
250÷400
29.02
44
0.442
1.391
400÷520
27.97
37
0.297
1.213
520÷650
23.3
16
0.126
0.63
> 650
7.48
2
0.048
0.245


![Thiết kế thiết bị định vị nhóm GPS: Thu phát thông tin không dây [Chuẩn nhất]](https://cdn.tailieu.vn/images/document/thumbnail/2021/20210630/maoamin/135x160/7681625030696.jpg)