22 Journal of Mining and Earth Sciences, Vol 65, Issue 6 (2024) 22 - 33
A study on identifying and analyzing road traffic
incident hotspots on National Highway 1A, Thanh
Hoa province, Vietnam, employing Statistical and GIS
Techniques
Ha Thi Le 1,2, Thao Phuong Thi Vu 2*, Thao Phuong Thi Do 2
1 Campus in Ho Chi Minh City, University of Transport and Communications, Ho Chi Minh City, Vietnam
2 Hanoi University of Mining and Geology, Hanoi, Vietnam
ARTICLE INFO
ABSTRACT
Article history:
Received 29th May 2024
Revised 17th Sept. 2024
Accepted 09th Oct. 2024
The study focuses on the prevalence of road traffic accidents in Vietnam,
particularly along national highways, which are frequent and severe.
Specifically, it examines National Highway 1A passing through Thanh Hoa
province, utilizing statistics and geographic information systems (GIS) to
identify high-risk areas. Data from road traffic incidents spanning from
2020÷2023 were used to analyze spatial autocorrelation, kernel density
estimation (KDE), and Getis-Ord Gi* hotspot analysis. Spatial autocorrelation
assessed the autocorrelation of incidents, while KDE visualized hotspot
clusters. Meanwhile, Getis-Ord Gi* hotspot analysis determined the statistical
significance of incident hotspot locations. The analysis revealed a higher
concentration of hotspots in the northern section of the national highway
compared to the southern section. Notably, the section passing through
Thanh Hoa city center, Hau Loc, and Hoang Hoa districts exhibited very high
traffic density. Hotspots identified through Getis-Ord Gi* statistics aligned
with those detected using KDE. Furthermore, several hotspots were
concentrated at bends in the national highway, often lacking warning signs
despite high traffic density. The study’s findings serve as valuable references
for authorities, enabling them to implement timely intervention measures
such as infrastructure improvements or enhanced law enforcement to
address issues and provide warnings regarding road traffic incident risks.
Copyright © 2024 Hanoi University of Mining and Geology. All rights reserved.
Keywords:
Getis-Ord Gi*,
Hotspot,
Kernel density estimation,
Road traffic incident,
Spatial autocorrelation.
_____________________
*Corresponding author
E - mail: vuthiphuongthao@humg.edu.vn
DOI: 10.46326/JMES.2024.65(6).03

Ha Thi Le et al./Journal of Mining and Earth Sciences 65 (6), 22 - 33 23
1. Introduction
Road transportation plays a pivotal role in
every nation's socio-economic development and
international integration. However, road traffic
incidents (RTIs) are at risk, significantly
impacting human health and property. According
to a report by the World Health Organization
(2015), RTIs are most prevalent in low- and
middle-income countries, where the number of
deaths resulting from these incidents is three
times higher than in high-income countries
(Abdullah et al., 2021). In Vietnam, congestion
resulting from traffic incidents is commonplace in
major cities (Truong, 2023). Vietnam also exhibits
a high death rate due to RTIs, with approximately
2.34 deaths per 100,000 people (Peden, 2004).
Several factors contribute to RTIs, including
subjective human factors such as poor awareness
of road traffic safety laws, speeding, driving under
the influence of stimulants, and disregarding
traffic signals (Oliver et al., 2021).
Furthermore, other influencing factors
contribute to Vietnam's road traffic incidents
(RTIs). These include incomplete transport
infrastructure, resulting in numerous blackspots,
lax operation, management, and supervision of
transport activities, and the uneven quality of
vehicles participating in traffic (Tran et al., 2016).
To mitigate the risk of incidents, it is
imperative to have warnings regarding incident
hotspot locations (Khatun et al., 2024). According
to Mhetre & Thube (2023), hotspots are
considered as the number of severe injury
collisions occurring within a defined length
segment (500 m) in 3 years or if the number of
deaths is equal to or greater than 10. In other
words, a cluster of crashes with high levels of
injuries is called hotspots. Conversely, if there is a
cluster of low-injury crashes, it is called coldspots.
Researchers have employed various traditional
methods to identify hotspots, such as the incident
rate method (Carson & Powers, 2004), equivalent
property damage index (Campbell & Knapp,
2005), and the Empirical Bayes method (EB)
(Hauer et al., 2002). Among these, the most
effective method is the EB method (Manepalli et
al., 2011).
Nonetheless, the Empirical Bayes (EB)
method has limitations, notably the requirement
for training and proficiency in statistical analysis.
Numerous other techniques utilizing Geographic
Information Systems (GIS) to identify hotspots
have emerged, enabling the identification of areas
at high risk of incidents (Aguero-Valverde &
Jovanis, 2006).
Spatial statistics analysis of incident hotspots
is crucial in understanding the spatial patterns of
road traffic incidents. Moran's I statistic is a
commonly used technique for testing
autocorrelation. This method assesses whether a
set of incidents in an area is clustered, dispersed,
or randomly distributed by comparing the values
of a variable at one location with those at all other
locations of that variable. However, for detailed
identification of significant hotspot or cold spot
clusters, it is essential to utilize the Getis-Ord Gi*
statistical analysis (Nie et al., 2015).
Kernel density estimation (KDE) is a non-
parametric method well-suited for identifying
incident hotspots (Plug et al., 2011;
Prasannakumar et al., 2011). The KDE algorithm
delineates the range encompassing the risk of an
incident, visually indicating areas where incidents
are likely to occur based on spatial relationships.
Moreover, the KDE analysis generates a raster
layer wherein pixels are allocated values
corresponding to the intensity characteristic of
the entire area, facilitating comparison and
classification (Anderson, 2009).
However, KDE has limitations as it does not
furnish statistical significance of hotspots (Xie and
Yan, 2013; Yao et al., 2016), nor does it offer
criteria for prioritizing incident hotspots (Plug et
al., 2011). To address this shortfall, some studies
have employed Getis-Ord Gi* statistical to identify
critical locations where accidents occur (Manap et
al., 2019; Ord and Getis, 1995). The output of
Getis-Ord Gi*statistical analysis comprises a z-
score and p-value for each incident location,
aiding in determining whether the cluster is
statistically significant.
This study aims to integrate spatial
autocorrelation analysis, kernel density
estimation, and hotspot incident analysis utilizing
GIS to identify and assess the severity of traffic
incident hotspots. Moran's I index is employed to
detect incident clusters, while kernel density
estimation visually represents incidents in the
study area through color coding and
24 Ha Thi Le et al./Journal of Mining and Earth Sciences 65 (6), 22 - 33
corresponding density values. Furthermore, the
Getis-Ord Gi* statistic is utilized to determine the
statistical significance of these density values.
2. Materials and methodology
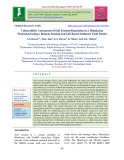
2.1. Study area
National Highway 1A serves as a crucial link
between the Northeast and Southeast regions of
Thanh Hoa province, spanning coordinates
between 19018′45′′ - 20008′00′′ North latitude
and 105004′30′′ - 105005′45′′ East longitude. This
highway traverses through 5 districts, one city,
and one town within the province. With a total
length of 98 kilometers, National Highway 1A
features a level III road classification (asphalt
road) and comprises four lanes (refer to Figure 1).
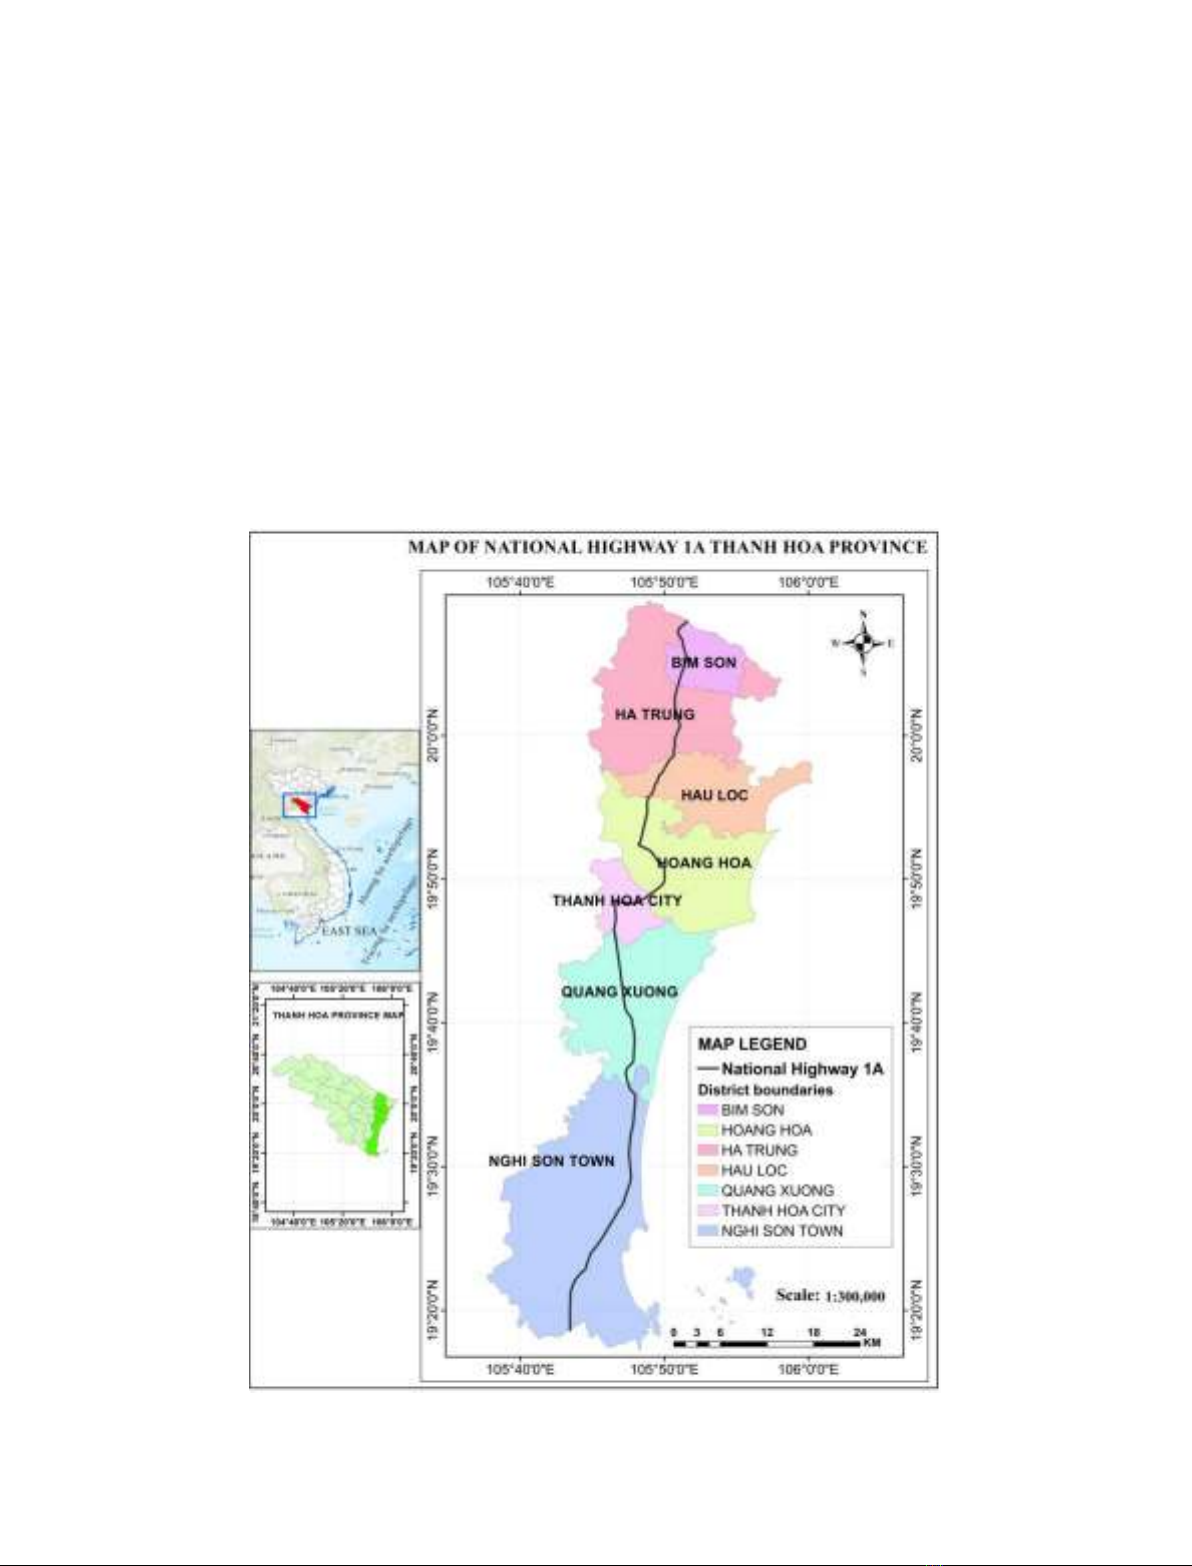
2.2. Data
Figure 2 illustrates the distribution of
incident locations in 4 years (2020÷2023) on
National Highway 1A in Thanh Hoa province.
There are two different datasets used for this
study, including:
- Map of Thanh Hoa Road network and
administrative boundaries digitized from Google
Earth in shapefile form. Road attribute data
includes length, width, road type, speed limit, etc.,
collected from reports provided by Thanh Hoa
Figure 1. Study area - National Highway 1A passing through Thanh Hoa province.
Ha Thi Le et al./Journal of Mining and Earth Sciences 65 (6), 22 - 33 25
Department of Natural Resources and
Environment.
- Road traffic incident dataset for four years
from 2020÷2023 on National Highway 1A passing
through Thanh Hoa province provided by the
Transportation Police Department. This dataset
includes essential information such as the date,
time, and location of the incident, type of incident
and vehicle, number of deaths, number of injuries,
etc. These datasets were combined and processed
using ArcGIS 10.8 software. The process changes
raw data into input data for the GIS system
includes (1) Clean and filtering data to remove
incomplete data; (2) Convert coordinates; (3) Add
Figure 2. Map of road traffic incident distribution on National Highway 1A in Thanh Hoa
province from 2020÷2023.
26 Ha Thi Le et al./Journal of Mining and Earth Sciences 65 (6), 22 - 33
coordinate data to determine the actual location
of the accident on the map; (4) Enter attribute
information; (5) The join and link method in
ArcGIS 10.8 was then used to link the road data
with the road accident data.
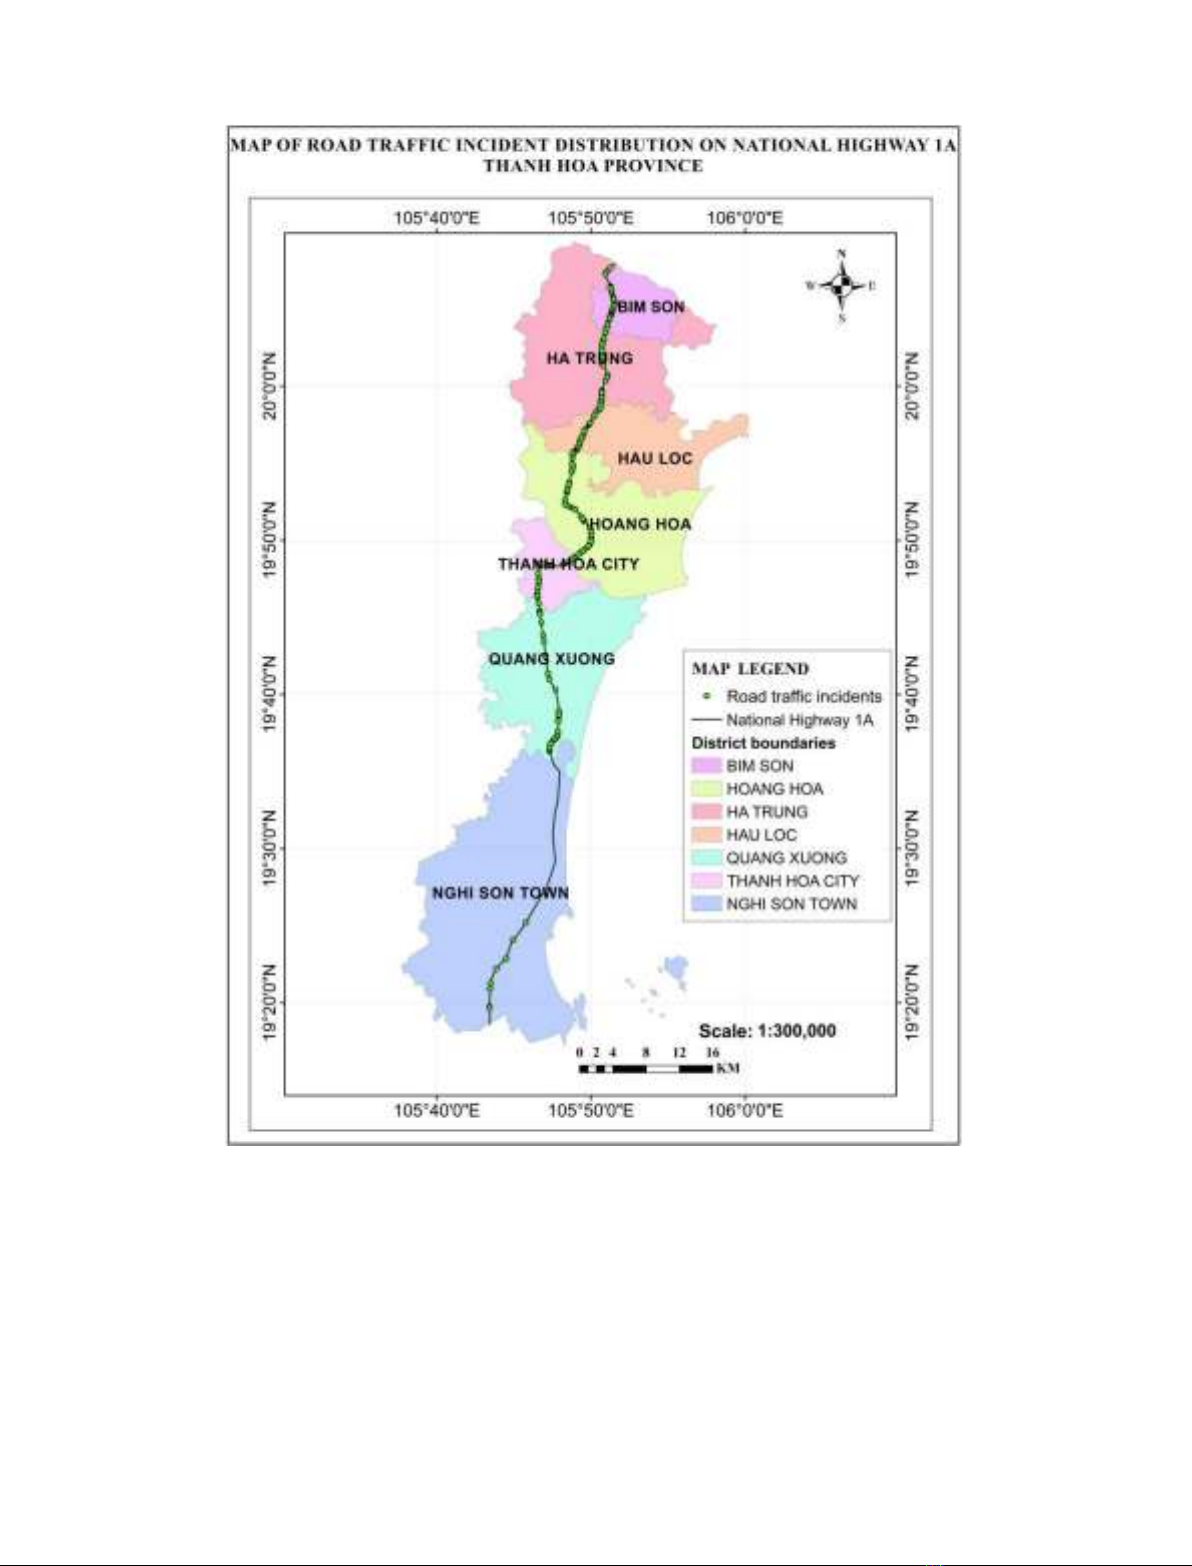
2.3. Methodology
2.3.1. Research Framework
After collecting data and building a thematic
database of road traffic incidents in National
Highway 1A in Thanh Hoa province for four
consecutive years and a geographical database
(including road network and administrative
boundaries), analysis results were obtained by
running the hotspot analysis tool in ArcGIS
software. The study proposes a process for
analyzing incident hotspots using spatial
autocorrelation techniques, kernel density
estimation, and Getis-Ord Gi* spatial statistics, as
shown in Figure 3.
2.3.2. Data analysis
*Moran's index statistics of spatial autocorrelation
Statistically significant analysis of hotspots is
a measure of spatial autocorrelation by observing
incidents' distribution patterns. The test will
decide to stop when there is a random
distribution and vice versa. The spatial
autocorrelation technique simultaneously
examines the incident's location and properties
(Afolayan et al., 2022). Values of determined
Moran's I ranging from -1÷1 Are considered
statistically significant (Liu et al., 2019). If the
Moran index value is close to 1, the data contain
spatial autocorrelation and cluster patterns; If the
Moran index value is close to -1, the data is not
continuous and scattered. While an absolute zero
index value indicates no spatial autocorrelation
(Nejadrekabi et al., 2022). Based on the weight
matrix, the Moran statistic is calculated using
equation (1) as below (Lee and Wong, 2001).
I = nS0
∑ ∑
wi,jzizj
nj=1
ni=1
∑
zi
2ni=1
(1)
In which: zi, zj are the deviation from the
average value; wi,j is the spatial weight between
feature i and j; n is the number of features, S0 is the
sum of all spatial weights and is calculated as
follows:
S0=
∑ ∑
wi,j
nj=1
ni-1
(2)
The zi score is calculated as follows:
zi =
I-E
[
I
]
√
V
[
I
]
(3)
With:
E[I]= -1/(n-1)
(4)
V[I] = E[I2]
- E[I]2
(5)
Figure 3. Road traffic incident hotspot analysis process.

![Thiết kế thiết bị định vị nhóm GPS: Thu phát thông tin không dây [Chuẩn nhất]](https://cdn.tailieu.vn/images/document/thumbnail/2021/20210630/maoamin/135x160/7681625030696.jpg)