Journal of Science and Transport Technology Vol. 2 No. 4, 20-25
Journal of Science and Transport Technology
Journal homepage: https://jstt.vn/index.php/en
JSTT 2022, 2 (4), 20-25
Published online: 27/12/2022
Article info
Type of article:
Original research paper
DOI:
https://doi.org/10.58845/jstt.utt.2
022.en.2.4.20-25
*Corresponding author:
E-mail address:
khanhdq@utt.edu.vn
Received: 02/12/2022
Revised: 15/12/2022
Accepted: 18/12/2022
Model design of automatic defective product
sorting system
Lubos Chovanec1, Khanh Quang Duong2*, Huong Thi Vuong2, Lanh Thi Ngo2,
Nam Thi Nguyen2, Dung Duy Tran2, Son Thai Nguyen2, Long Hai Pham2
1Slovak University of Technology, Bratislava, Slovakia
2University of Transport Technology, Hanoi, Vietnam
Abstract: In industrial field, various automation techniques have been studied
and applied to increase productivity, better accuracy and eliminate the human
errors. This paper developed a model of the automatic defect sorting system
to distinguish between qualified and defective products. By using image
processing to detect the matching of captured images with the storage based
samples, the system ensures products with different colours are correctly
delivered to the designated box. In this study the detection of three types of
products were tested by image processing provided by LabVIEW software.
They are the cube face with full of red panels, the cube face with 3 of 4 red
panels and the others. The test results of the system achieved approximately
an accuracy of 96% under stable lighting conditions.
Keywords: Image processing, Sorting system, LabVIEW, PLC, OPC server.
1. Introduction
In recent times, various automatic sorting
systems have been developed. The applications of
sorting systems vary from agricultural products,
consumer manufactured products, solid waste, etc.
Elatopo et al. designed a model and
simulated the functionalities of an automatic sorting
machine using a capacitive proximity sensor [1]. In
order to achieve this developed automatic sorting
methods, the images of the objects (i.e. plastics,
wood and steel) were captured with the proximity
sensor and the conveyor belt transports the
material from one point to another one.
Sheth et al. proposed an automatic sorting
system using machine vision [2]. In this paper,
color based identification of the parts was studied
and then objects were sorted according to different
colors. After recognizing the color of the object,
robotic arm will pick and place them accordingly.
A model using smart camera for quality
inspection and grading of good products was
designed by Guo and colleagues [3]. In that,
evolutionary learning process was developed for
simplicity and for visual inspection of food
products.
Soldatov et al. proposed a system using
ultrasonic sensor fixed above conveyor to measure
the height of the pallets [4]. According to the range
of tolerance of heights on the surface of the pallet
the system can detect defect, slope of pallet
surface or foreign object on the pallet surface.
The aim of this research is to design a model
of sorting system by image processing method
which can detect and classify three types of cube’s
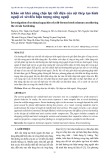
faces as shown in Figure 1.
- The first one with 4 red panels is considered
as a perfect product with no defect.
- The second one with 3 of 4 red panels is
considered as a product has slight defect.
- The last one with 2 red panels is considered
JSTT 2022, 2 (4), 20-25
Duong et al
21
as a product has serious defect (any cube’s faces
with less than 3 red panels are considered as
products has serious defect).
Figure 1. Three types of classified products
2. Design of the system
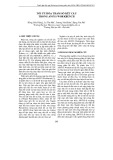
2.1. Block diagram
Power
supply PLC
Optical
sensor
Electro-pneumatic
valves
Pneumatic
cylinders
Air
compressor
PC
Camera
OPC server
USB
cable
Digital input
Digital output
Figure 2. Block diagram of the sorting system
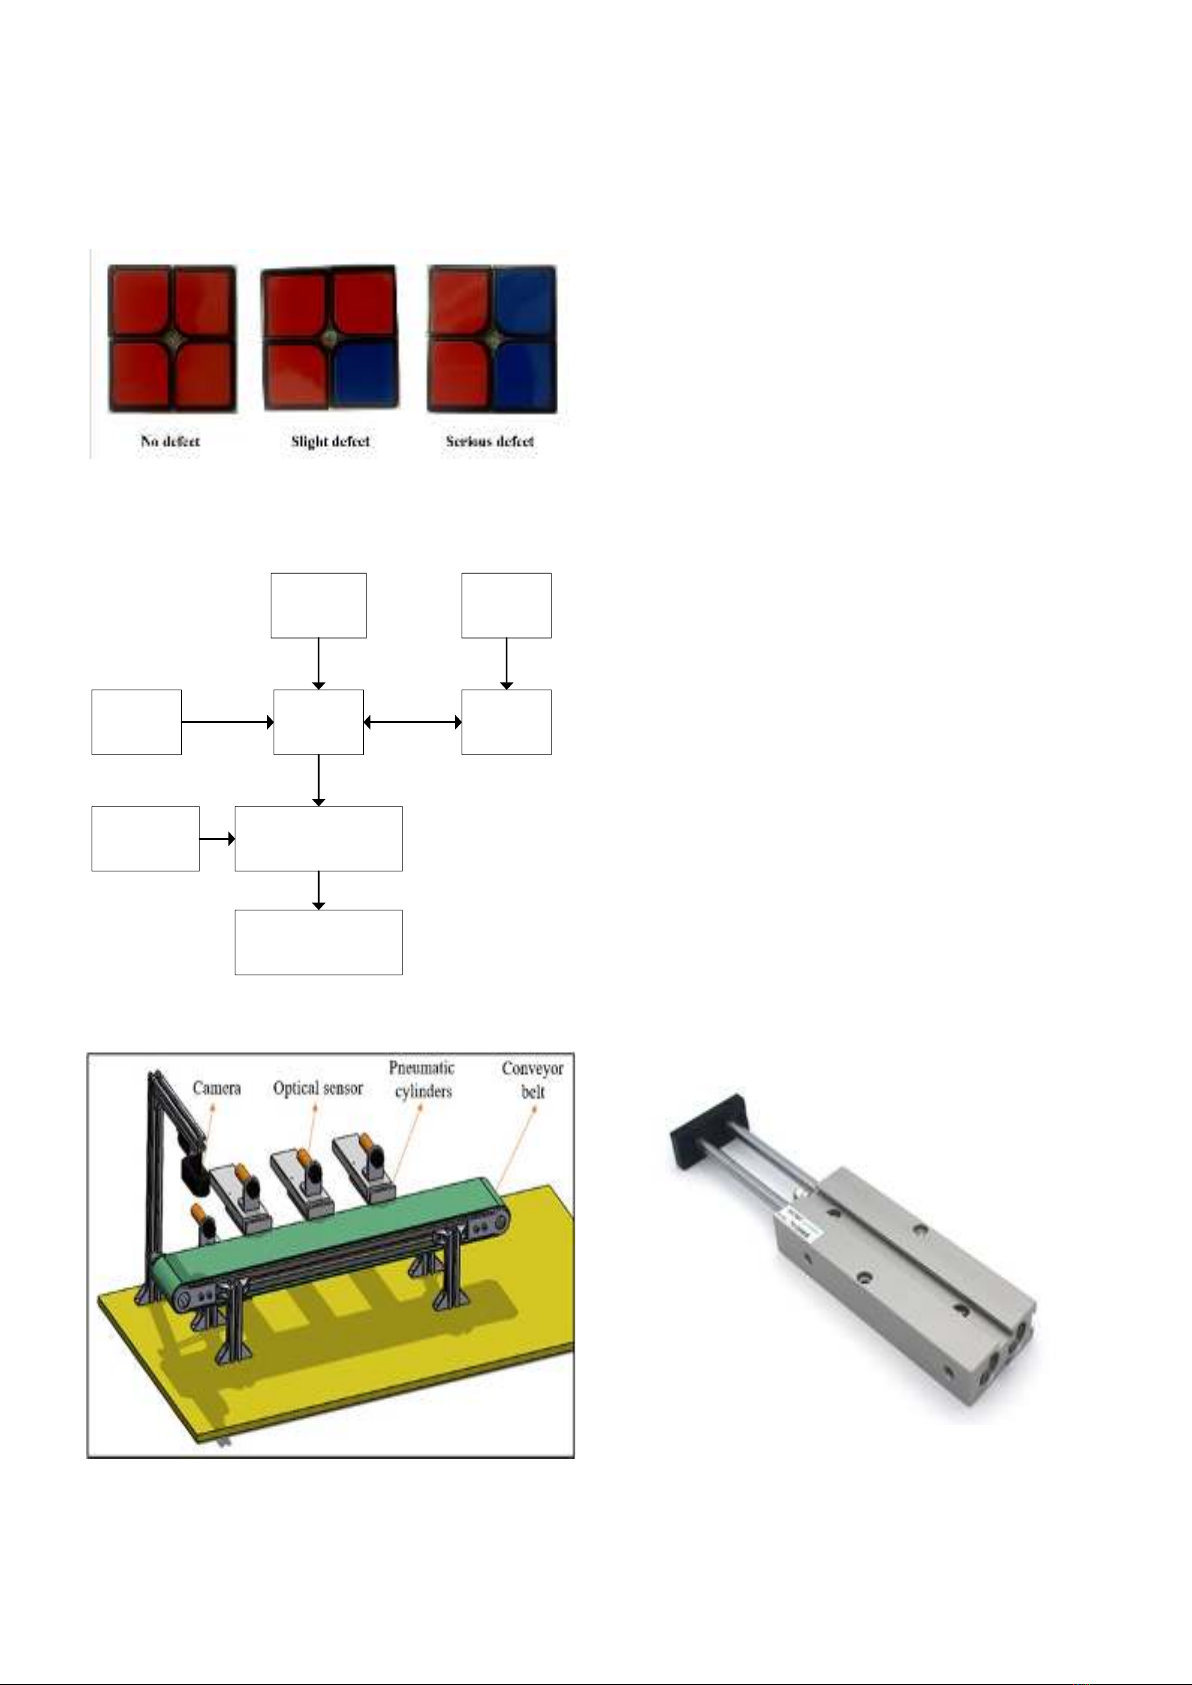
2.2. Working of the system
Figure 3. 3D drawing of the sorting system
Initially product is transported on conveyor
belt. When optical sensor detects the presence of
the particular product, digital signal is sent to PLC.
PLC stops the movement of conveyor belt for one
second for capturing image with high resolution.
Once image is captured, the software of the system
(NI LabVIEW) will process on captured image and
will generate signals according to classification.
The signals will be sent back to PLC which controls
the electro-pneumatic valves to classify products to
the designated boxes.
3. Components of the system
3.1. PLC
PLC (Programmable Logic Controller) is an
industrial controller that gets information from the
inputs (push buttons, optical sensors), receives
control signal from PC via OPC server and controls
the actuator including conveyor belt controlled DC
motor, electro-pneumatic valves.
In this model, Simatic S7-1200 CPU 1212C
6ES7212-1AE40-0XB0 was used. It has 8 digital
inputs DC, 6 digital outputs DC, 2 analog inputs
with the range from 0 to 10VDC and program/data
memory of 75KB.
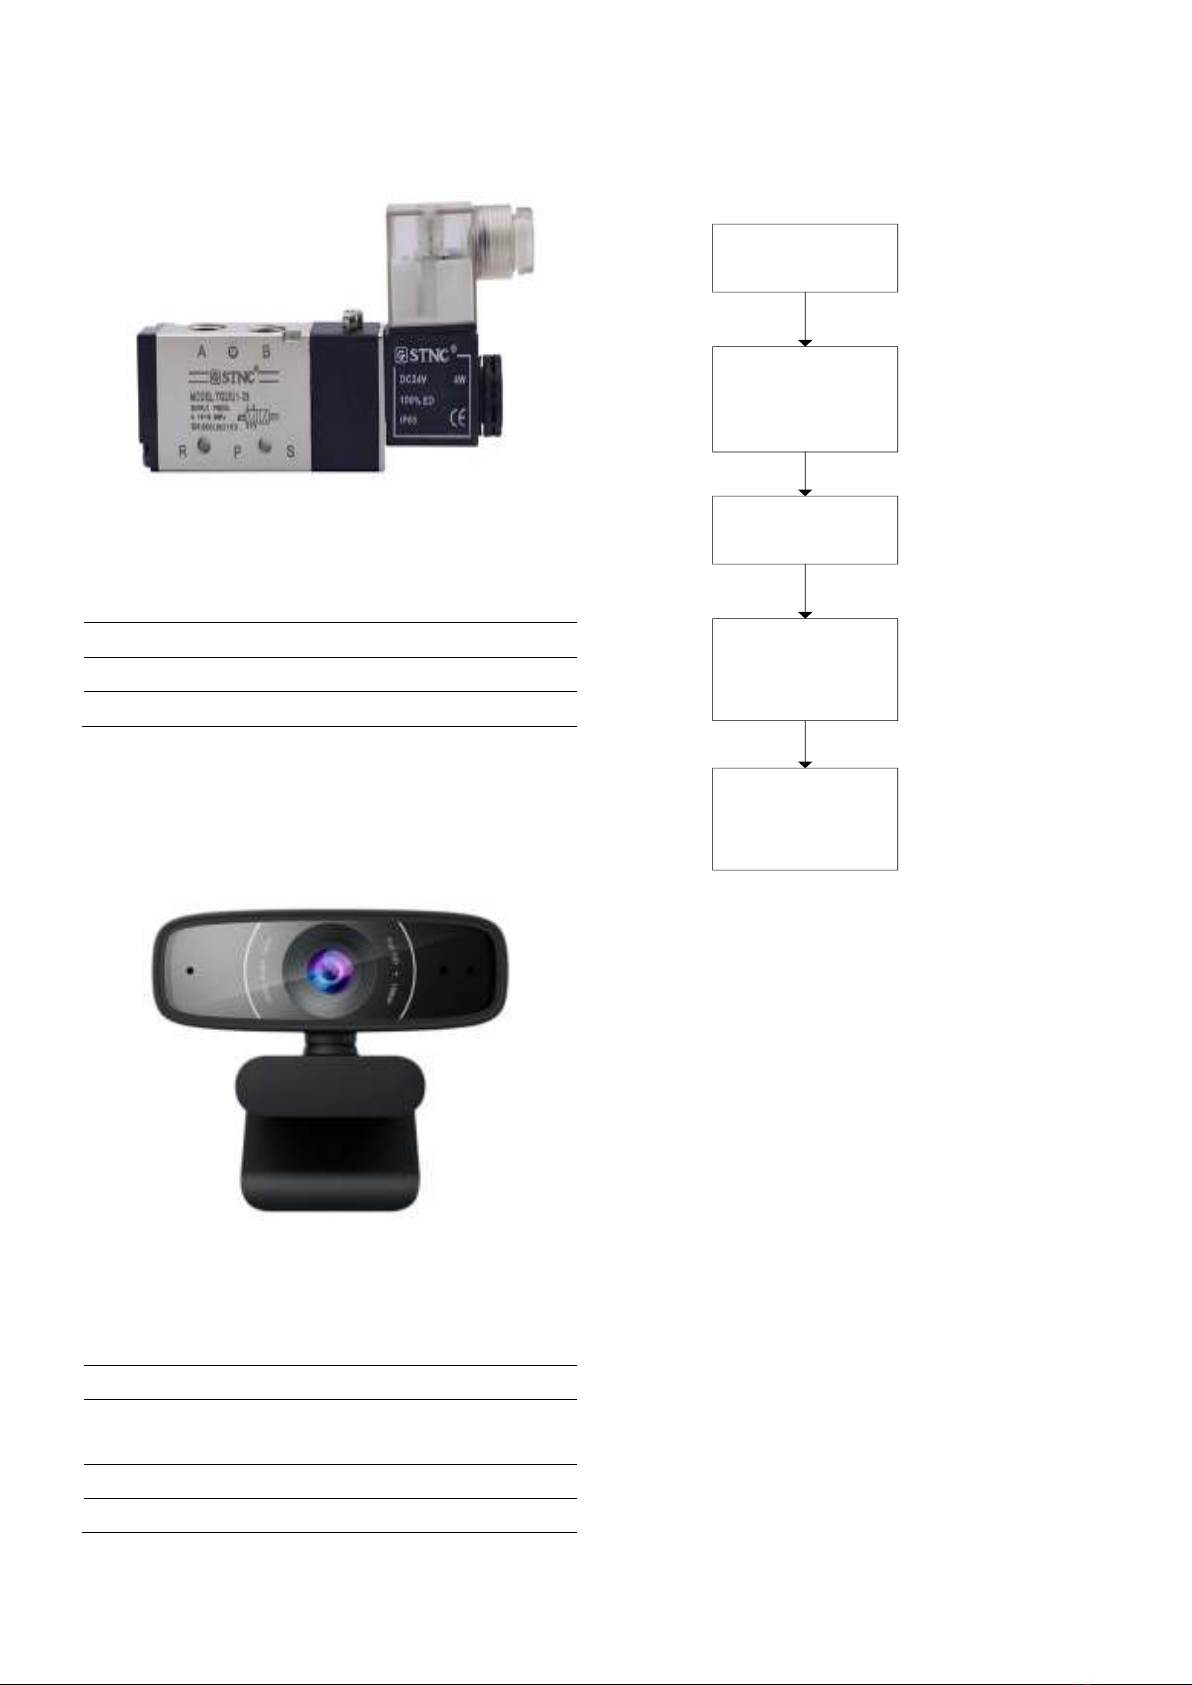
3.2. Pneumatic cylinders
Pneumatic cylinders are mechanical devices
which use the power of compressed gas to produce
a force in reciprocating linear motion. In our
application they are used to move the products to
designated boxes.
Figure 4. Pneumatic cylinder AirTAC TN10-75
3.3. Electro-pneumatic valves 5/2
Electro-pneumatic valves are valves that use
JSTT 2022, 2 (4), 20-25
Duong et al
22
electricity to control pneumatic cylinders.
Figure 5. Electro-pneumatic valves 5/2 STNC TG
2521-08
Table 1. Specification of electro-pneumatic valve
5/2 STNC T2512-08 [5]
Valve Type
5/2
Pressure
0.15-0.7 MPa
Usage voltage
24V
3.4. Optical sensor
Optical sensor E3F-DS30C4 is used in the
model to detect the objects with the distance of 60-
300mm, type of output is NPN.
3.5. Camera
Figure 6. Webcam Asus Streaming Kits C3
It will capture the image of object when signal
is given to it by computer.
Table 2. Specification of camera [6]
Resolution
HD (1980 x 1080 pixels)
Number of frames
per second
30 fps
Rotation
90 degree
Connection
USB 2.0
4. Software components
4.1. Image processing
Obtain images
from camera
Convert image to
8 bit grayscale
and extract single
colour plane
Detect red panels
Compare the
number of red
panels detected
with 4 and 3
Output the sorting
results as boolean
data
Step 1
Step 2
Step 3
Step 4
Step 5
Figure 7. Five steps of image processing
The system uses NI LabVIEW software
instead of WinCC provided by TIA Portal because
of image processing to identify and classify
products. The image processing in LabVIEW takes
5 steps:
(1) Obtain images from camera: the Vision
Acquisition tool obtains images from camera that is
connected to the PC via USB cable.
(2) Convert image to 8-bit grayscale: the
IMAQ Create tool converts the image to 8-bit
Grayscale and IMAQ Extract Single Color Plane
tool extracts single color plane.
(3) Detect red panels: NI Vision Assistant
software was used. It can be run in conjunction with
NI LabVIEW.
Pattern Matching tool was used to detect the
red panels. A template was set up as a red panel
(through the process of Convert image to 8-bit
grayscale and Extract single color plane will have
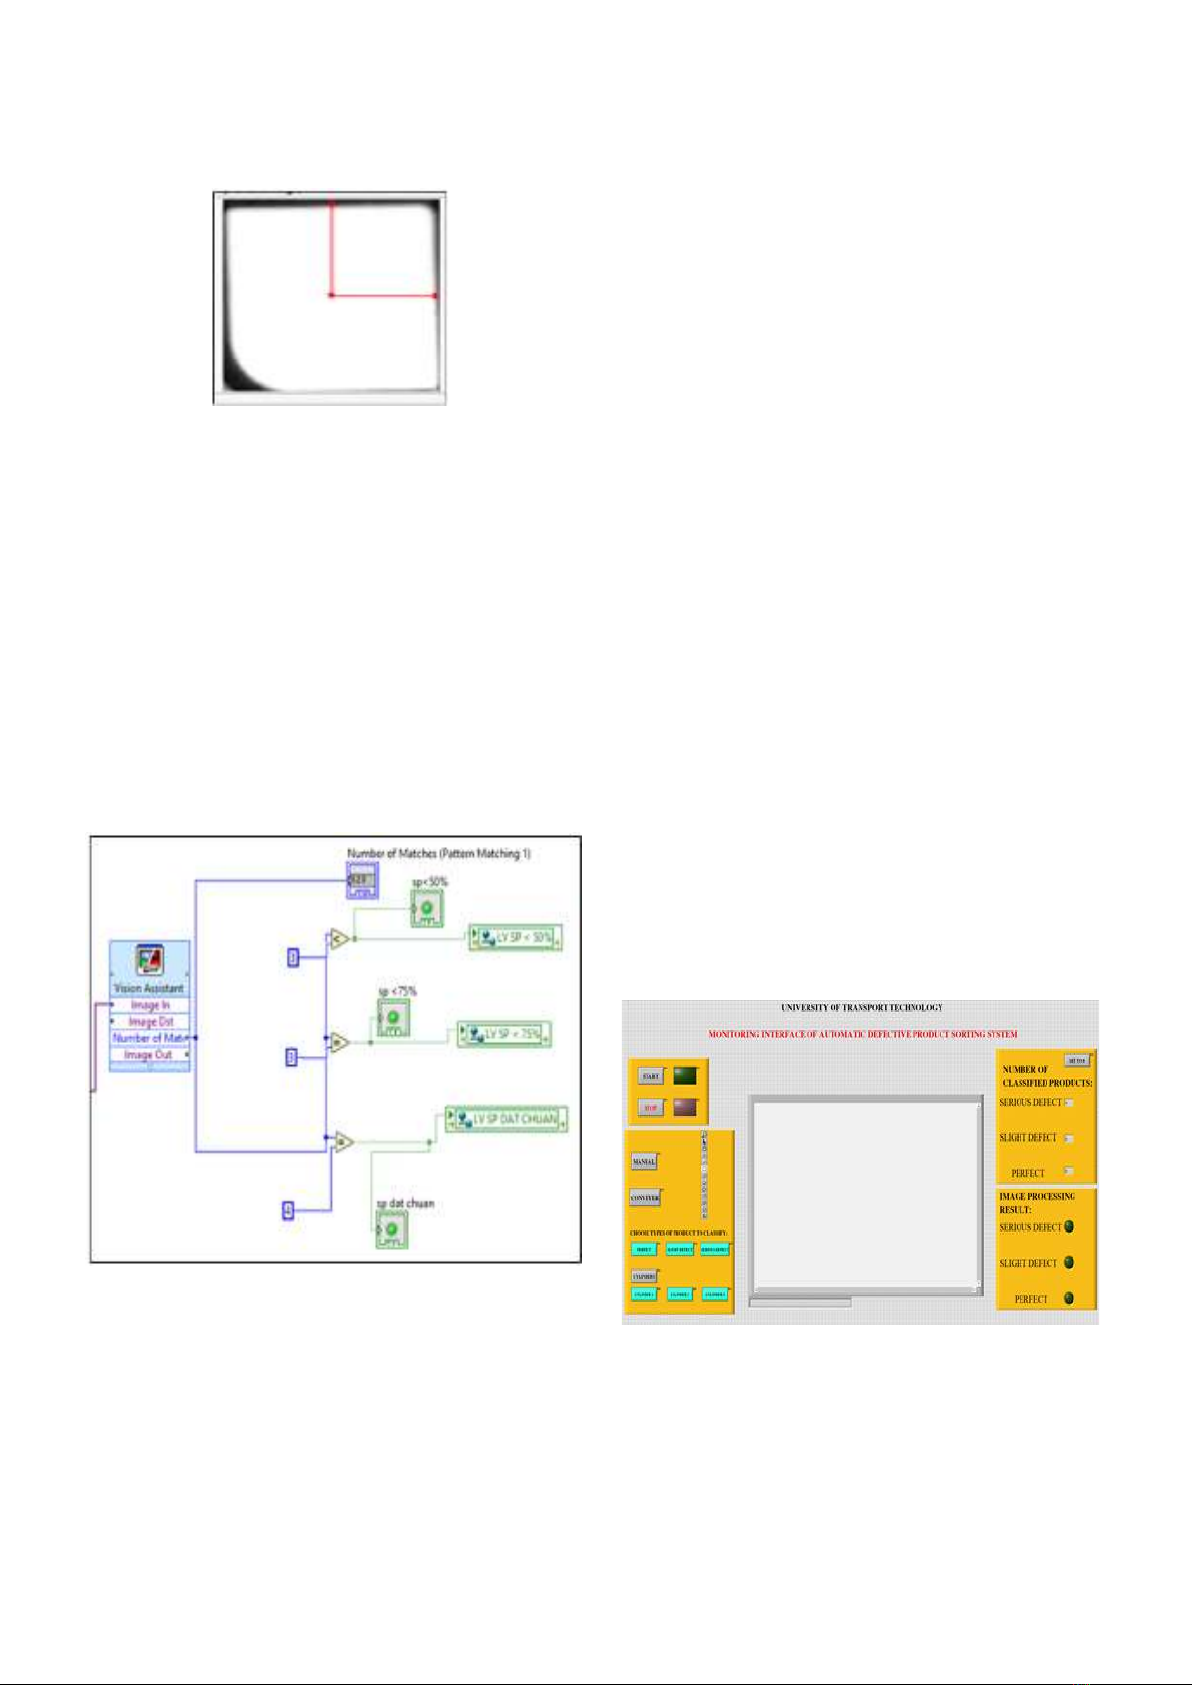
JSTT 2022, 2 (4), 20-25
Duong et al
23
the color as shown Figure 7).
Figure 8. Template
Pattern Matching scans images of objects
passing through the camera's scanning area, finds
objects that have two elements: shaped like a
cube's panel and red color. After finding the panels
matching templates, Vision Assistant will output the
number of matches. This number can have value
from 0 to 4 (one face of cube has a maximum of 4
panels).
(4) Compare the number of red panels
detected and output data: comparison blocks
was chosen in LabVIEW to compare number of
matches with 3 and 4.
Figure 9. Compare block in LabVIEW
- If the number of matches is equal to 4, it
means that the cube in the camera's scanning area
is a perfect product with 4 red panels.
- If the number of matches is equal to 3, it
means that the cube is a product has a slight defect
with 3 red panels (more than 70% resemble perfect
product).
- If the number of matches less than 3, the
cube is a product has serious defect with 1 or 2 red
panels (less than 70% resemble perfect product)
After performing the comparison, the
comparison blocks set the boolean data to ON,
there will be 3 boolean data corresponding to 3
types of products. They are sent to the PLC via the
OPC server as data for the product classification
process.
4.2. OPC server configuration
KEPserverEX6 software is used to configure
OPC Server so that NI LabVIEW and TIA Portal
can communicate with each other via boolean
data, these data are used during programming of
TIA Portal and NI LabVIEW.
4.3. Monitoring interface on NI LabVIEW
The Front panel of NI LabVIEW is used to
display the monitoring interface.
At the monitoring interface, the operator can
observe the image directly from the camera at the
center of the screen. On the left panel is a control
panel consisting of virtual buttons to control the
system manually. On the right panel, the upper part
is the result table of the sorted products, the lower
part is the product classification result at the time
where the cube is in the camera's scanning area.
Figure 10. Monitoring interface in the Front panel
of NI LabVIEW
5. Test results
As mentioned above, to test the accuracy of
the sorting system, three types of products
(perfect, slight perfect and serious perfect) were
JSTT 2022, 2 (4), 20-25
Duong et al
24
used as shown in Figure 1.
The total number of testing process was 100
for each type of product with different angles
placed on conveyor belt.
Table 3. Result of image processing
Perfect
Slight
defect
Serious
defect
Accuracy
[percentage]
4 red
panels
98
2
0
96
3 red
panels
2
96
2
96
2 red
panels
0
3
97
97
During the testing process some abnormal
condition may happen such as no air pressure by
compressor or no power supply. In case of no air
pressure, the pneumatic cylinders would not work.
In both cases, the classification system should be
reset by pressing Start and Stop button
simultaneously in at least 3 seconds.
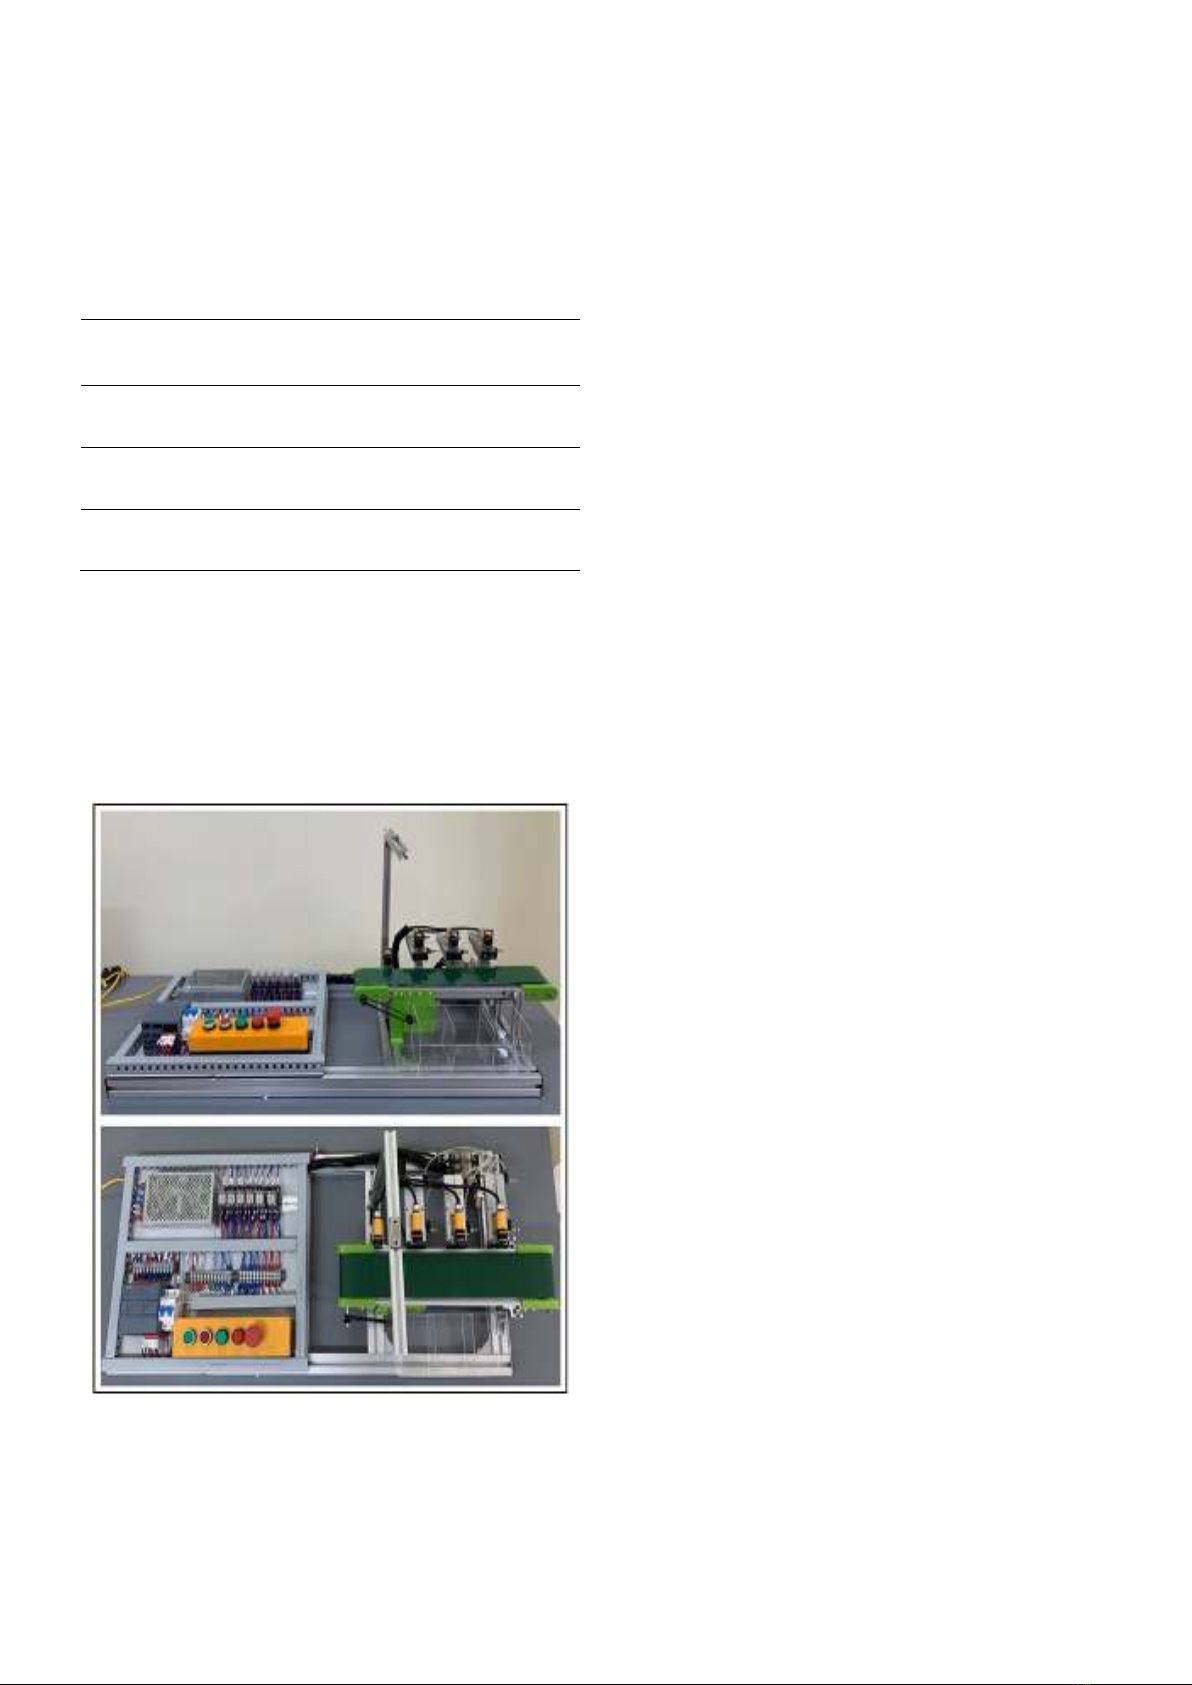
Figure 2. Model of defective product sorting
system
The product classification results achieve
relatively high accuracy. It is stated that the results
were not affected by the placement angle products
on conveyor belt but by the following factors:
conveyor speed (high conveyor speed will cause
the camera not able to capture images with high
resolution), lighting conditions (affects color
detection).
In addition, the designed model encounters
some limits such as images processed only from
one surface of the product, image processing
cannot distinguish product with the surface too
small because of low camera’s resolution.
6. Conclusions
This research has developed a model of
sorting system using image processing method.
The model can detect an object that resembles a
pre-configured pattern based on shape and colour.
The obtained results of this research could
be to enhance the teaching and learning of
mechatronics system engineering at different
institutions, especially at the University of
Transport Technology.
Acknowledgement
This paper was funded by the University of
Transport Technology (UTT) under the grant
number DTTD2021-07.
References
[1]. B.I. Oladapo, V.A. Balogun, A.O.M. Adeoye,
C.O. Ijagbemi, A.S. Oluwole, I.A. Daniyan, A.E.
Aghor, A.P. Simeon. (2016). Model design and
simulation of automatic sorting machine using
proximity sensor. Engineering Science and
Technology, an Internationl Journal, 19(3),
1452-1456.
[2]. S. Sheth, R. Kher, R. Shah, P. Dudhat, P. Jani.
(2010). Automatic Sorting System Using
Machine Vision. Multi Disciplinary International
Symposium on Control, Automation and
Robotics.
[3]. Z. Guo, M. Zhang, D.J. Lee, T. Simons. (2020).
Smart Camera for Quality Inspection and
Grading of Food Products, Electronics, 9 (505).
[4]. A.I. Soldatov, A.A. Soldatov, P.V. Sorokin, E.L.