
TNU Journal of Science and Technology
229(06): 340 - 347
http://jst.tnu.edu.vn 340 Email: jst@tnu.edu.vn
PHOTOCATALYTIC PROPERTIES OF ZnO/CuO/Ag TERNARY COMPOSITES
Do Duc Tho*, Hoang Xuan Truong, Luong Huu Phuoc
Hanoi University of Science and Technology
ARTICLE INFO
ABSTRACT
Received:
22/4/2024
In this paper, ZnO/CuO/Ag ternary composites were successfully
synthesized by hydrothermal method using Zn(NO3)2.6H2O,
Cu(NO3)2.3H2O and AgNO3. The composite samples were characterized
using X-Ray diffraction (XRD), Scanning Electron Microscopy (SEM)
and Raman spectroscopy. Their photocatalytic activities were examined
using Congo Red (CR) degradation under Xenon lamp 55 W
illumination. The organic dyes degradation was determined by
decreasing of characteristic intensity peak in UV-Vis spectrum versus
time of their solutions. In comparison with CR, the degradation of other
organic dyes such as Methylene Blue (MB), Rhodamine B (RhB) and
Crystal Violet (CV) was examined. The result showed that the
ZnO/CuO/Ag composite (nCu2+/nZn2+ = 0.10) exhibited higher
photocatalytic activity. The degradation reaches 84.8% when the CR
solution with concentration of 10 ppm and 40 mg of this composite was
tested. The enhanced photocatalytic activity in mainly attributed to the
construction of chemical potential gradients between proper amount of
CuO and ZnO adding the intermediary role of Ag.
Revised:
31/5/2024
Published:
31/5/2024
KEYWORDS
ZnO/CuO/Ag ternary composite
Photocatalytic activity
Congo Red degradation
The intermediary role of Ag
Hydrothermal method
TÍNH CHẤT QUANG XÚC TÁC CỦA TỔ HỢP BA THÀNH PHẦN ZnO/CuO/Ag
Đỗ Đức Thọ*, Hoàng Xuân Trường, Lương Hữu Phước
Đại học Bách khoa Hà Nội
THÔNG TIN BÀI BÁO
TÓM TẮT
Ngày nhận bài:
22/4/2024
Trong bài báo này, tổ hợp ba thành phần ZnO/CuO/Ag được chế tạo
thành công bằng phương pháp thủy nhiệt từ các muối Zn(NO3)2.6H2O,
Cu(NO3)2.3H2O và AgNO3. Cấu trúc tinh thể, hình thái và tính chất
quang của các mẫu vật liệu được xác định qua các phép đo như nhiễu
xạ tia X, hiển vi điện tử quét và phổ Raman. Tính chất quang xúc tác
của chúng được xác định qua khả năng phân hủy Congo Red (CR) khi
được chiếu sáng bởi đèn Xenon có công suất 55 W. Sự phân hủy các
chất màu được xác định qua sự giảm cường độ đỉnh đặc trưng trong phổ
UV-Vis của các dung dịch chất màu. Để so sánh với CR, các chất màu
khác nhau như Methylene Blue (MB), Rhodamine B (RhB) và Crystal
Violet (CV) cũng được khảo sát. Kết quả chỉ ra rằng tổ hợp ba thành
phần ZnO/CuO/Ag (nCu2+/nZn2+ = 0,10) thể hiện khả năng quang xúc tác
cao nhất. Khả năng phân hủy CR trong dung dịch của mẫu này lên tới
84,8% khi sử dụng 40 mg vật liệu với dung dịch Congo Red 10 ppm.
Sự cải thiện khả năng quang xúc tác được cho là do hình thành gradien
thế hóa ở tổ hợp với lượng CuO và ZnO thích hợp cộng với vai trò
trung gian của Ag.
Ngày hoàn thiện:
31/5/2024
Ngày đăng:
31/5/2024
TỪ KHÓA
Tổ hợp ZnO/CuO/Ag
Khả năng quang xúc tác
Phân hủy Congo Red
Vai trò trung gian của Ag
Phương pháp thủy nhiệt
DOI: https://doi.org/10.34238/tnu-jst.10189
* Corresponding author. Email: tho.dhbk.teach.2019@gmail.com

TNU Journal of Science and Technology
229(06): 340 - 347
http://jst.tnu.edu.vn 341 Email: jst@tnu.edu.vn
1. Introduction
Zinc oxide (ZnO) has attracted much attention because of its utilities as photocatalyst due to
its excellent optical activity, wideband gap of 3.37 eV, large exciton binding energy (60 meV),
natural abundance, low cost and environmental friendliness [1] – [3]. However, pure ZnO
nanostructures has large band gap energy and high recombination rate of photogenerated
electron-hole pairs [4], [5], resulting in exhibiting low application rate for visible light and
photocatalytic efficiency, which powerfully affect its practical application. Hence, great efforts
were usually used to enhance the photocatalytic activity of ZnO nanostructure, such as
decorating, doping, semiconductor compounding, and catalyzer carrier [6], [7].
Among of above mentioned methods, it is very effective for enhancing the photocatalytic
activity of ZnO nanostructures to form composite with other semiconductor oxide to improve the
sunlight utilization and decrease the recombination of photogenerated electron-hole pairs,
resulting in improving the photocatalytic activity of ZnO nanostructures. In great oxide
semiconductors, CuO, a p-type semiconductor, could compose ZnO to overcome the limitations
due to its narrow band gap energy of 1.20-1.75 eV, good electrical conductivity, non-toxicity,
high stability and natural abundance [8]. Different approaches have been selected to prepare
ZnO/CuO nanocomposites, such solid-state method [9] thermal oxidation and laser ablation [10]
and wet chemical process [11]. Moreover, it has been seen that the noble metal introduction like
silver (Ag) on ZnO could widen the absorption spectrum and promote the separation efficiency of
electron-hole pairs after excitation [12].
In the article, ZnO/CuO/Ag composites were successfully synthesized by hydrothermal method
using Zn(NO3)2.6H2O, Cu(NO3)2.3H2O and AgNO3. This method has several advantages such as
facile method, low cost, accurate control of stoichiometry, easy realization, fast reaction rate, the
quality and purity of the synthesized products, and the obtaining of materials with great variety of
crystalline structure [13]. In addition, the hydrothermal method can also be used to receive products
in large quantities. Hence, this method was selected to synthesize ZnO/CuO/Ag composites in our
group. Their photocatalytic activities were examined using Congo Red (CR) degradation. This
article focused on Congo Red dye due to limitation of research reports. The influence of Ag
presence on the photocatalytic activity of ZnO/CuO composites was also discussed.
2. Experiment
All the chemicals were of analytical grade without any further purification and processing. To
synthesis the ZnO/CuO composites, an amount of Zn(NO3)2.6H2O and a proper amount of
Cu(NO3)2.3H2O were respectively dissolved in 100 ml of double-distilled (DI) water under
magnetic stirring for 5 min. Next, 0.5 g CTAB (Cetyltrimethylammonium bromid) was added to
the mixed solution. When the CTAB was completely dissolved then 2.5 g NaOH was added.
After stirring with a magnetic stir for 1 h, the mixed solution was then transferred into a teflon-
lined stainless autoclave and heated at 140 oC for 3 h. Next, the obtained precipitation was
carefully washed and filtered by DI water and absolute ethanol. Lastly, the precipitation was
dried at 80 oC for 24 h to obtain ZnO/CuO composites.
For synthesis ZnO/CuO/Ag ternary composites, 0.5 g AgNO3 and 0.1 g PVP
(Polyvinylpyrrolidone) were dissolved in 30 ml EG (Ethylene Glycol) to form the AgNO3
solution. A proper amount of synthesized above ZnO/CuO was dispersed in 30 ml DI water and
magnetically stirred about 30 min. Afterwards, the mix was added the AgNO3 solution under
magnetic stirring of 30 min. Next, the mix was transferred into a teflon-lined stainless autoclave
and heated at 140 oC for 2 h. Finally, the precipitation was selected and dried at 80 oC for 24 h.
The prepared ZnO/CuO/Ag composite samples are presented in Table 1.
TNU Journal of Science and Technology
229(06): 340 - 347
http://jst.tnu.edu.vn 342 Email: jst@tnu.edu.vn
Table 1. The prepared ZnO/CuO/Ag composites
Sample
Concentration ratio (nCu2+/nZn2+)
AgNO3 ( g)
M5
1%
0.5
M7
3%
0.5
M10
5%
0.5
M15
7%
0.5
The morphology of the samples was determined by scanning electron microscopy (SEM,
Tabletop Microscope TM4000 Plus, Hitachi). Their structures were examined by a powder X-ray
diffractometer (XRD) with CuK radiation (X’pert Pro, PANalytical). The Raman spectra of the
samples were recorded with a Raman microscope (Renishaw Invia Raman Microscope). Their
UV-Vis spectra were recorded by a UV-Vis spectrometer (Jasco V-750). All measurements were
performed at room temperature.
The highest degradation efficiency was calculated as in following equation (1):
00
00
100% 100%
tt
C C I I
HCI
1
Where C0, Ct are the initial concentration and concentration after photodegradation,
respectively. I0 and It are the initial absorption intensity and the absorption intensity after
photodegradation of dye solution and H is the degradation efficiency of dye.
3. Results and discussion
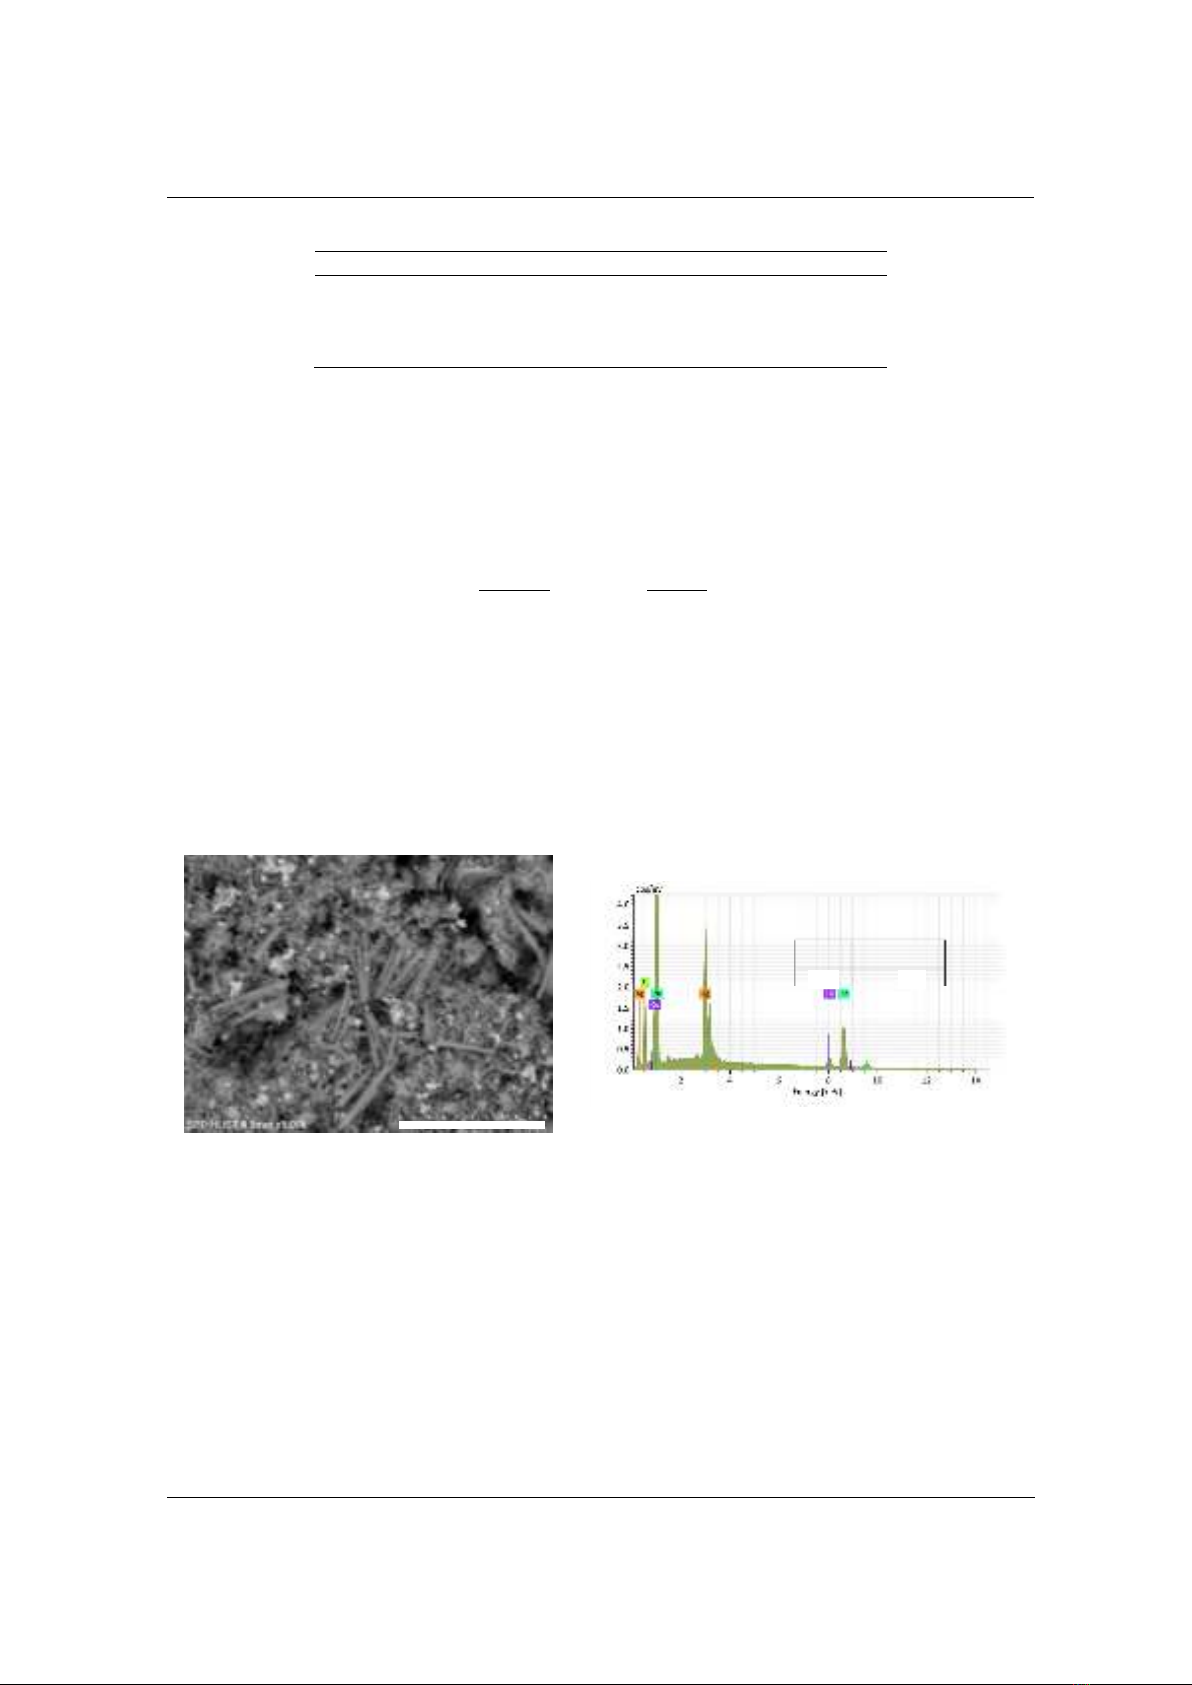
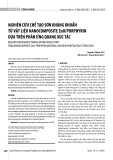
SEM image of the M10 sample was depicted in Figure 1. We can observe different particles
mixed with rods. The formed rods with average length of several µm and diameter of about µm
mixed with average diameter of hundreds nm particles. In addition, we can observe some picture
places brighter than others. These places can be contributed to presences of Ag particles.
Figure 1. SEM images of the samples
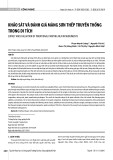
Figure 2. EDX spectrum of the samples
EDX spectrum of this sample (Figure 2) depicts that all elements Zn, Cu, O and Ag were
presented. Moreover, the composition obtained from the EDX spectrum, which is depicted in the
inset, is roughly consistent with the desired weight ratio CuO and ZnO.
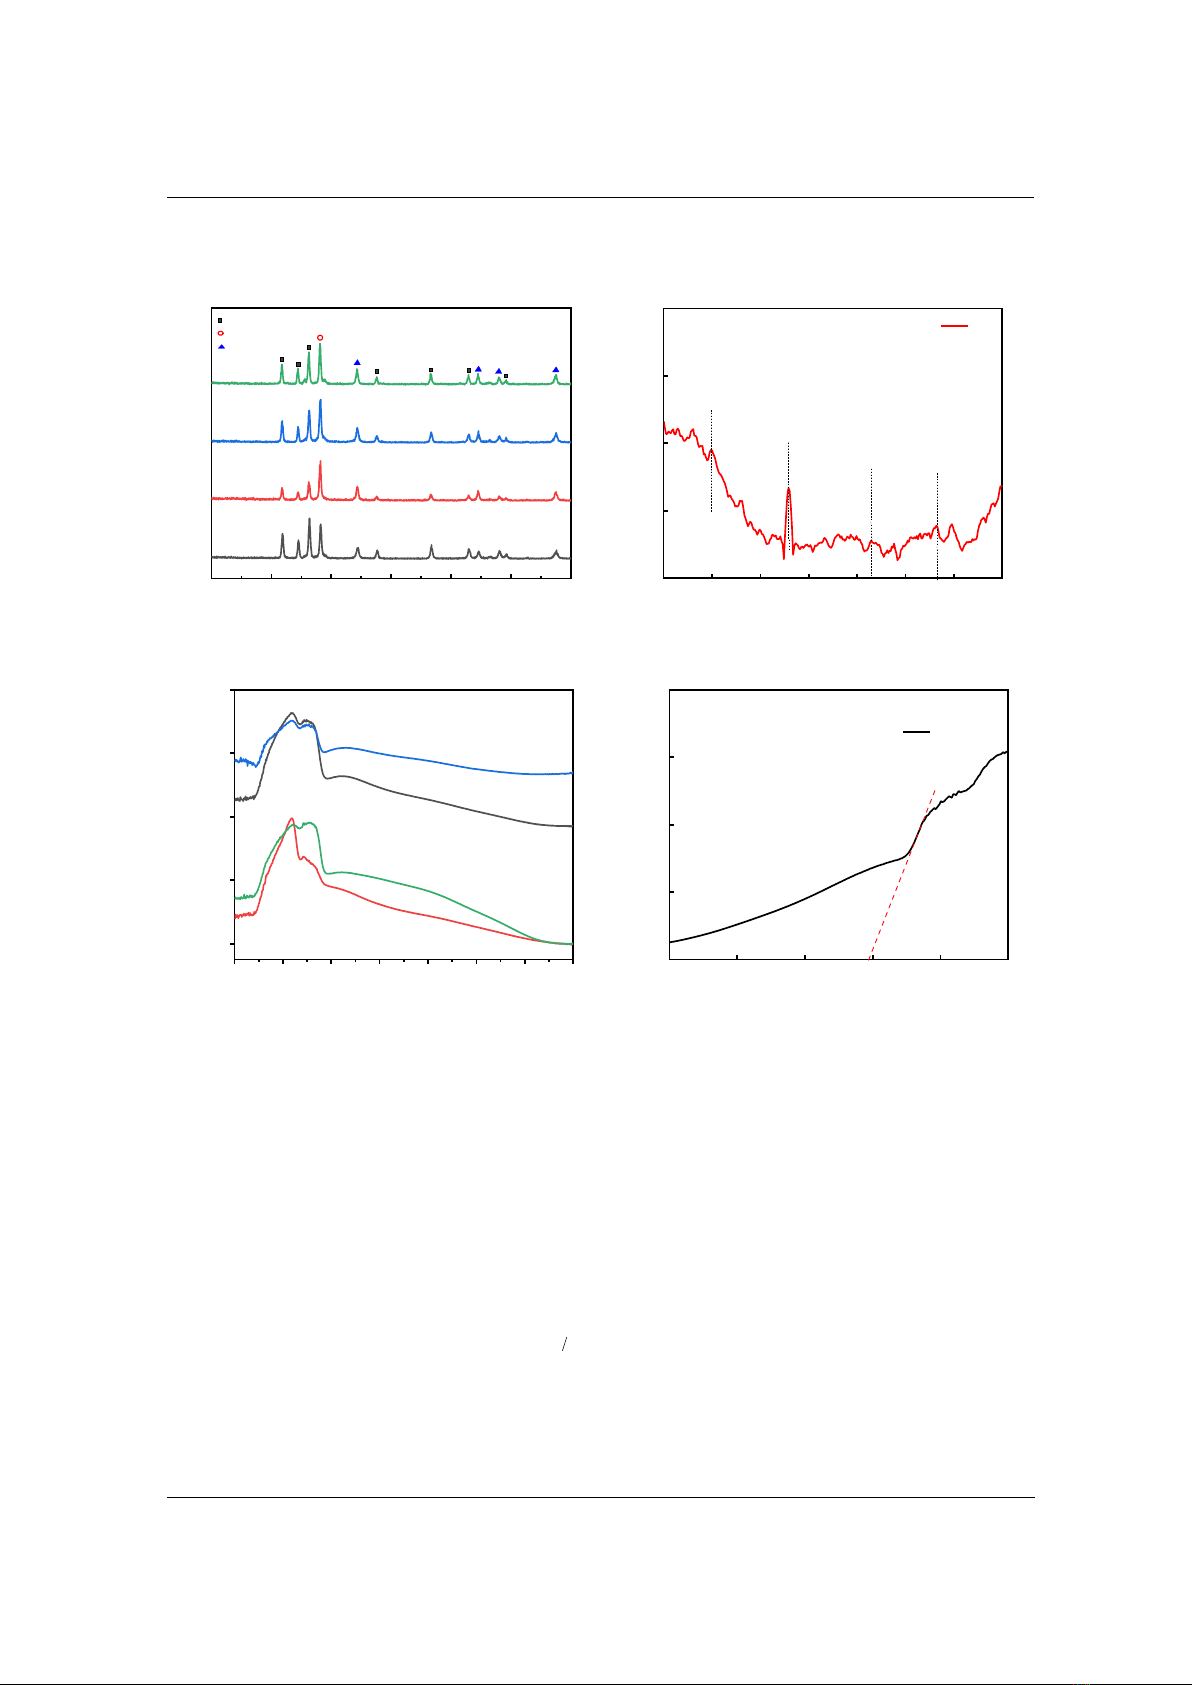
Figure 3 depicts the XRD pattern of the samples. The results depict that all intensive
diffraction peaks in the patterns are indexed to hexagonal structure of ZnO with lattice constant
of a = b = 0.3249 nm and c = 0.5206 nm (JCPDS 36-1451). The diffraction peak at 38.1o can be
indexed to the monoclinic of CuO (JCPDS 45-0937). Other peaks can be indexed to face-
centered cubic Ag (JCPDS 04-0783).
The Raman spectrum of the M10 sample (Figure 4) shows the peaks at 430 and 582 cm-1 for
hexagonal wurtzite structure of ZnO. The peak at 582 cm-1, situated between A1 (LO) and E1
(LO) optical phonon mode, assigned to the oxygen imperfection. The peak at 382 cm-1 is
assigned to A1 transverse mode and existed from the anisotropic nature in the force constant. The
Sample
[Cu2+]/[Zn2+]
M10
0.13
10 m
(M10)
TNU Journal of Science and Technology
229(06): 340 - 347
http://jst.tnu.edu.vn 343 Email: jst@tnu.edu.vn
peak at 348 cm-1 for monoclinic CuO. Among these, the peak at 348 cm-1 was assigned to Ag
mode and the remaining were to Bg mode. The peak 515 cm-1, possibly related to an overlap of
2(LA) and 2B1low overtones [14] – [20].
20 30 40 50 60 70 80
Intensity (a. u.)
2θ (ᵒ)
(100)
(002)
(101)
(111)
(200)
(102)
(110)
(103)
(220)
(113)
(103)
(311)
M5
M7
M10
M15
ZnO
CuO
Ag
300 350 400 450 500 550 600 650
0
500
1000
1500
2000
Intensity (a. u.)
Raman shift (cm-1)
M10
348
430
515 582
Figure 3. XRD patterns of the samples
Figure 4. Raman spectra of the M10 sample
200 300 400 500 600 700 800 900
0.0
0.4
0.8
1.2
1.6
Absorbance (a.u.)
Wavelength (nm)
M10
M5
M7
M15
1.5 2.0 2.5 3.0 3.5 4.0
0
10
20
30
40
hν2 (104cm-1eV)2
M10
Eg = 2.96 eV
hν (eV)
Figure 5. Absorption spectra of the samples
Figure 6. Method of band gap energy Eg
determination from the Tauc plot. The linear part of
the plot is extrapolated to the x-axis
Figure 5 depicts UV-Vis absorption spectra of the composite samples. We can observe that
the edge absorption is nearly 400 nm, which is in accordance with the values in the literature. The
reported values for the absorption edge of ZnO are in the range of 380-400 nm [21], [22]. The
absorption of the samples decreased lightly with increasing light wavelength. However, it can be
seen that the M10 sample depicts the best absorption in the visible light region. Hence, its light
conversion increases, resulting in growth of photocatalytic activity.
The optical band gap of the M10 sample, which was determined by modified Kubelka – Munk
function, is depicted in Figure 6. The mathematical relation between the photon energy
hv
and
for allowed transition is following:
1
g
hv A hv E
2
Where is the energy-dependent absorption coefficient, h is the Planck constant, is the
photon’s frequency, Eg is the optical band gap energy, A is a constant, γ factor depends on the
nature of the electron transition and is equal to 1/2 or 2 for the direct and indirect transition band
TNU Journal of Science and Technology
229(06): 340 - 347
http://jst.tnu.edu.vn 344 Email: jst@tnu.edu.vn
gaps, respectively. In this report, the γ factor was taken value 1/2 resulting the optical band gap of
the M10 sample is 2.96 eV.
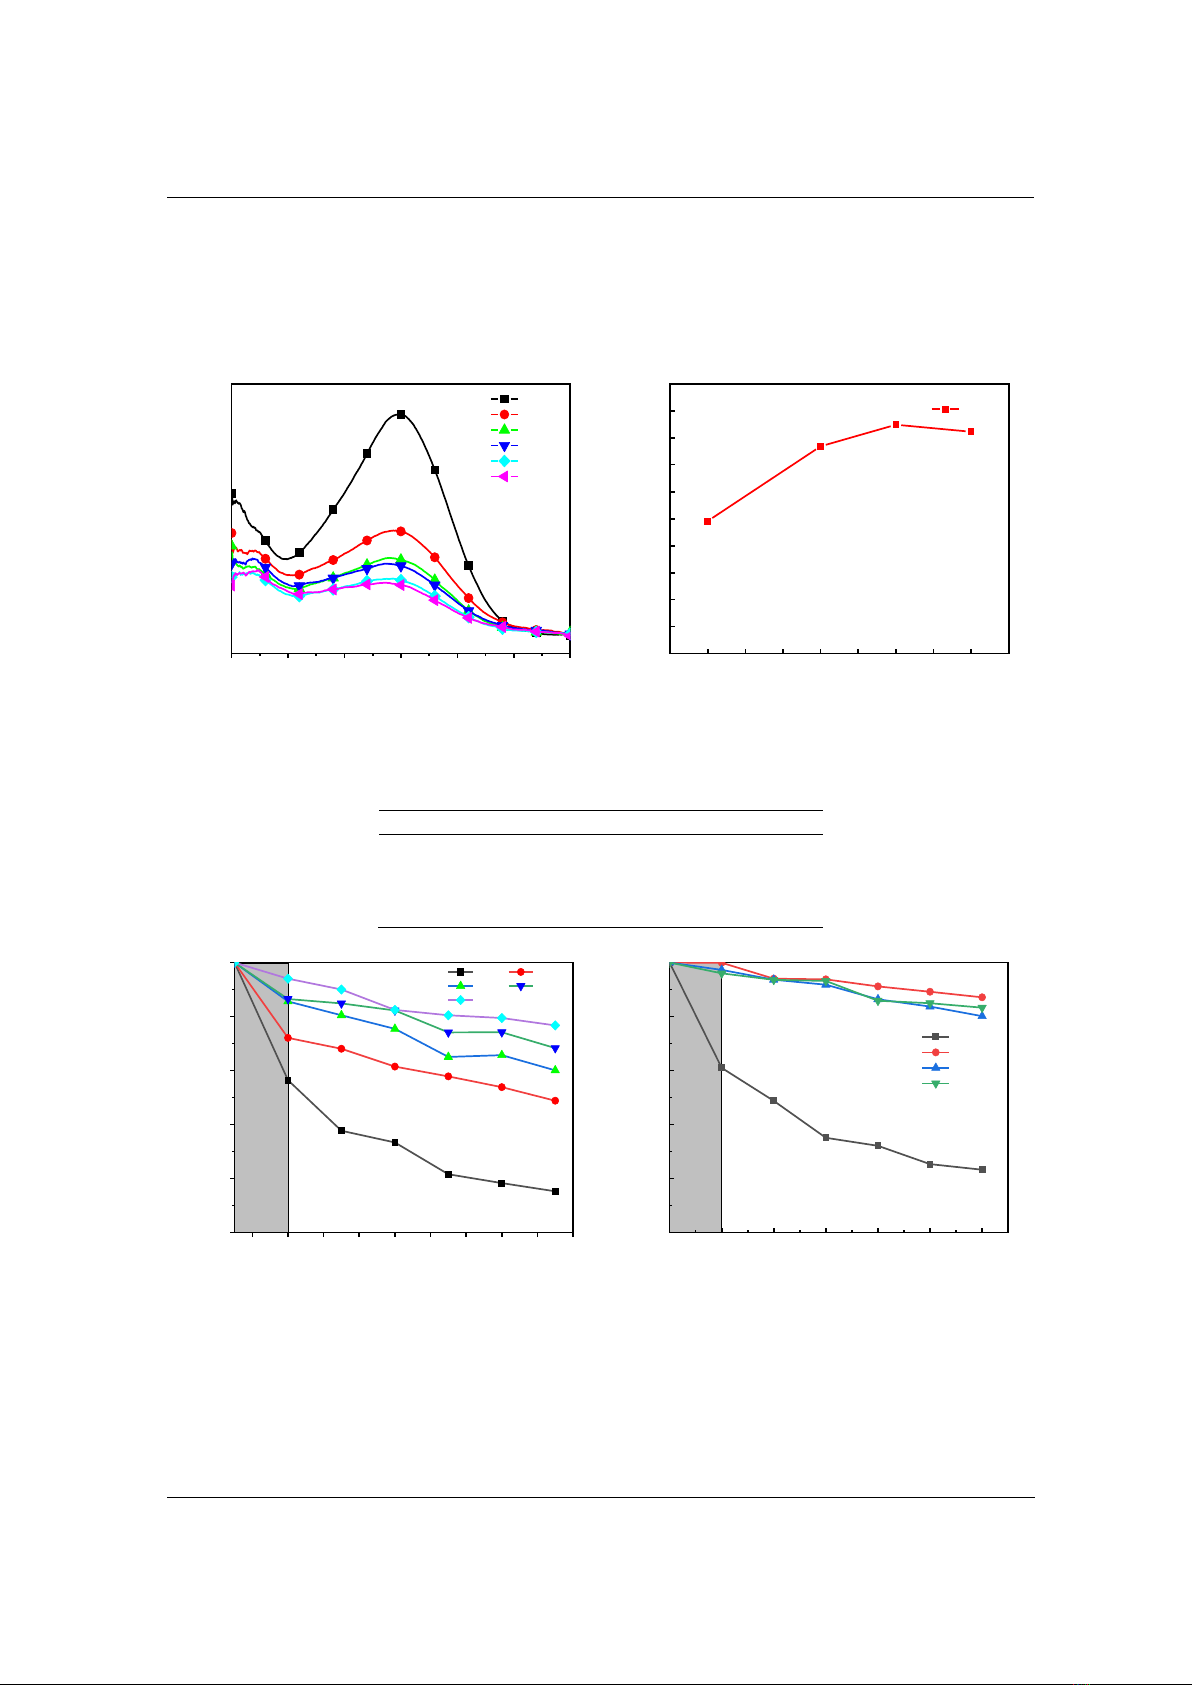
The photocatalytic performance of the samples with the weight of 30 mg under Xenon lamp
illumination was evaluated using CR solution with a concentration of 10 ppm as the organic
pollutant was depicted in Figure 7. After 150 min, the M10 sample depicts the highest degradation
efficiency (76.8 %) (Table 2). Hence, the M10 sample was chosen to other experiments.
350 400 450 500 550 600 650
0.00
0.05
0.10
0.15
0.20
0.25
0.30
Absorption (a. u.)
Wavelength (nm)
0 min.
30 min.
60 min.
90 min.
120 min.
150 min.
10 15 20 25 30 35 40 45 50 55
0
10
20
30
40
50
60
70
80
90
100
H (%)
Weight (mg)
M10
Figure 7. The CR degradation of the samples
Figure 8. The influence of weight on the M10 sample
degradation efficiency
Table 2. Degradation efficiency of the samples with weight of 30 mg and the CR solution of 10 ppm
Sample
H (%)
M5
56.8
M7
32.4
M10
76.8
M15
54.2
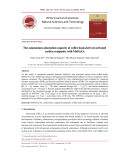
-20 0 20 40 60 80 100 120 140 160
0.0
0.2
0.4
0.6
0.8
1.0
H (%)
Time (min.)
10 ppm 20 ppm
30 ppm 40 ppm
50 ppm
Dark Light
-30 0 30 60 90 120 150
0.0
0.2
0.4
0.6
0.8
1.0
Ct/CO
Time (min.)
CR
CV
RhB
MB
Dark Light
Figure 9. The M10 sample degradation efficiency
on concentration
Figure 10. The degradation of M10 sample versus
differential dyes
Figure 8 depicts the M10 sample degradation efficiency of its weight. The degradation of the
M10 sample reaches the largest value when it weight is 40 mg. It was unchanged with increase of
weight of the M10 sample. Therefore, the weight of 40 mg was used for the next experiments. In
sequence, the M10 sample degradation dependency of concentration was examined. The CR
(M10)


![Đề thi Con người và môi trường cuối kì 2 năm 2019-2020 có đáp án [kèm file tải]](https://cdn.tailieu.vn/images/document/thumbnail/2025/20250523/oursky06/135x160/4691768897904.jpg)


![Đề cương ôn tập Giáo dục môi trường cho học sinh tiểu học [mới nhất]](https://cdn.tailieu.vn/images/document/thumbnail/2025/20251212/tambang1205/135x160/621768815662.jpg)


