HPU2. Nat. Sci. Tech. Vol 02, issue 02 (2023), 22-32
HPU2 Journal of Sciences:
Natural Sciences and Technology
journal homepage: https://sj.hpu2.edu.vn
Article type: Research article
Received date: 05-7-2023 ; Revised date: 16-8-2023 ; Accepted date: 18-8-2023
This is licensed under the CC BY-NC-ND 4.0
The photothermal effect of gold nanoparticles prepared by
electrochemical method at different voltages
Xuan-Quang Nguyen
a,b
, Van-Quang Nguyen
c
, Thu-Thuy Nguyen Thi
a
,
Dinh-Lam Vu
b
, Quang-Huy Tran
a,*
a
Phenikaa University Nano Institute (PHENA), Phenikaa University, Hanoi 12116, Vietnam
b
Graduate University of Science and Technology (GUST), Vietnam Academy of Science and Technology (VAST),
18 Hoang Quoc Viet, Hanoi 10000, Vietnam
c
Department of Chemistry, Hanoi Pedagogical University 2, Phuc Yen, Vinh Phuc
Abstract
This paper was performed to evaluate the photothermal effect of pure gold nanoparticles (Au NPs)
prepared by electrochemical method at different voltages, under laser irradiation in the safe wavelength
range. The formation, morphological, and structural properties of Au NPs were analyzed by UV-Vis
absorption spectroscopy, transmission electron microscopy (TEM), and X-ray diffraction (XRD). The
stability and dispersion of Au NPs were investigated by dynamic light scattering (DLS) and Zeta
potential measurements. The photothermal effect was evaluated by the temperature change of the
sample under the green laser irradiated at a wavelength of 532 nm. The results showed the formation of
the Au NPs has a spherical shape and high purity; the particle size distribution is in the range of 10 - 40
nm depending on the synthesis voltage, and the absorption peak is in the range of 530 to 556 nm. The
temperature of the Au NPs solution increased by 1.3 to 6
o
C, compared to that of bi-distilled water
under the same conditions of laser irradiation. This paper shows the photothermal effect of Au NPs
prepared by the electrochemical method at different voltages, it changed markedly when irradiated with
a green laser in the safe wavelength range.
Keywords: Au NPs, photothermal effect, electrochemical method
1. Introduction
* Corresponding author, E-mail: huy.tranquang@phenikaa-uni.edu.vn
https://doi.org/10.56764/hpu2.jos.2023.22.22-32

HPU2. Nat. Sci. Tech. 2023, 2(2), 22-32
https://sj.hpu2.edu.vn 23
Nowadays, nanomaterials technology is growing fast, especially precious metal nanomaterials
have attracted a great deal of attention from researchers. Their unique properties include flexibility,
confinement effect, quantum confinement effect, large surface area/mass ratio, and ability to deliver
drugs or inhibit pathogens [1][2]. Gold nanoparticles are a topic of great interest to many research
groups worldwide. Gold particles at the nanoscale, exhibit special properties compared to that of the
bulk including electrical conductivity, thermal conductivity, high reflectivity and good compatibility
[3]. Moreover, when illuminated, gold nanoparticles (Au NPs) have a surface plasmon resonance
effect, generating local heat to the surrounding environment (also known as the photothermal effect)
[4]. Gold nanoparticles have been widely studied and applied in biomedicine such as biosensors [3],
bioimaging [3][5], disease therapies and drug delivery [6][7][8], etc. The synthesis of gold
nanoparticles usually uses gold salt (HAuCl4 ) via the reduction method [9][10]. This method is simple
and can be produced in large scalability. However, the end product often still contains unwanted
residues from the reduction process. These residues may have a certain influence on the activity of Au
NPs. Recent articles also show that the evaluation of the photothermal effect of Au NPs mainly uses a
laser with a wavelength in near-infrared (NIR) wavelength of 808 nm [11][12][13][7]. Rarely, there
are few studies using lasers with wavelengths in the visible light region. This study was carried out to
investigate the photothermal effect of pure Au NPs prepared by the electrochemical method using a
green laser with a wavelength of 532 nm, which is close to the peak absorption spectrum of Au NPs.
The results of the study are expected to contribute to giving a realistic view of the photothermal effects
of Au NPs with high purity and different sizes through the fabrication by the electrochemical method
using DC voltage varying from 6-18 V. Accordingly, this study aims to promote pure Au NPs applied
in biomedicine.
2. Materials and Methods
2.1. Reagents
Gold foils (99.999%) with dimensions of 60 mm x 5 mm x 0.1 mm (length x width x height) were
purchased from a jewellery store in Hanoi, Vietnam. Trisodium citrate (Na6H5O7), and hydrogen
peroxide (H2O2) were purchased from Sigma-Aldrich. Other chemicals were of analytical grade.
2.2. Electrochemical synthesis of Au NPs
The surface of the gold bars was cleaned with a 3% hydrogen peroxide (H2O2) solution and rinsed
twice with bi-distilled water before use. Two gold bars were fixed (deeply submerged 5 cm) into a
sealed electrochemical cell containing 60 ml of bi-distilled water, and connected to a DC source range
6 to 18V. Then, 0.1% sodium citrate was added to the electrochemical cell and the synthesis process
was performed for 5 h under heated magnetic stirring conditions (80-100oC). Finally, the sample was
cooled down at room temperature to obtain the Au NPs solution.
2.3. Characterization of Au NPs
The formation and physicochemical properties of Au NPs were investigated by UV-Vis
absorption spectroscopy (SP - 3000 nano, Optima), TEM (JEM1010, JEOL), and XRD (EQUINOX
5000, Thermo Scientific). Nanoparticle size distribution, identification and stability were studied by
DLS, and Zeta potential (Zetasizer Nano ZS). The photothermal measurement was performed using an
excitation source of a 532 nm green laser with the power of 100 mW, and a thermal sensor that
recorded the temperature over time.
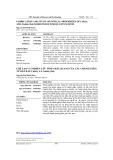
2.4. Investigation for the photothermal effect of Au NPs
A tube of 1 mL of prepared Au NPs solution was put into an ultrasonic vibration bath and
vibrated at room temperature for 5 min. Then, the Au NPs solution was put into a glass tube with a
HPU2. Nat. Sci. Tech. 2023, 2(2)
,
22-32
https://sj.hpu2.edu.vn 24
volume of 1.5 mL. The solution was illuminated by a 532 nm laser source for 15 min. The temperature
of the solution was recorded every 5 seconds during illumination (Figure 1).
Figure 1: Photothermal measurement system
3. Results and Discussion
Physicochemical properties of Au NPs
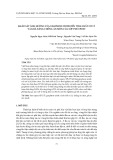
Figure 2: UV-Vis spectra of Au NPs (a) 6V; (b) 9V; (c) 12V; (d) 15V and (e) 18V
The Au NPs solution has been successfully prepared by electrochemical method from bulk gold.
In this report, Au NPs were synthesized with DC voltage varying from 6-18V. With a voltage of 6V,
the solution after the electrochemical process is transparent and the color does not change when
HPU2. Nat. Sci. Tech. 2023, 2(2)
,
22-32
https://sj.hpu2.edu.vn 25
compared to that before. Therefore, Au NPs may have not been formed or are formed with very low
concentrations at this voltage. For samples synthesized at 9 - 15V, the solution has a bright red color
which is the characteristic color of gold nanoparticle solution. This shows the formation of Au NPs in
the electrochemical solution[14]. With samples synthesized at 18 V, the color of the solution becomes
dark red. Some studies show that the color of the Au NPs solution changes according to the change in
the particle size of Au NPs [14][15].
For evidence, UV-Vis absorption was used to analyze the samples. Figure 2 shows the UV-Vis
absorption spectra of Au NPs solutions after the electrochemical process with different voltages.
Figure 2(a) is the absorption spectrum of the electrochemical sample at a voltage of 6V; as there is no
absorption peak, the particle formation has not been determined. This is completely consistent with the
results observed by the naked eye. Figures 2(b), 2(c), and 2(d) are the UV-Vis absorption spectra of
the electrochemical solution at the voltages of 9V, 12V, and 15V, respectively. From the UV-Vis
spectra, it was shown that all solutions had an absorption peak at 538 nm, which is believed to be the
plasmon absorption peak of Au NPs. Furthermore, the three samples have the same absorption peak,
and the widths of the absorption peaks are quite similar. This proves that the size range of gold
nanoparticles is slightly changed in the voltage range from 9-15V. Figure 2e is the UV-Vis absorption
spectrum of the electrochemical solution at 18V. From the absorption spectrum, the absorption peak at
556 nm can be seen. Compared with samples at lower voltages, the absorption peak shifts to longer
wavelengths, which means that the particle size has changed [15]. Specifically, the particle size of Au
NPs can be large with the samples synthesized at 18V. In addition, the spectral width extends towards
the longer wavelength compared to that of the samples synthesized at lower voltages, indicating that
the size range also widens when the sample is synthesized at the voltage. Therefore, the particle size of
Au NPs synthesized at this voltage may be less uniform than that in the voltage range of 9-15V. To
confirm the formation of Au NPs, samples were prepared for TEM observation.
TEM images can help clarify the morphology and size of the particles formed.
HPU2. Nat. Sci. Tech. 2023, 2(2)
,
22-32
https://sj.hpu2.edu.vn 26
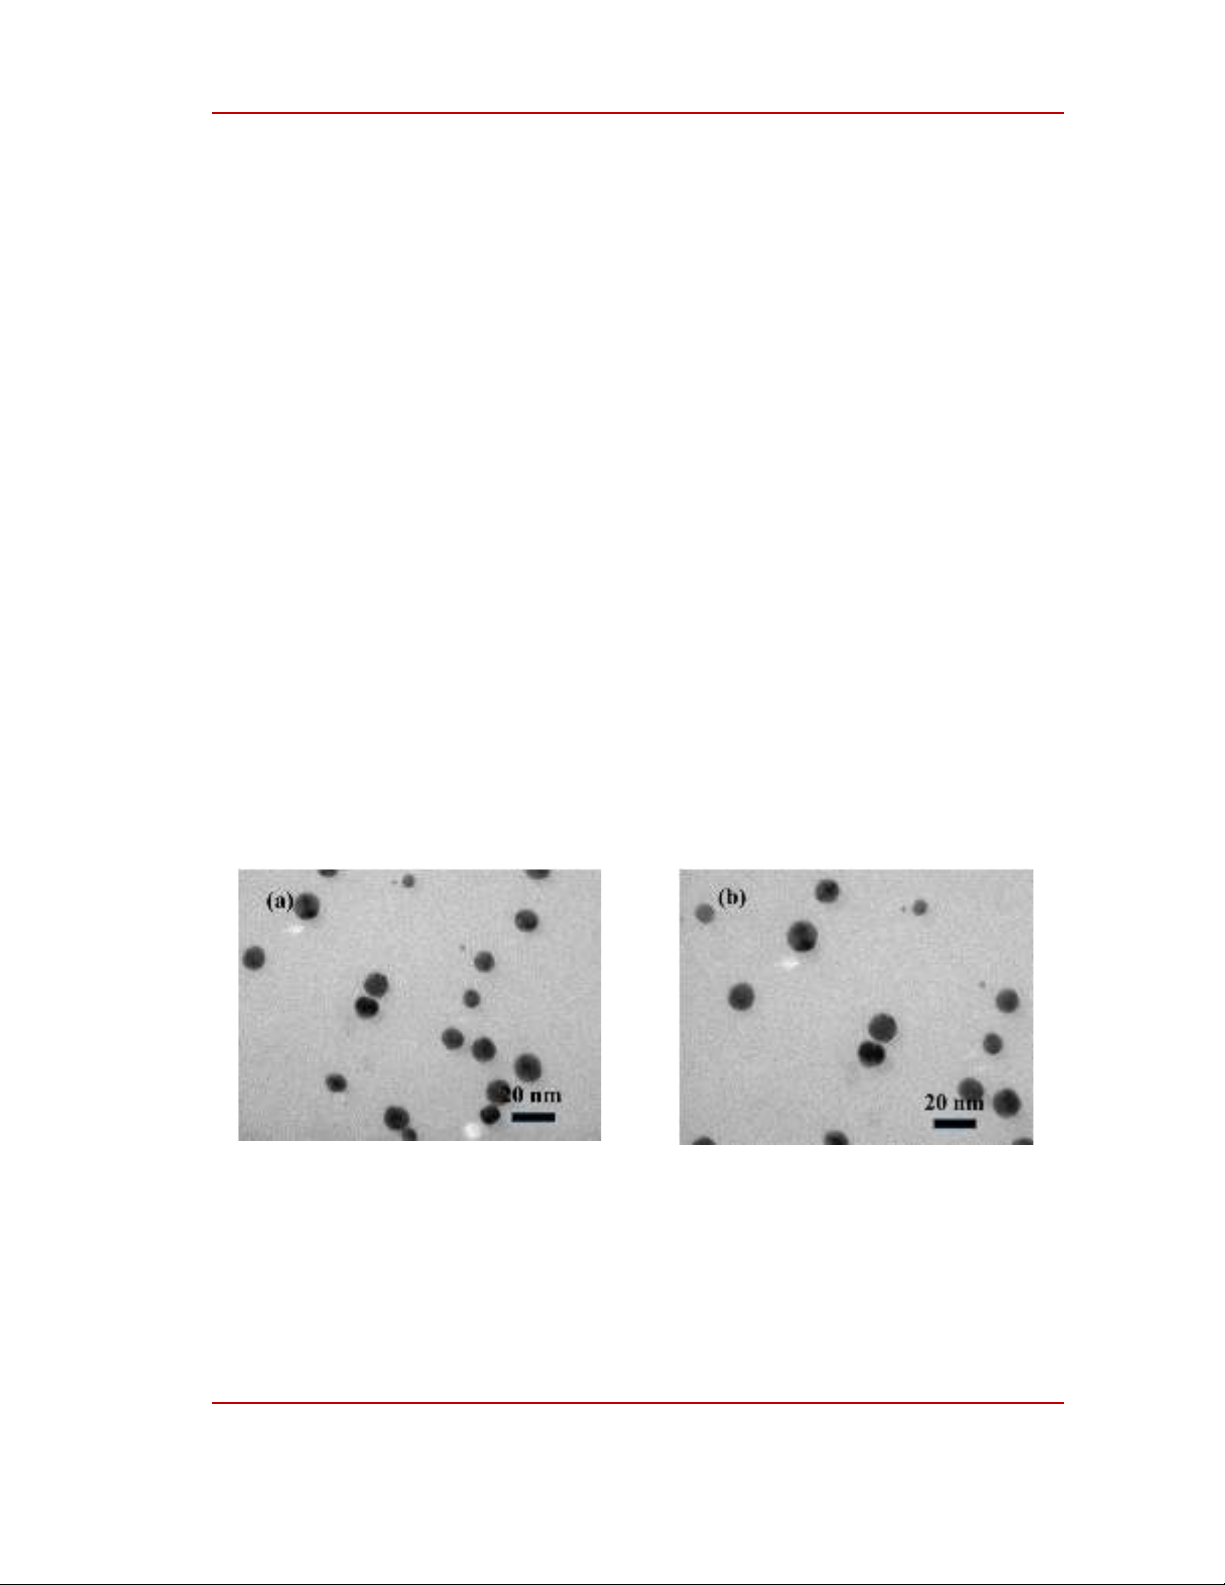
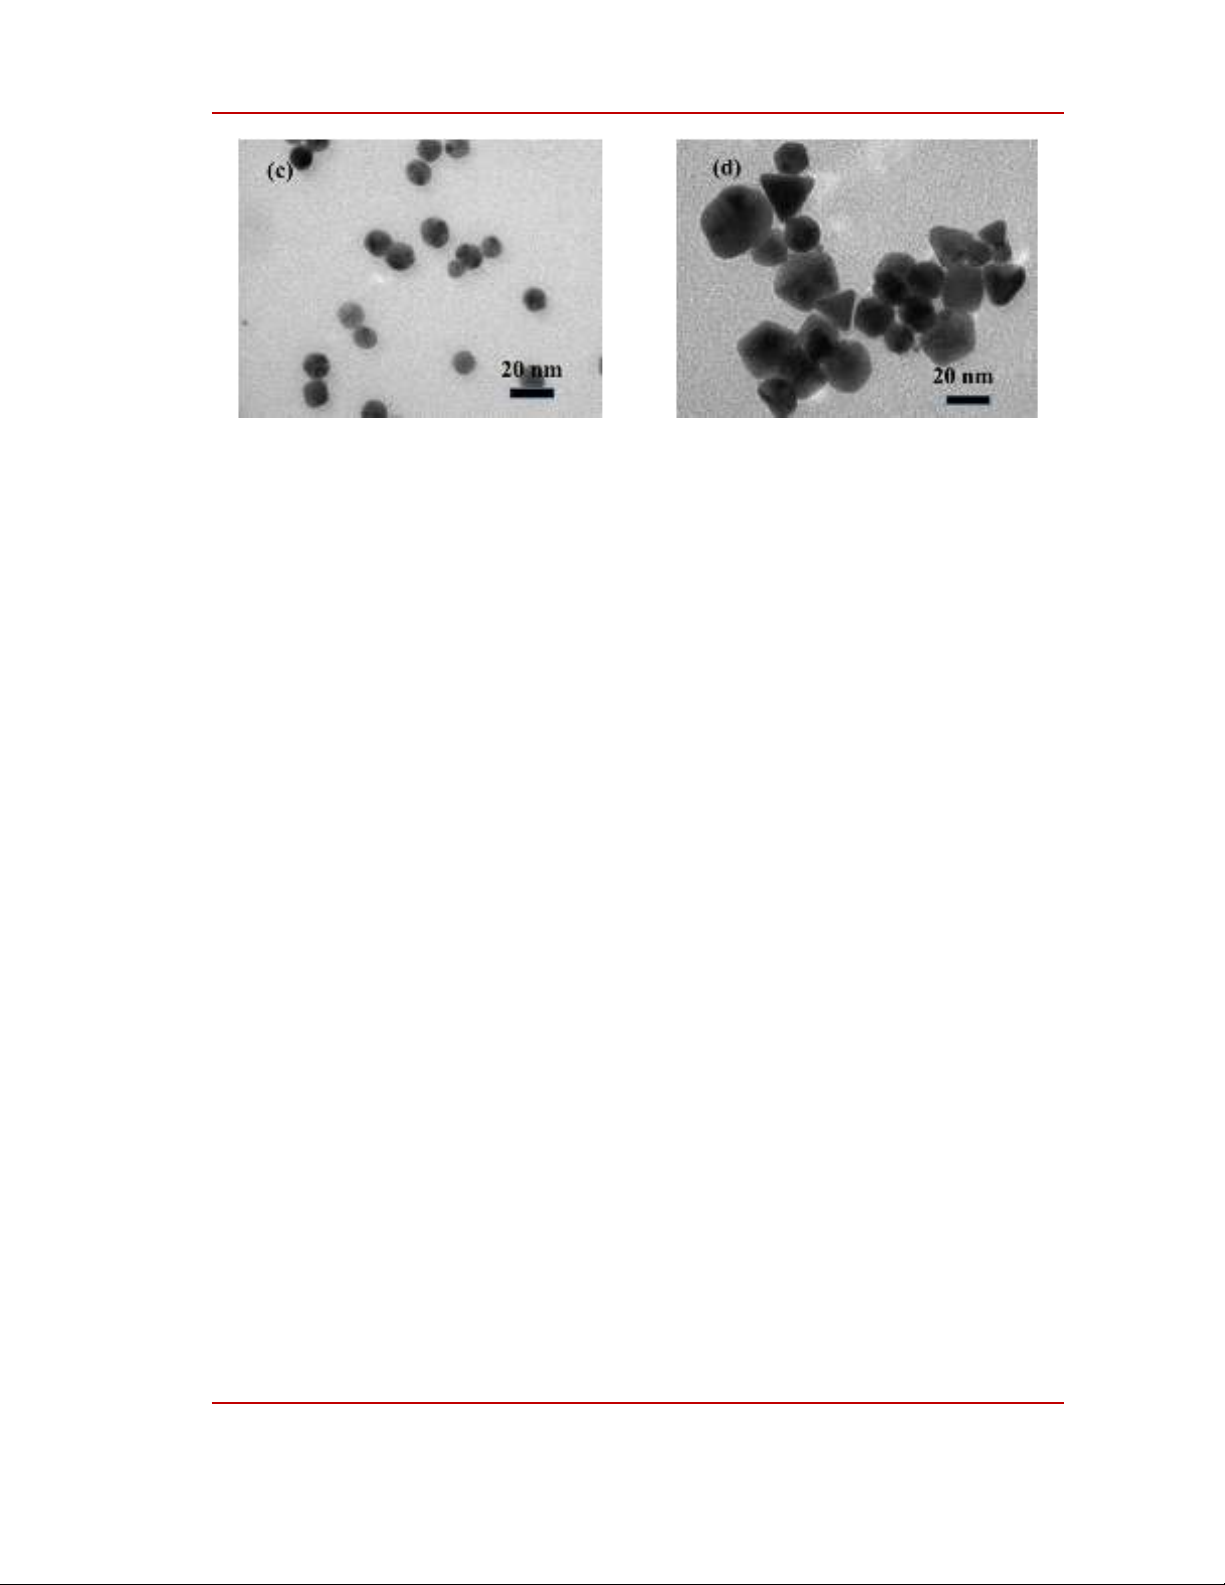
Figure 3: TEM images of gold nanoparticles fabricated at different voltages: (a) 9V; (b) 12V; (c) 15V
and (d) 18V
Figure 3 shows TEM images of Au NPs synthesized at different voltages. In samples synthesized
at 6V, we evaluated their size and morphology in our previous report [16]. At this voltage, Au NPs
formed with low concentration and irregular size are completely consistent with the analysis of the
UV-Vis spectra. Figure 3(a), 3(b), 3(c) present TEM images of Au NPs synthesied at 9V, 12V and
15V. TEM images show that these gold nanoparticles are similar in shape and size at these voltages.
Specifically, at these voltages, Au NPs are spherical, with sizes ranging from 10 to 18 nm. Moreover,
grain boundaries are very clear, which proves that Au NPs are well dispersed in water. Figure 3(d) is a
TEM image of Au NPs synthesized at a voltage of 18V. TEM images show spherical particles similar
to the sample synthesized at the lower voltage, there are also Au NPs with different shapes such as
pyramids, cubes, and particle sizes ranging from 20-40 nm. Thus, the plasmon absorption peak of this
sample shifted to a longer wavelength compared to that of the sample synthesized at the lower voltage.
It can be explained by two reasons: (i) the increase of particle size at high voltage; and (ii) the
appearance of anisotropic Au NPs. Furthermore, all the observed Au NPs have the same density,
indicating that Au NPs have crystallized well and uniformly.