
REGULAR ARTICLE
Use case 3: post accidental site remediation CEA
Yvon Desnoyers
1,*
, Claire Faucheux
1
, and Nadia Pérot
2
1
Geovariances, 49bis avenue Franklin Roosevelt, 77210 Avon, France
2
DEN/CAD/DER/SESI/LEMS, CEA Cadarache, 13108 Saint Paul-Lez-Durance, France
Received: 23 October 2019 / Received in final form: 13 November 2019 / Accepted: 4 December 2019
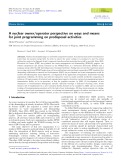
Abstract. Within the H2020 INSIDER project, the main objective of work package 3 (WP3) is to draft a
sampling guide for initial nuclear site characterization in constraint environments, before decommissioning,
based on a statistical approach. This paper is dedicated to the sampling strategy for use case 3 (UC3) about
contaminated soils, in the context of post-incidental remediation of a site. For this use case, the constraint
environment comes from the difficulty to collect samples beneath a building on the one hand and the fact that
samples were collected in the past with no possibility for additional samples. This task has been initiated by
gathering prior knowledge for the contaminated site and analysing the available dataset (historical
assessment + available data from non-destructive and destructive analyses).
1 Introduction
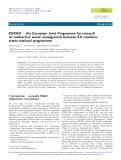
The EURATOM work program project INSIDER was
launched in June 2017 (18 partners from 10 European
countries). It aims at improving the management of
contaminated materials arising from decommissioning and
dismantling (D&D) operations by proposing an integrated
methodology of characterization. The methodology is
based on advanced statistical processing and modelling,
coupled with adapted and innovative analytical and
measurement methods, in line with sustainability and
economic objectives.
An integrated and overall approach of pre-decommis-
sioning characterization consists in evaluating historical
data, making on-site measurement campaigns, sampling
and analysing, developing scaling factors and applying
numerical codes. The final objective of work package 3 is to
draft a guideline for sampling in the field of initial nuclear
site characterisation in constraint environments in view of
decommissioning, based on a statistical approach. In order
to reach this goal, a first review of available and relevant
standards, guides and methods used for sampling design
and data analysis has been initially completed [1].
Therefore, statistical approaches to be used in constraint
environment have been described as a generic strategy for
handling problem definition, data analysis and sampling
design definition [2]. This second task has then been
implemented in a web-based application presenting the
strategy in a more user-friendly way.
Within task 3.3, the strategy is thoroughly tested in
practice within three different test cases (this task has been
initiated by gathering prior knowledge for each test case
(historical assessment + available data from non-destruc-
tive and destructive analyses) and developing the different
sampling plans):
–use case 1: Decommissioning of a back/end fuel cycle
and/or research facility: Radioactive liquid and sludge in
tank at JRC Ispra (Italy);
–use case 2: Decommissioning of a nuclear reactor:
Activated bio-shield concrete of the BR3 reactor
(Belgium);
–use case 3: Post accidental land remediation: Contami-
nated soils beneath a CEA building (France).
The return-of-experience will allow refining the overall
approach for the final guideline within the INSIDER
project.
This paper is precisely dedicated to the sampling
strategy for use case 3 (UC3) about contaminated soils, in
the context of post-incidental remediation of a site [3]. For
this use case, the constraint environment comes from the
difficulty to collect samples beneath a building on the one
hand and the fact that samples were collected in the past
with no possibility for additional samples. However, new
measurements (both non-destructive and destructive) are
possible on the existing samples, if appropriate and
relevant for the overall characterization of this site. This
may be performed in order to improve the uncertainty
quantification within the INSIDER project at WP6 level
(Performance analysis and overall uncertainty), combining
outputs from WP3 (sampling strategy), WP4 (In lab
analysis) and WP5 (on site measurements).
*e-mail: desnoyers@geovariances.com
EPJ Nuclear Sci. Technol. 6, 13 (2020)
©Y. Desnoyers et al., published by EDP Sciences, 2020
https://doi.org/10.1051/epjn/2019060
Nuclear
Sciences
& Technologies
Available online at:
https://www.epj-n.org
This is an Open Access article distributed under the terms of the Creative Commons Attribution License (https://creativecommons.org/licenses/by/4.0),
which permits unrestricted use, distribution, and reproduction in any medium, provided the original work is properly cited.
2 Presentation of UC3: contaminated soils
beneath a CEA building (France)
For some confidentiality reasons the strict minimum of
the site context information has been made available
within the INSIDER project. However, this situation is
sometimes representative of real circumstances for old
facilities for instance, for which historical knowledge
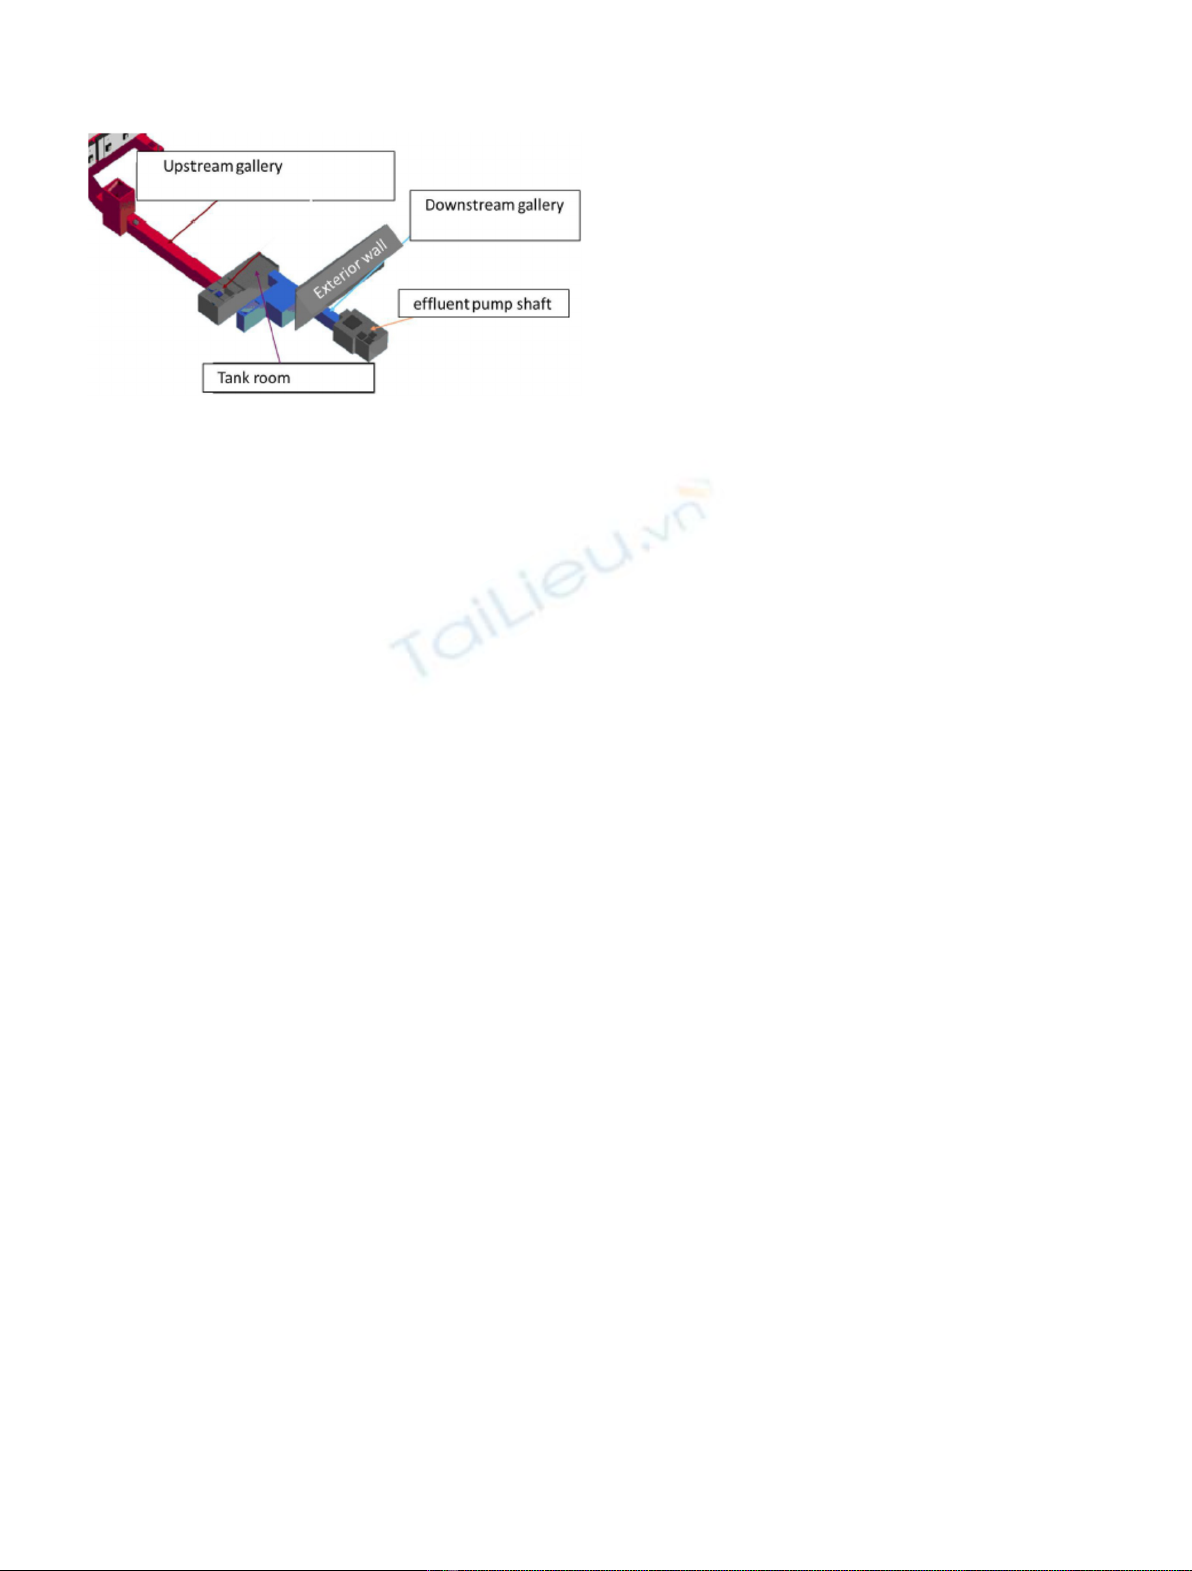
results are very limited. What can be mentioned is this
nuclear facility was devoted to radiochemistry on trans-
uranium elements. It was under operation until 1992 on a
CEA site in France. A tank room is located beneath the
basement and collected various effluents from experi-
ments through pipes along the upstream gallery. An
additional downstream gallery leads to the lowest point of
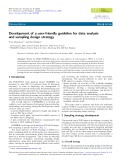
the facility (effluent pump shaft). The main contaminated
soil area is located beneath this building, just below the
former tank room (Fig. 1).
It has been reported that different incidents occurred
during nuclear facility operation. Contamination of soils
beneath the tank room with few TBq of various alpha et
beta emitters is expected due to leaks of very high
radioactive effluent in the tank room and several potential
contamination pathways to reach the soils such as ingress,
cracks or expansion joints of the concrete slab.
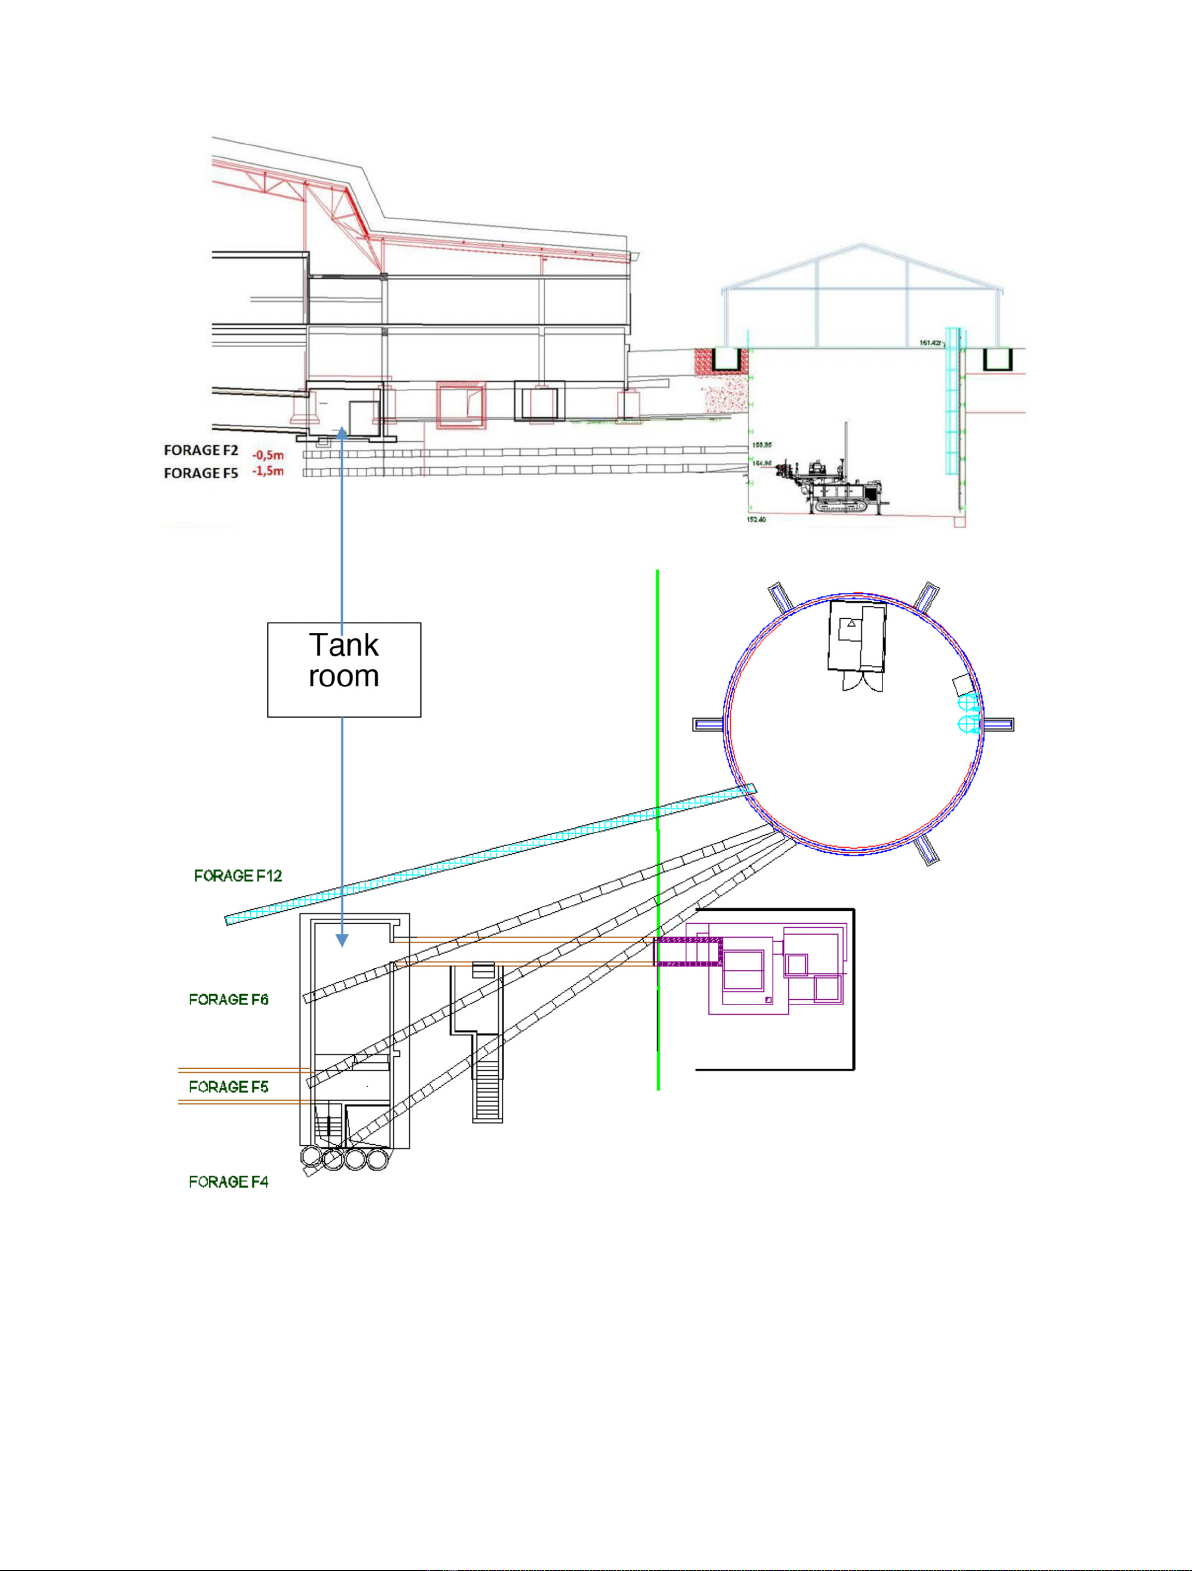
In order to improve the radiological assessment of soils
below this tank room, different sampling campaigns have
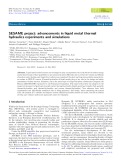
been conducted. They consist in 7 horizontal drill holes
between 2012 and 2015. The 7 drill holes are distributed in
two horizontal layers at 0.5 and 1.5 m below bottom of the
tank room slab (Fig. 2). The drilling machine was located
at the bottom of a circular pit outside of the building to
access this area and go horizontally. This approach is not
very common for soil sampling as generally vertical drill
holes from the top surface is preferred. However, due to
the presence of the building and the impossibility to
introduce the drilling machine in the tank room, this
deported and long-range horizontal drilling location has
been preferred.
Collected soil samples are quite comparable with the
presence of small to intermediate size gravel in a sandy
matrix. Samples have been then constituted taking 500–
800 g mass (geometry standardized at 500 mL) assuming
two core lengths: 0.5 or 1 m. First observations of
radioactivity distribution depend on soil compositions
and radionuclides chemical properties. In addition, activity
seems to be concentrated in small soil particles.
Within the INSIDER project, the existing dataset
is considered as the final one for this use case 3. There is
no sampling design definition as for the other use
cases, but the statistical analysis promises to bring
interesting and relevant conclusions for the whole
project due to the number (220) of available samples.
This will be performed by conducting sensitivity analysis
(extracting different sub-datasets) and possibly valuate
the correlation with 5-cm gamma-scanning values along
the cores.
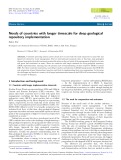
3 Characterisation objectives
3.1 Global estimation of statistical quantities
For the preparation and management of a soil remediation
project, some global quantities need to be estimated in a
sound way. For instance, average activity concentration
value for the whole area (as well as its related uncertainty)
is an interesting parameter and needs to be statistically
estimated. The different statistical tests and inequalities
can be derived if the dataset is compatible with the
underlying hypotheses. Spatial and/or statistical biases
need to be carefully addressed. Consequently, the total
activity (still along with its confidence level) can be
estimated as an accumulation (knowing the total volume
and the matrix density).
Other global statistical quantities are linked to
specific values. At that stage, global estimations of
volumes exceeding radiological thresholds significantly
help for the classification according to the different waste
categories.
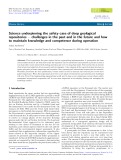
3.2 3D distribution map of activity concentration
and waste segregation
In addition to the global estimates presented previously,
some local estimates are very relevant for the adequate
management of remediation projects. The analysis of
depth profiles combined with the horizontal distribution
leads to 2D/3D representations depending on the
dataset spatial organization. Appropriate geostatistical
methods need to be carefully selected given the spatial
continuity of the phenomenon and the database
configuration (linearity, stationarity, multivariate,
trend, etc.).
Local estimates derive from comparison to specific
radiological values. The local probability of exceeding a
radiological threshold then leads to the volumes to be
excavated in the different waste categories. At this stage,
radiological thresholds for the different waste categories
are not yet fully defined, for site release values
particularly (output of operator impact assessment
Fig. 1. Use case 3 location beneath a tank room of a former
nuclear facility.
2 Y. Desnoyers et al.: EPJ Nuclear Sci. Technol. 6, 13 (2020)
study). For the segregation between Very-Low Level
waste and Low-Level waste, as a French site, ANDRA
(National Radioactive Waste Management Agency)
specifications are quite clear and require a weighted
sum calculation according to scaling factor and nuclide
class (IRAS). In any case we will need to have/apply a
certain radionuclide vector (including uncertainties)
that must be determined and applied as well. These
aspects will need a lot of attention in the coming
analysis.
This classification decision can also take the remedia-
tion support into account (e.g. averaging out over 1 m
3
or
1 ton or other values). All classification decisions then
require working on estimation uncertainties.
Fig. 2. Vertical cross section (top) of the horizontal drilling layers. Top view (bottom) of the angular distribution of drill holes at depth
1.5 m.
Y. Desnoyers et al.: EPJ Nuclear Sci. Technol. 6, 13 (2020) 3
Finally, the different costs for the soil excavation, waste
confection and disposal may be integrated as a forecast of
the remediation project and compared and balanced to the
initial characterization costs.
4 Ongoing works
4.1 Dealing with a unique existing dataset
As there is no possibility for new samples and new in situ
measurements, the existing dataset is considered as the
final one within the INSIDER project for this use case 3.
However, non-destructive measurements and new samples
can be performed on the existing cores.
There is no sampling design definition as for the other
use cases, but the statistical analysis promises to bring
interesting and relevant conclusions for the whole INSID-
ER project due to the number of available samples (see also
discussion in Sect. 4.4).
In addition, sensitivity to dataset extension will be
studied as 2 zones can be identified: the inner area with the
highest activity levels (corresponding to the 50 cm
sampling resolution along the cores) and the accessibility
area (with a 1 m mesh). Statistical outputs will differ
because of this spatial delineation.
As it seems to be a relevant 3D contamination, areas
with high estimation uncertainties as well as extrapolation
areas will finally be identified. They would have been used
for recommendations of new samples in the case of a site
with possible additional investigation.
4.2 Preliminary analysis
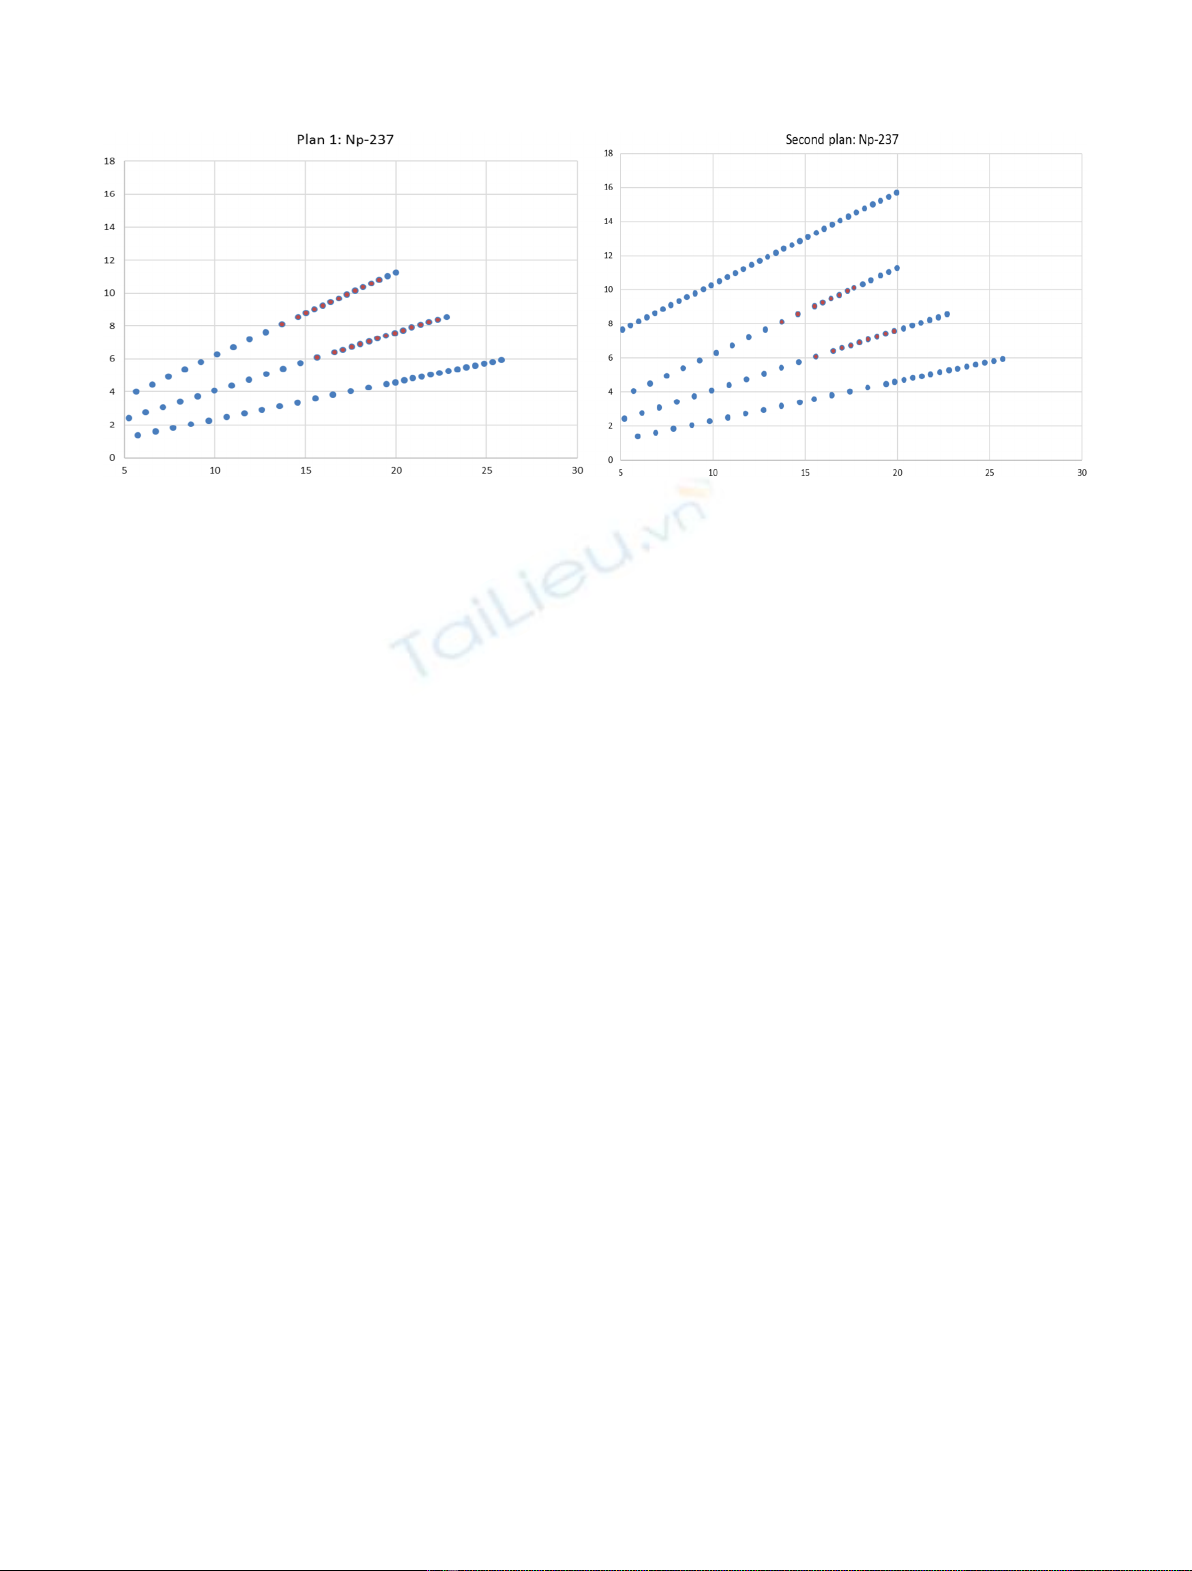
Looking to the spatial organisation, samples were collected
along 7 cores, distributed in two layers. The sampling
resolution is 1 m and is refined to 50 cm in the interest area
(Fig. 3). Therefore, the first 10–15 meters from the origin
point can be considered as an accessibility distance. The
last borehole (named F12) is different as it presents a 50 cm
sampling resolution from the beginning. The total number
of analysed samples then reaches 220, which can be
considered as a large dataset at first glance.
Preliminary direct measurements have been performed
along the cores. They consist in gamma and X scanning
(gross counting) on a regular 5 cm mesh. These indirect
measurements probably serve as a semi-quantitative
characterisation of the gamma content of soil samples.
However, these measurements are not part of the
transmitted data but the operator has agreed to add them
to this use case. That would be very relevant for INSIDER
project to be able to combine in-situ and destructive values
in order to improve the estimations (and reduce the
uncertainties).
Main nuclides for laboratory analyses are Np-237, Pa-
233 for gamma emitters and Sr-90 for beta emitter. Other
gamma emitters such as Co-60, Eu-152, Uranium and
Thorium chains are not present (or at very low levels, close
to detection limits). Cs-137 and Am-241 are detected on
some samples. In addition, the different Plutonium
isotopes (238, 239+240 and 241) have been quantified
using appropriate alpha measurements. It seems that alpha
spectrometry (dissolution, extraction, electrodeposition)
and beta counting (liquid scintillation with a detection
limit of 30 Bq/kg) have been initially decided on the basis of
the higher dose rate location on the core. At the end, most
of all samples have been measured for alpha emitters.
As for statistical distribution, as generally observed for
soil contamination, the histogram is very skewed (as
presented on Fig. 4 for Np-237) with a lot of measurements
at detection limit and with intermediate to high value in a
more limited number.
In addition, a correlation analysis puts into evidence
some interesting statistical links between nuclides except
for Cs-137, Co-60 and partly Plutonium isotopes. The
correlation matrix at Figure 5 then presents linear
regression coefficients on the bottom left part and
corresponding correlation dispersion shape on the upper
right part (the diagonal of the nuclides has been reordered
to underline correlated groups). Correlation values are all
positive from very low values (close to 0 or statistically
Fig. 3. Base maps of the two sampled layers (above detection limit in red). Drillings at depth 0.5 m on the left and at 1.5 m on the
right.
4 Y. Desnoyers et al.: EPJ Nuclear Sci. Technol. 6, 13 (2020)
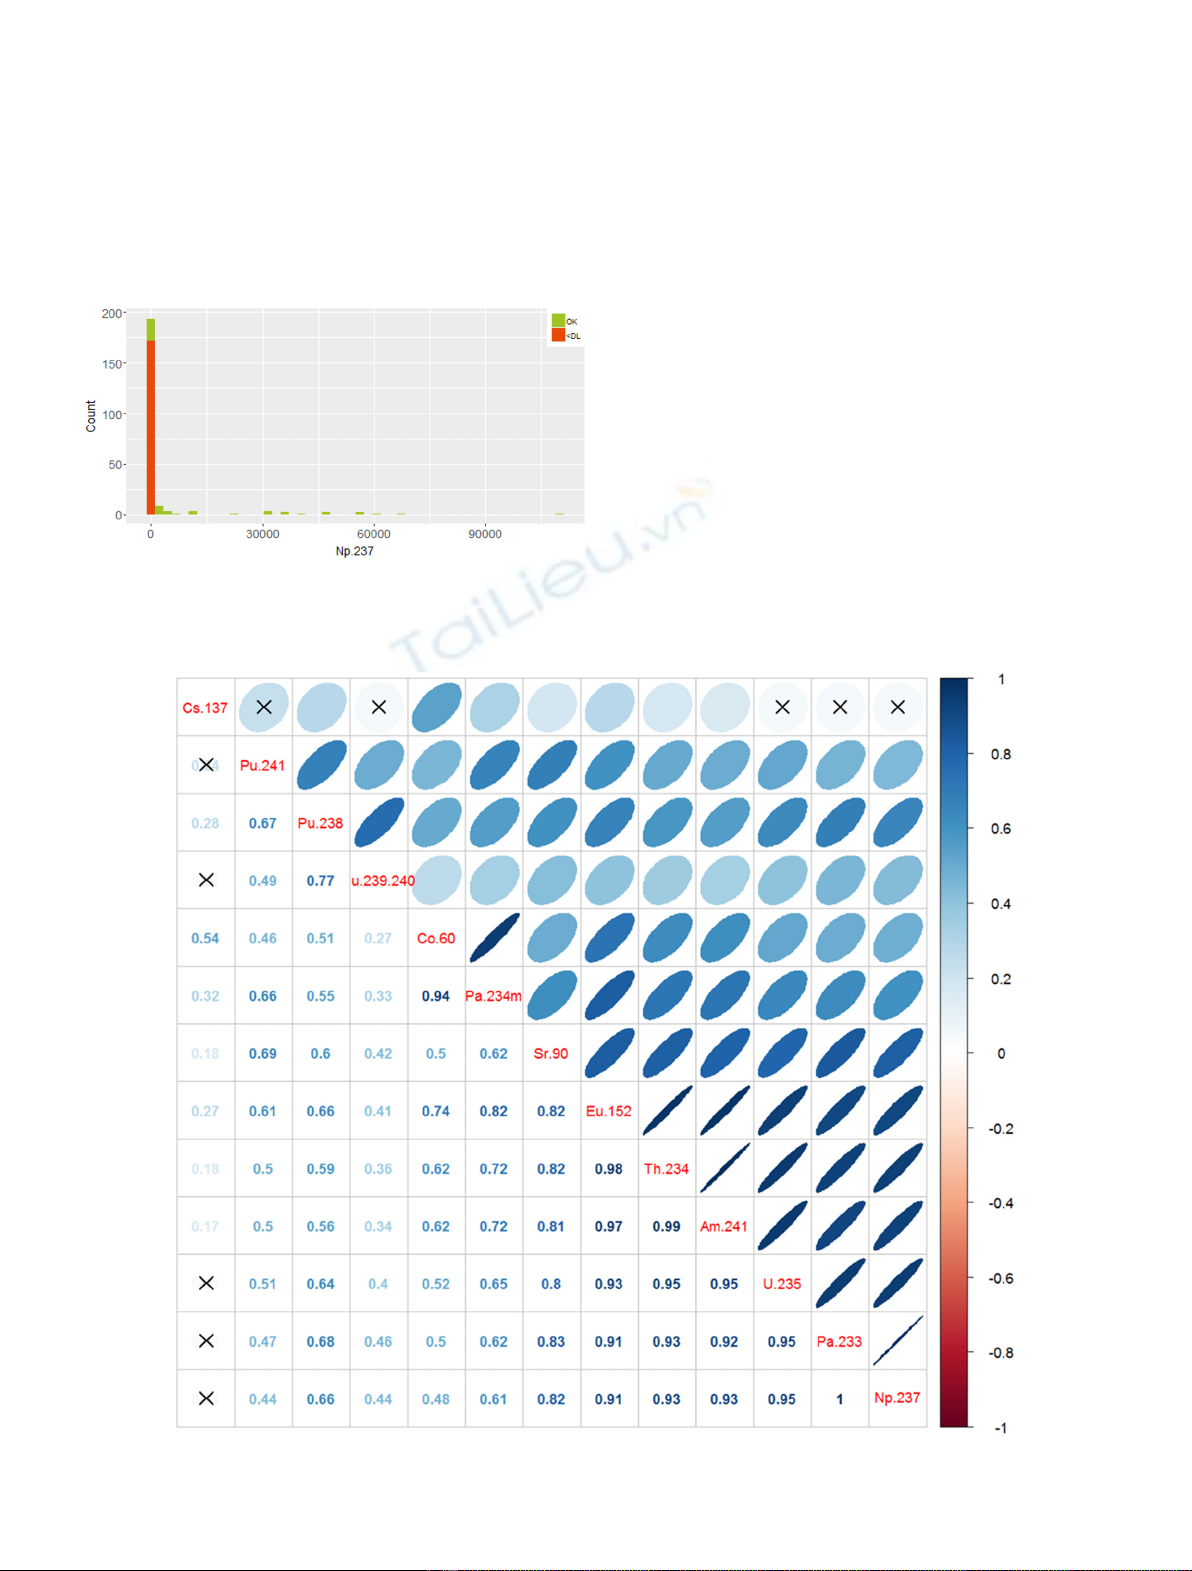
insignificant) to 1 for perfect positive correlation. This
analysis also identifies a few outliers that are under
investigation and verification to correct them if they are
erroneous values (mistyping for instance) or if they have to
be considered as singular values.
4.3 First geostatistics results
A sound geostatistics processing of the data always starts
with a deep preliminary data analysis. This pre-processing
step is crucial to build a consistent database. First, spatial
bias due to non-probabilistic sampling is tackled with
declustering techniques (spatial weighting). The joint
analysis of the statistical distribution (histogram) may
identify heterogeneous populations (spatial, temporal,
units, sample support, etc.) that need to be corrected or
separated for a proper understanding. A skewed distribu-
tion requires a non-linear data transformation (indicator or
logarithm eventually but more interestingly Gaussian
anamorphosis as shown on Fig. 6). In the presence of a
correlated variable, a multivariate processing can be
implemented at all stages, and is very useful if the
auxiliary data is denser than that of the primary variable
(that points is not addressed yet with the gamma scanning
values).
The heart of geostatistics is the analysis and the
modelling of the spatial continuity using the variogram.
Fig. 4. Histogram of Np-237 activity levels.
Fig. 5. Correlation matrix between nuclides.
Y. Desnoyers et al.: EPJ Nuclear Sci. Technol. 6, 13 (2020) 5


![Đề ôn tập cuối kỳ môn Kỹ thuật nhiệt - Nhiệt động học [mới nhất]](https://cdn.tailieu.vn/images/document/thumbnail/2026/20260310/hoaphuong0906/135x160/60681773197823.jpg)

![Bài giảng thang máy và thang cuốn: Tổng hợp kiến thức [chuẩn nhất]](https://cdn.tailieu.vn/images/document/thumbnail/2026/20260310/hoaphuong0906/135x160/41471773283876.jpg)
