
REGULAR ARTICLE
Development of a user-friendly guideline for data analysis
and sampling design strategy
Yvon Desnoyers
1,*
and Bart Rogiers
2
1
Geovariances, 49bis avenue Franklin Roosevelt, 77210 Avon, France
2
SCK•CEN ǀBelgian Nuclear Research Centre, Boeretang 200, 2400 Mol, Belgium
Received: 23 October 2019 / Received in final form: 20 January 2020 / Accepted: 27 January 2020
Abstract. Within the H2020 INSIDER project, the main objective of work package 3 (WP3) is to draft a
sampling guide for initial nuclear site characterization in constraint environments, before decommissioning, based
on a statistical approach. The second task of WP3 aims at developing a strategy for sampling in the field of initial
nuclear site characterization in view of decommissioning, with the most important goal to guide the end user to
appropriate statistical methods (including, but not limited to those identified during the first overview task) to use
for data analysis and sampling design. To aid the end user in applying this strategy, a user-friendly application for
guiding the end user through the contents of the strategy and the initial characterization process is also developed.
1 Introduction
The EURATOM work program project INSIDER was
launched in June 2017 (18 partners from 10 European
countries). It aims at improving the management of
contaminated materials arising from decommissioning and
dismantling (D&D) operations by proposing an integrated
methodology of characterization. The methodology is based
on advanced statistical processing and modelling, coupled
with adapted and innovative analytical and measurement
methods, in line with sustainabilityand economic objectives.
The overall objective of INSIDER is to develop and
validate a new and improved integrated characterization
methodology and strategy during the D&D process, based
on three main use cases:
–A nuclear R&D facility: radioactive liquid and sludge in
tank at JRC Ispra (Italy)
–A nuclear power plant: activated bio-shield concrete of
the BR3 reactor (Belgium)
–A post accidental site remediation: contaminated soils
beneath a CEA building (France).
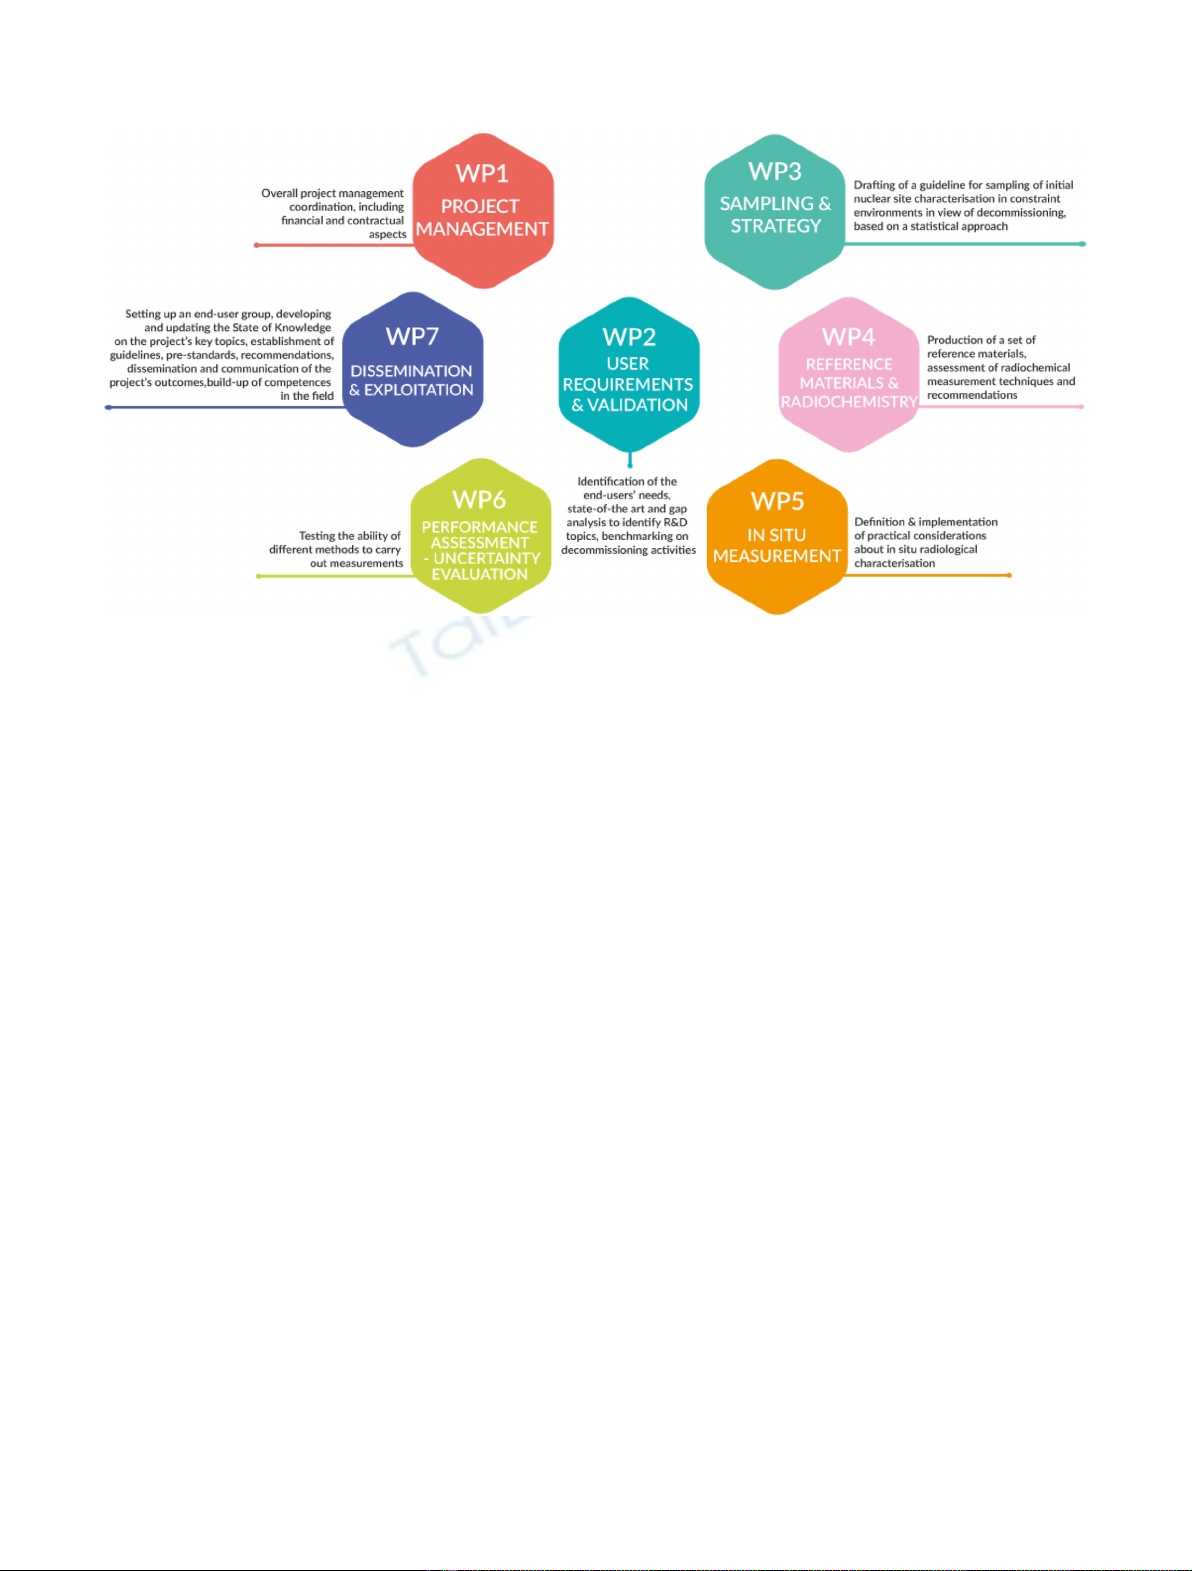
INSIDER’s activities are divided into 7 Work Packages,
each targeting a specific objective (Fig. 1).
The main objective of Work Package 3 (WP3) is to
draft a sampling guide for initial nuclear site characteriza-
tion in constraint environments before decommissioning,
based on a statistical approach. This is done by selecting
state-of-the-art techniques concerning sampling design
optimization, using prior information and multiple iter-
ations, testing the approach through different case studies
and reviewing the feedback from overall uncertainty
calculations. The process followed to meet the main
WP3 objective consists of four steps:
–Status: provide an overview of the available sampling
design methods and state-of-the-art statistical techniques.
–Development: develop a strategy/methodology that
makes use of state-of-the-art techniques, and present it
in a user-friendly software application.
–Implementation: apply the methodology to the different
test cases considered in order to test its adequacy.
–Guidance: summarize all the findings in a comprehensive
sampling strategy guide.
This paper aims to present and share the mid-term
outputs of WP3, in particular for the second task dealing
with the development of a user-friendly guideline for data
analysis and sampling design strategy.
2 Sampling strategy development
This second task of WP3 aims at developing a strategy for
sampling in the field of initial nuclear site characterization
in view of decommissioning, with the most important goal
to guide the end user to appropriate statistical methods
(including, but not limited to those identified during the
first task [1]) to use for data analysis and sampling design.
The first output of this second task is consequently a
detailed report [2] that is summarised in the next sections.
2.1 Overall strategy
While the data analysis and sampling design methods that
can be applied depend strongly on the situation and specific
*e-mail: desnoyers@geovariances.com
EPJ Nuclear Sci. Technol. 6, 16 (2020)
©Y. Desnoyers and B. Rogiers, published by EDP Sciences, 2020
https://doi.org/10.1051/epjn/2020006
Nuclear
Sciences
& Technologies
Available online at:
https://www.epj-n.org
This is an Open Access article distributed under the terms of the Creative Commons Attribution License (https://creativecommons.org/licenses/by/4.0),
which permits unrestricted use, distribution, and reproduction in any medium, provided the original work is properly cited.
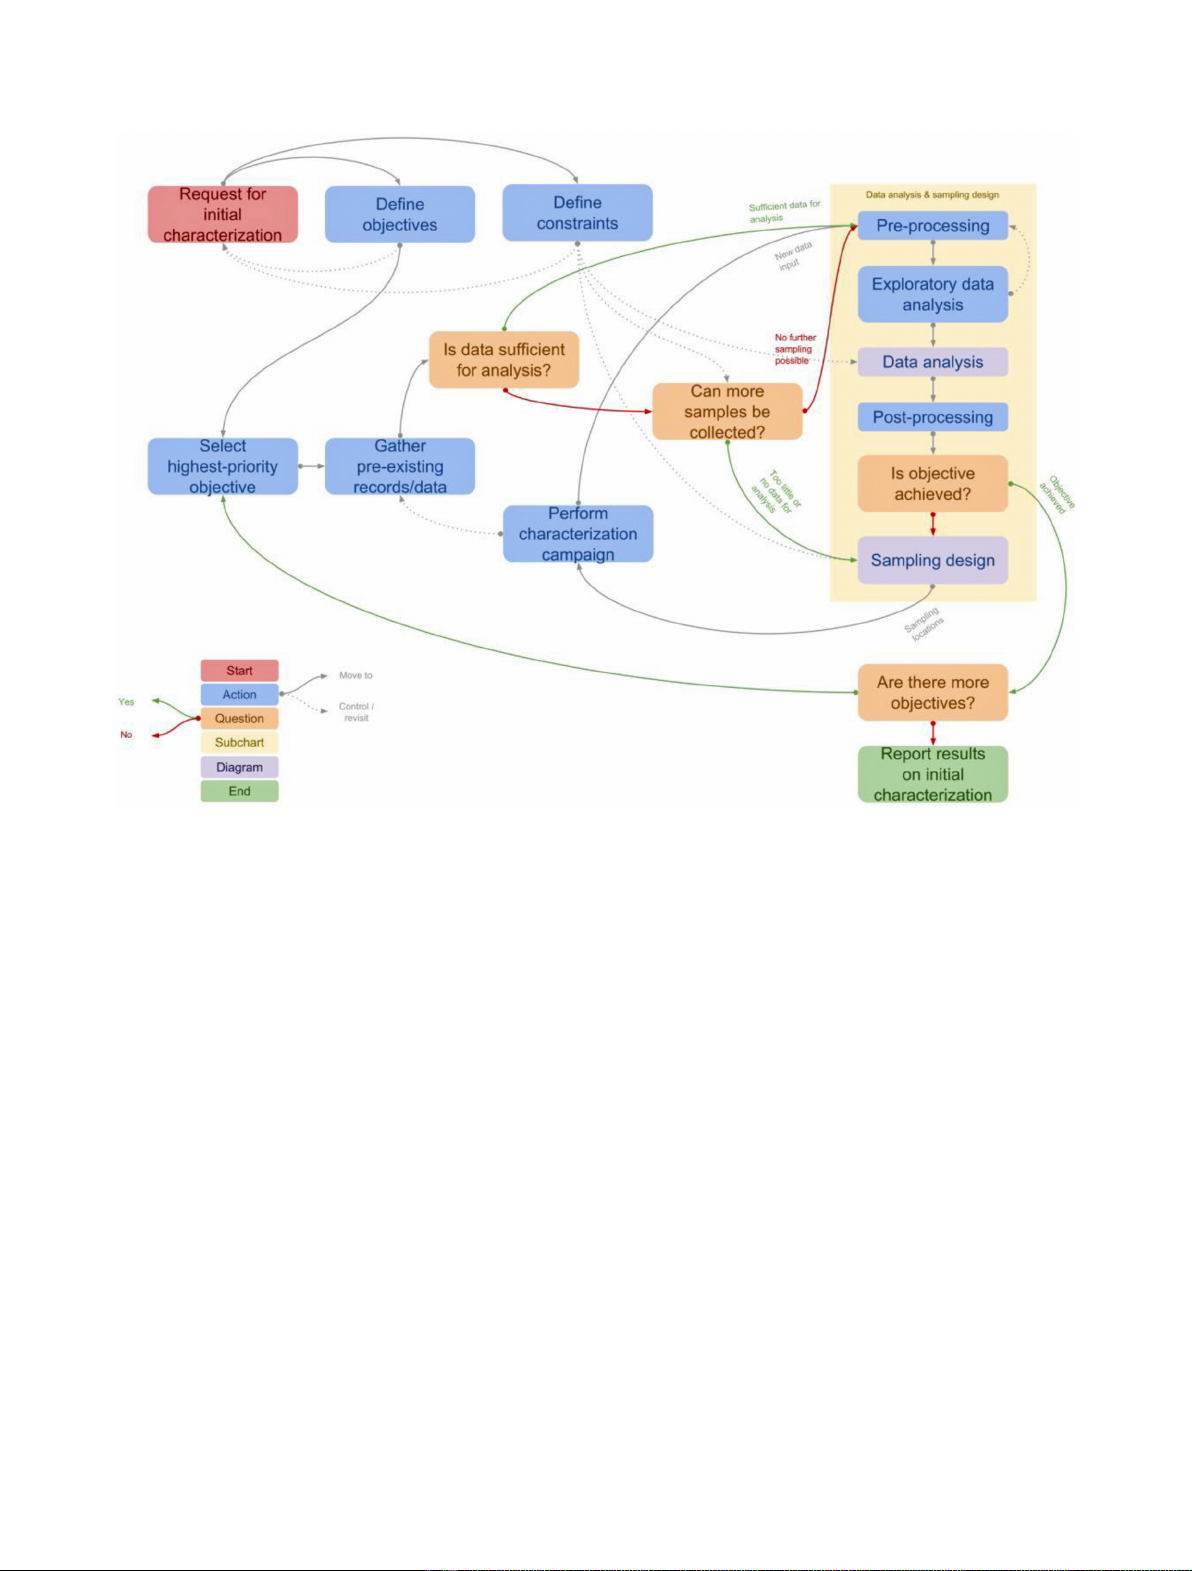
goals of initial nuclear site characterization, the overall
strategy often takes the form of the generic workflow
illustrated in Figure 2.
The starting point considered here is the request for
initial nuclear site characterization to a radiological
characterization team. Such a request can come from
different kinds of actors, and can come with different
amounts of detail. Following this request, a clear list of all
objectives and identification of the constraints is absolutely
required, and might ask for some iterations with the
applicant to agree on the goals and priorities. The highest-
priority objective should be tackled first in most cases, and
the cycle along the different objectives is started.
All prior information that is available and relevant for
the investigated case should be gathered as a first step. If
some data would already be available, a first analysis to
check if the objective is achieved is probably very useful,
even if the results come with lots of uncertainty. In D&D,
such prior information is nearly always available. Work is
carried on historical installations and/or sites that have
been shut down, or are going to be. Therefore, there is
always a history of the exploitation phase, with available
data, so this initial data-gathering step is of vital
importance.
The data analysis following the data collection consists,
in general, of the following steps: pre-processing, explor-
atory data analysis, the actual data analysis, and
potentially a postprocessing step. If the objective is not
achieved, a sampling design should be proposed using the
most appropriate method(s) given all prior information
and the data analysis result. Following the design, the
corresponding characterization campaign should be per-
formed. Additional characterization can reveal unexpected
issues, and often revisiting the gathering of prior informa-
tion is then useful. After the additional characterization,
the updated dataset is again analysed, and the iterative
procedure is continued until the objective is finally reached.
The entire process can then be repeated to tackle the
remaining objectives. Once all objectives have been
achieved, the initial characterization study should be
reported in a transparent way, making clear what has been
measured, which results were obtained from the data
analysis, and how large the corresponding uncertainty is.
2.2 Data analysis
For organizing the different data analysis techniques, the
Venn diagram presented in Figure 3 is developed. The
different categories are based on four aspects of the data,
studied in the exploratory data analysis step:
–the requirement for multivariate methods to account for
correlations between variables,
–the presence of spatial structure (non-randomness of
spatial activity distribution),
–the presence of spatial trends (to be prior modelled
possibly),
–and the requirement for robust methods (in case of small
datasets).
The methods that are able to handle two, three or all
aspects, are listed in the corresponding intersections. It is
also possible none of these aspects apply, in which case the
methods are presented outside of the diagram. More details
on the individual methods are available in [2].
2.3 Sampling design
If the objective cannot be achieved with the available data,
more information is required, and a proper sampling design
should be made before collecting new data. There exists a
variety of different ways to approach this, and the main
drivers here are the available data, the type of problem at
Fig. 1. INSIDER work package distribution.
2 Y. Desnoyers and B. Rogiers: EPJ Nuclear Sci. Technol. 6, 16 (2020)
hand (revealed by the exploratory data analysis), the
outcome of the data analysis, and the reason why the
objective cannot be achieved. A similar Venn diagram
organizes the selected sampling approaches according to
their probabilistic or judgmental basis on the one hand,
and an equal or unequal probability of selection on the
other (Fig. 4). Note that the list of approaches provided
here is non-limitative. Again, more details on the individual
approaches are available in [2].
It should be noted here however, that in practice,
sampling design consists most often of a combination of
these approaches, as objectives and/or sampling targets
often have multiple facets in real life.
2.4 Optimisation
Sampling strategy sometimes evolves into an iterative or
adaptive approach. Based on a first sampling data set, it
can be necessary to collect additional points in order to
improve the initial estimation and/or to reduce related
uncertainties. This sampling optimization is then strongly
impacted by the characterization objective and can follow
different rules.
–Statistics: add random points to improve statistics.
–Spatial clustering: add points around initial values that
exceed a threshold (or any other criterion) to improve
delineation.
–General optimisation: find the best set (number and
location) of additional points using computer algorithms
(simulated annealing, genetic algorithm…) for a given
objective function.
3 Implementation in a user-friendly interface
Toaidtheenduserinapplyingthisstrategy,auser-
friendly application [3] for guiding the end user through
the contents of the strategy and the initial characteriza-
tionprocessisavailable online at https://insider-h2020.
sckcen.be/. It has the same objectives:
–Define requirements for a statistical approach in the
field of initial nuclear site characterisation in view of
decommissioning combination of various non-destructive
and destructive measurement results, sampling repre-
sentability, multi variate analysis, overall associated
uncertainties, accounting for prior knowledge.
–Help the user to select and develop an optimal statistical
approach to be used in constraint environments.
3.1 Used tools
This deliverable is developed using R [4] and RStudio [5]
and the following contributed R packages:
Fig. 2. Overall flowchart for sampling strategy and data analysis.
Y. Desnoyers and B. Rogiers: EPJ Nuclear Sci. Technol. 6, 16 (2020) 3

Fig. 3. Data analysis Venn diagram.
Fig. 4. Sampling design Venn diagram.
4 Y. Desnoyers and B. Rogiers: EPJ Nuclear Sci. Technol. 6, 16 (2020)
—R Markdown [6]
●Allows writing in the simple markdown format (almost
text files with specific header and easy formatting)
●Outputs are classical html files + JavaScript for an
interactive website
—Flexdashboard [7]
●Provides a specific output format for the rmarkdown
package
●Nice html + JavaScript dashboard for interactive apps
—svgPanZoom [8]
●Wrapper for svg-pan-zoom.js (https://github.com/
ariutta/svg-pan-zoom)
●Easily applied to SVGs from within R through the html
widgets framework (https://www.htmlwidgets.org/)
—pacman [9] and here [10] for more automated and
reproducible setup.
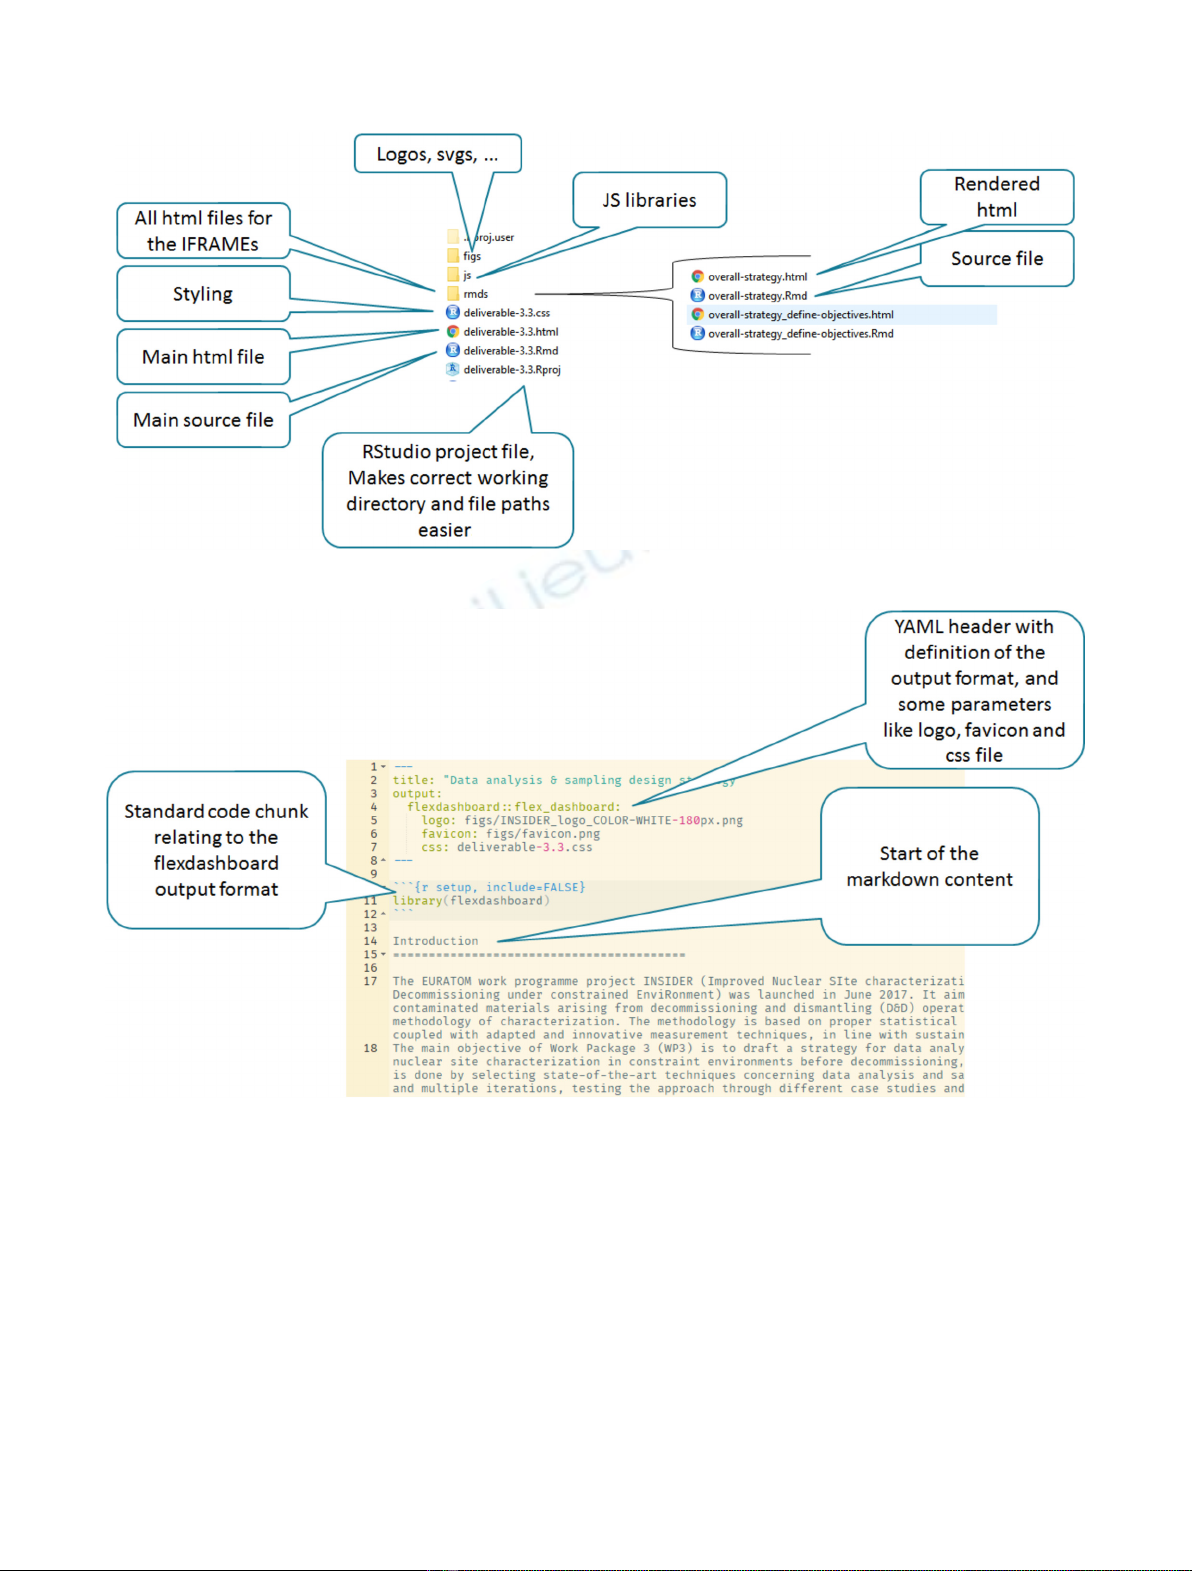
3.2 Source files
The file structure is presented in Figure 5. Input files
(*.Rmd) and output files (*.html) are at the same
level (both in the main project folder and the
“rmds”subfolder). Other JavaScript libraries, widgets
and figures are located in additional dedicated sub-
folders.
An example of source file (*.rmd) is presented in
Figure 6.
Fig. 5. File structure of the web-based interface.
Fig. 6. Main *.Rmd file.
Y. Desnoyers and B. Rogiers: EPJ Nuclear Sci. Technol. 6, 16 (2020) 5


![Đề ôn tập cuối kỳ môn Kỹ thuật nhiệt - Nhiệt động học [mới nhất]](https://cdn.tailieu.vn/images/document/thumbnail/2026/20260310/hoaphuong0906/135x160/60681773197823.jpg)

![Bài giảng thang máy và thang cuốn: Tổng hợp kiến thức [chuẩn nhất]](https://cdn.tailieu.vn/images/document/thumbnail/2026/20260310/hoaphuong0906/135x160/41471773283876.jpg)
