Vietnam Journal
of Agricultural
Sciences
ISSN 2588-1299
VJAS 2024; 7(4): 2280-2293
https://doi.org/10.31817/vjas.2024.7.4.03
2280
Vietnam Journal of Agricultural Sciences
Received: May 29, 2024
Accepted: December 16, 2024
Correspondence to
nhduong@vnua.edu.vn
ORCID
Nong Huu Duong
https://orcid.org/0000-0001-9867-
5249
Spatial Assessment of Pollutant Loads in
the Ma River Basin, Song Ma District, Son
La Province
Ngo Thanh Son, Nong Huu Duong*
Faculty of Natural Resources and Environment, Vietnam National University of
Agriculture, Hanoi 12400, Vietnam
Abstract
This study evaluated the impact of pollution sources on the Ma
River Basin in Son La Province, Vietnam, using data from local
reports, statistical yearbooks, and scholarly literature. Through
spatial analysis and statistical methods, the study mapped the
distribution of pollutants across sub-basins in Song Ma district and
assessed the pressure of each pollution source on water quality. The
findings revealed that livestock raising and domestic activities were
the major contributors to water pollution in the cluster 1 of sub-
basins, while land-use activities were major threats to the surface
water in the cluster 2 of sub-basins. The study recommended
implementing centralized wastewater treatment systems in priority
areas, promoting sustainable land management practices, and
supporting environmentally friendly agricultural and livestock
farming methods. These interventions are crucial for achieving
sustainable development goals related to clean water and sanitation.
The findings underscore the importance of integrated river basin
management strategies to mitigate water pollution and ensure the
long-term health and sustainability of the Ma River Basin.
Keywords
Pollution sources, pollutant load mapping, Ma river basin
Introduction
Water pollution threatens ecosystems and poses long-term
environmental challenges. Among the United Nation’s 17 Sustainable
Development Goals (SDGs), Goal 6 (SDG6) aims to provide access
to clean water sanitation, especially in areas with difficult conditions
(Milan, 2017; Herrera, 2019). Achieving this requires improving
water quality and reducing pollution from chemicals and untreated
wastewater. SDG6 also emphasizes protecting and restoring natural
water sources and implementing integrated resource management
(Howard, 2021). Therefore, assessing the pressure of discharges on
surface water sources is crucial to help localities better control

Ngo Thanh Son & Nong Huu Duong (2024)
https://vjas.vnua.edu.vn/
2281
pollutants and implement timely interventions,
making an important contribution to ensuring
the sustainable development goals of each
country and community
Rivers are vital for economic, cultural,
social, and ecological reasons and are the
foundation to water security. In Vietnam, rapid
population growth, urban development, and land-
use changes, coupled with the adverse impacts of
climate change, have intensified challenges to
water resource management (Huong & Son,
2020; Bui et al., 2019; Tri et al., 2019). Pollution
from both point sources (PS) and non-point
sources (NPS) are the primary causes of water-
related issues such as river pollution, aquatic
ecosystem degradation, and eutrophication
(Xiang et al., 2017). Changes in land use often
complicate non-point source pollution, as the
mechanisms of pollution generation and transport
vary with different land management and land
use practices (Son&Loc, 2024). Agricultural
pollutants, primarily from fertilizers and
pesticides, are transported to water bodies
through surface runoff and groundwater flow,
which are influenced by climatic factors,
topography, and soil characteristics such as soil
type and moisture (Fan et al., 2021). The
extensive use of agricultural chemicals results in
significant amounts of nutrients and pesticides
entering water bodies, which negatively impacts
both the environment and community health (Me
et al., 2018).
Watershed-based management is often
prioritized in water resource management and
when addressing pollution because watersheds
reflect the natural movement of water flow,
offering insight into processes such as land
degradation, nutrient transport, and human
impacts (Dourojeanni, 2001; Kemper et al.,
2007). Unlike administrative boundaries,
watersheds encompass multiple geographic
regions and natural systems allowing for more
comprehensive and sustainable solutions to
water-related challenges. Since water pollution
transcends political borders, this approach
fosters collaboration among governments, non-
governmental organizations, and local
communities to address shared issues (Bach et
al., 2011).
The Ma River is a transboundary river
system shared by Vietnam and Laos and is one
of Vietnam's nine major river systems. Within
Vietnam, the Ma River basin covers an area of
17,653 km2 spanning the provinces of Dien
Bien, Son La, Hoa Binh, Thanh Hoa, and Nghe
An (Nguyen, 2024). The basin is divided into
eight planning sub-regions: Upper Ma River,
Middle Ma River, Southern Ma River -
Northern Chu River, Northern Ma River, Buoi
River Basin, Am River Basin, Upper Chu River,
and Southern Chu River. The terrain in this
region varies from gentle to steep slopes with
the mountainous areas in the Northwest having
slopes ranging from 20o to 35o. The upper Ma
River basin experiences a tropical monsoon
climate with an average annual rainfall of 1900
mm, 80% of which occurs between May and
October. According to the 2020 annual report
from the Ministry of Natural Resources and
Environment (MONRE), the basin has been
significantly impacted by land use changes, land
degradation, and nutrient depletion over the past
30 years, primarily due to widespread
deforestation, agricultural expansion, and
inadequate conservation practices. Additionally,
water pollution has become increasingly severe
as the discharge of untreated or poorly treated
wastewater has caused many water sources to
fall below acceptable quality standards for
domestic water use.
In 2019, the Vietnam Environment
Administration (VEA) issued guidelines for
calculating the carrying capacity of river water
sources (VEA, 2019). On January 8, 2024, the
Deputy Prime Minister signed Decision No.
20/QD-TTg, approving the Overall Planning for
the Ma River Basin for 2021 - 2030, with a
vision towards 2050 (Government, 2024). This
decision emphasizes the importance of assessing
and managing pollution sources in watershed
areas like the Ma River Basin to protect water
resources and enhance the quality of life for
local communities. In Vietnam, two studies by
Ngo et al. (2020, 2024) successfully applied the
VEA (2019) guidelines, along with statistical
approaches, to map pollutant loads and identify
major pollution sources at the sub-basin level in
case studies conducted in Bac Giang and Lai

Spatial assessment of pollutant loads in the Ma river basin, Song Ma district, Son La province
2282
Vietnam Journal of Agricultural Sciences
Chau provinces. These studies also highlighted
the critical need for controlling both point
source and non-point source pollution at the
watershed scale. To identify the impact of pig
farming on the total pollutant load in each sub-
basin of Yen Dung district, Bac Giang province,
Ngo et al. (2020) applied the Bayesian
information criterion (BIC) to evaluate the
significance of pig farming's contribution. In the
later study, Ngo et al. (2024) applied
multivariate analysis, including hierarchical
cluster analysis (HCA), discriminant analysis
(DA), and principal component analysis (PCA),
on log-normalized data to identify spatial
patterns in pollutant sources (COD, BOD, N-
total, and P-total) across sub-basins. First, HCA
and DA were used to group similar sub-basins
and to evaluate how effectively pollutant
variables distinguished these clusters. PCA was
then employed to further reduce dimensionality
by identifying the key pollutant sources, thereby
highlighting the most influential parameters
with minimal data loss. Building upon Ngo et
al. (2024), our study aimed to assess pollution
loads in the sub-basins of Song Ma District, Son
La Province. This will contribute to better water
resource management and support the
achievement of Sustainable Development Goal
6 (SDG 6) on clean water and sanitation. By
identifying the key pollution sources, the study
highlighted the importance of "source control,"
as required by the Environmental Protection
Law (2020) and the revised Water Resources
Law (2023), which is essential for effective
surface water quality management planning.
Materials and Methods
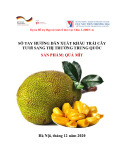
Study area
The study was conducted in Song Ma
District, Son La Province (Figure 1). Song Ma
District is located 103 kilometers southwest of
Son La City along National Highway 4G. Its
geographical coordinates are 20°39'33" to
21°22' North latitude and 103°14'56" to
104°06'00" East longitude. The total natural
area of the district is 163,955.7 hectares,
comprised of 18 communes and one town. Song
Ma District holds a crucial position in the socio-
economic development and national defense of
both the province and the country, with a 43.5-
kilometer border shared with the Lao People's
Democratic Republic.
Song Ma District has a rich network of
rivers and streams. In addition to the Ma River,
which flows through the district for 90
kilometers, there is a dense system of streams
with a density of 0.75 to 1.27 km/km².
However, their distribution is uneven. Major
streams include Nam Cong, Nam Ty, and Nam
Le, along with others like Nam Soi, Nam Man,
and Nam Con. These streams have narrow
cross-sections, steep gradients, and high flow
rates, creating substantial hydropower potential.
This provides a significant advantage for
exploiting hydropower resources and
developing small hydropower plants to serve the
local population. Several hydropower projects
have been constructed or are under construction,
such as Nam Soi, Nam Cong III, Nam Cong IV,
and Nam Cong V.
Surface water is the primary water source
for production and daily activities for residents
in the area. The district has a relatively abundant
surface water supply, with the Ma River system
and major streams like Nam Cong, Nam Ty, and
Nam Le being particularly important. These
water sources not only provide essential water
supplies but also play a significant role in the
hydrological regime and ecological
environment. However, due to the steep,
fragmented terrain and low vegetation cover, the
area's water retention capacity is very limited.
Consequently, surface water distribution is
uneven across the territory, leading to severe
water shortages in many areas, especially during
the dry season in highland villages.
Data sources
The following data sources were used in
the study:
- The 2020 land use map of Song Ma
District.
- Spatial data, including the Digital
Elevation Model (DEM) (SRTM 1 Arc-Second
Global) with a 30-meter resolution, were
downloaded from the United States Geological
Survey (USGS) website to delineate sub-basins
within Song Ma district using the QSWAT tool
in QGIS software.
Ngo Thanh Son & Nong Huu Duong (2024)
https://vjas.vnua.edu.vn/
2283
- Statistical data on the population of each
commune and town in 2023.
- Statistical data on the number of livestock
(buffalo, cattle, pigs, goats, poultry) in each
commune in 2023.
- Pollutant coefficients for the major
pollution sources were taken from the
Guidelines for Calculating the Carrying
Capacity of Rivers by the Vietnam Environment
Administration, 2019 (Tables 1, 2, 3).
- The environmental status report of Song
Ma District for 2023 (UBND, 2023a).
Calculating pollutant loads in the sub-basins
Figure 2 demonstrates the workflow for
calculating pollutant loads in the sub-basins and
can be specified in the following steps:
Sub-basin Delineation: The sub-basin
delineation process for Song Ma District was
conducted using a Digital Elevation Model
(DEM) from the SRTM 1 Arc-Second Global
dataset. The DEM was projected to the WGS
1984 UTM Zone 48N to ensure spatial
consistency with the study area. The SAGA Fill
Sinks tool (Wang & Liu, 2006) was applied to
remove depressions and ensure accurate
simulation of water flow across the terrain. The
sub-basins were delineated in QGIS using the
QSWAT tool, with an area threshold of 8000
hectares for upstream contributing areas. This
threshold value, based on the average commune
area, was selected to align with the scale
correlation between sub-basin delineation and
commune-level spatial analysis.
Figure 1
. Study area
Table 1. Pollutant coefficients applied to domestic discharge
Domestic discharge
Unit
BOD
COD
T-N
T-P
Urban area
kg/person/year
18.07
34.13
3.3
0.93
Rural area
kg/person/year
14.45
27.30
2.64
0.74
Source: VEA (2019).

Spatial assessment of pollutant loads in the Ma river basin, Song Ma district, Son La province
2284
Vietnam Journal of Agricultural Sciences
Table 2. Pollutant coefficients applied to livestock discharge
Livestock
discharge
Average rearing
time (month)
Unit
BOD
COD
T-N
T-P
Buffalo
12
kg/head/year
164
295
43.8
11.3
Cow
12
kg/head/year
164
295
43.8
11.3
Pig
6
kg/head/year
33
59
7.3
2.3
Horse
12
kg/head/year
146
263
95.3
16.4
Goat
6
kg/head/year
34
61
13.5
3.7
Poultry
3
kg/head/year
2
3
3.6
-
Source: VEA (2019).
Table 3. Pollutant coefficients from surface run-off of major land use types
Land use types
Unit
BOD
COD
T-N
T-P
Agriculture
kg/ha/year
16.8
30.2
17.9
1.1
Forestry
kg/ha/year
72.8
131.0
4.4
0.3
Specialized land
kg/ha/year
60.4
108.7
10.6
2.3
Urban
kg/ha/year
56.0
100.8
9.0
2.2
Aquaculture
kg/ha/year
90.0
162.0
12.6
-
Source: VEA (2019).
Spatial Data Integration: Statistical data at
both the commune and district levels, including
population figures, livestock numbers, and land
use types, were spatially joined with the
commune boundaries based on a common field
(commune ID). Pollutant coefficients from VEA
(2019) were applied to calculate the pollutant
loads for each commune, including those from
domestic activities, livestock, and land use
practices. It should be noted that, due to the
absence of geographic coordinates for
discharges from households and livestock
farms, these sources were considered as non-
point source pollution.
Calculation of pollution loads at the
commune level: Based on the statistical data and
pollution coefficient (Tables 1, 2, 3), four
parameters, namely BOD, COD, total nitrogen,
and total phosphorus loads, were calculated for
the major pollution sources, namely domestic
activities, livestock, and land use. For untreated
domestic and livestock sources, the runoff
coefficients were applied according to the
percentage of urbanity suggested by the Japan
Sewage Works Association (2008) in VEA
(2019). In this study, the runoff coefficient of
0.4 was applied for Song Ma town with 5-10%
of urbanity and 0.1 was applied for other
communes with less than 5% of urbanity.
Calculation of pollutant loads at the sub-
basin level: In the final step, the pollutant loads
for each sub-basin were computed. Using the
union tool in QGIS, the proportion of each
commune's area falling within the sub-basins
was determined. This enabled the estimation of
the pollutant loads at the sub-basin level by
aggregating the commune-level data
accordingly.
Statistical approaches for analyzing pollution
sources at the basin level
To analyze the pressure of pollution sources
at the basin level, we adopted three
interconnected statistical methods used in Ngo
et al. (2024). First, hierarchical cluster analysis
(HCA) was employed to group basins with
similar pollution source characteristics. Next,
discriminant analysis (DA) was applied to these
clusters to identify and highlight the differences
in pollution sources among the basin clusters,
ensuring the clusters were distinct from each
other. Finally, principal component analysis
(PCA) was used to quantitatively assess the
contribution of different pollution factors within