
* Corresponding author.
E-mail addresses: mkhaki@iust.ac.ir (A. MansourKhaki)
© 2015 Growing Science Ltd. All rights reserved.
doi: 10.5267/j.esm.2015.2.002
Engineering Solid Mechanics 3 (2015) 93-102
Contents lists available at GrowingScience
Engineering Solid Mechanics
homepage: www.GrowingScience.com/esm
Study of loading waveform, loading duration, rest period and stress level on fatigue
life of asphalt mixtures
Ali MansourKhaki*, Alireza Samdzadeh and Majid Jebalbarezi
Faculty of Civil Engineering, Iran University of Science and Technology, Tehran, Iran
A R T I C L E I N F O A B S T R A C T
Article history:
Received October 6, 2014
Accepted 2 February 2015
Available online
2 February 2015
The main objective of this paper is to study the effects of haversinse
and triangular loading
waveforms on the fatigue life of Hot Mix Asphalt (HMA) specimens. Effects of load duration,
rest period and stress level are also studied for the asphalt mixtures at 25oC. An indirect tensile
test with strain control was performed to determine the fatigue life of asphalt. The fatigue tests
were performed at two stress levels (170 and 250 kPa), two waveforms (haversine and
triangle), three load duration (100, 200, 400 ms), and two rest period to load duration ratios (4
and 9). The obtained results showed that fatigue life of haversine waveform is less than fatigue
life of triangle waveform. As the area under the loading curve is increased (stress level is
increased or deformed), effect of rest period on the fatigue life decreases. On the other hand,
as the tire contact area is increased, the induced tire pressure reduction decreases its destructive
effects on the asphalt layer. As the load duration is decreased, fatigue life will increase. This
effect is more pronounced for lower stress levels than the higher stress levels.
© 2015 Growing Science Ltd. All rights reserved.
Keywords:
Hot mix asphalt
Fatigue life
Loading waveform
Duration and rest period
xperimental study
1. Introduction
Several traffic and environmental factors affect the deterioration of roads. A substantial part of
damage on flexible pavements is caused by cracking of the asphalt concrete layer. Different types of
cracking such as fatigue cracking and low temperature cracking are frequently occurred in the
pavements. Hence, it is important to study the crack growth behavior of asphalt pavements subjected
to traffic loads of moving vehicles or thermal stresses induced by the daily or seasonal temperature
changes. While at low temperatures the risk of fast brittle fracture in the pavements increases
significantly (Kim et al., 2003a; Li & Marasteanu, 2010; Zegeye et al., 2012; Ameri et al., 2011, 2012;
Aliha et al., 2014), at higher temperatures other failure modes such as rutting or incremental and
cumulative damages induced by fatigue loads have more destructive effects on the pavements. Fatigue
(alligator) cracking is considered to be one of the most significant distress modes in pavement which

94
is associated mainly with repeated traffic load. Fatigue of pavements is a very complex phenomenon
caused by cyclic loading of traffic passing over the pavement. Fatigue cracking leads to poor pavement
performance, which in turn increases maintenance as well as road user cost (Abo-Quadis & Shatnavi,
2007). Fatigue behavior of asphalt mixtures is dependent on the test type, asphalt mixture specifications
and test variables such as loading waveform, level of stress and loading frequency (including load
duration and rest period). There are different tests to determine the fatigue of asphalt mixtures. Simple
beam with three-point bend, cantilever beam with rotating bending, direct axial, indirect rotating
flexural loading, triaxial test and indirect tensile fatigue test are some common types of these tests
(Huang, 2004; Tangella et al., 1990; Francken, 2004).
Indirect fatigue tensile test has been widely used to determine the fatigue behavior of asphalt
mixtures (Wen, 2001; Witczak, 2002). It can be done in two manners: stress control or strain control.
Indirect fatigue tensile test is done by applying compressive load to the cylindrical specimens of
approximately 100 mm diameter and 70 mm height. It is performed by using rigid loading strips that
has been placed in two opposite points in the form of an arc-shape. In general, fatigue cracks are
generated under asphalt layer and exactly under loading spot of vehicles’ tires. Stress state in these
spots is in the form of longitudinal and lateral with vertical compression. It is notable that stress state
around the circle of indirect tensile specimens is similar to stress state under the ground asphalt layer.
Fracture plane in the indirect tensile test is usually vertical and this issue can be considered as one of
the advantages of indirect tensile test. Therefore, this test is suitable for detecting starting spots of tiny
cracks and material response to these cracks. It should be mentioned that there is an exact similarity
between asphalt compaction direction and critical tensile direction in the indirect tensile test and the
asphalt performance for the fatigue cracks (Wen, 2001).
Barksdale (1971) has used finite element and elastic theory to study the vertical compressive stress
pulse width. He found that load duration is a function of speed and depth beneath the pavement surface
and mixture geometry has no effect on the load duration. He also found that pulse shape varies from an
approximately sinusoidal one at the surface to a more nearly triangular one at depths below
approximately the middle of the base. Barksdale presented a Table to calculate haversine and triangular
load duration based on the speed and depth. For example, haversine load duration for speed of 24 km/h
in the depth of 20 cm is 0.1 second. This time for triangular waveform is 0.132 second. Raithby and
Sterling (1972) studied loading waveform using axial loading fatigue test. They used haversine and
triangular waveforms to express that fatigue life of haversine waveform is longer than triangular
waveform. They claimed that it is better to use haversine waveform to calculate fatigue life of asphalt
since haversine is similar to what happens in reality. Hu et al. (2010) has shown that load duration is
not only a function of speed and depth of layer but also depends on the ratio of dynamical module of
asphalt layer and dynamical module of closest layer to the asphalt layer. Hence, squared waveform is
recommended in narrow asphalt layers. As the depth of asphalt is increased, it is recommended to use
haversine waveform. But in deep asphalt layers with high dynamical module ratio, it is better to use
triangular waveform.
According to Porter et al. (1975) frequency of loading in asphalt concrete is defined as number of
load cycles subjected to the material per unit of time. Investigation of the effect of loading frequency
on fatigue life of asphalt concrete mixtures is difficult because it is interconnected with the load
duration and rest period. Changing any of these variables will change the other variables. Hsu and
Tseng (1996) have studied the effects of rest period on the fatigue life of asphalt concrete using three
point bending test. They studied three different rest period ratios and concluded that rest period has
considerable effects on the asphalt fatigue life and by increasing the rest period, fatigue life of asphalt
is also increases. Kim et al. (2003b) studied the effects of rest period on fatigue life of asphalt mixtures
by using dynamic mechanical analysis test. They first applied 10 rest periods of 2 minutes to asphalt
specimens under %0.28 strain and then compared the obtained results with the tests with no rest period
and they observed that this process will improve fatigue life of asphalt mixtures. Kim et al. (2003b)

A. MansourKhaki et al. / Engineering Solid Mechanics 3 (2015)
95
mentioned that it could be one of the reasons of inconsistency between the fatigue life generated by
predictive models of fatigue life and the fatigue life of asphalt determined by field study. Deacon (1965)
studied the effects of load duration on the asphalt fatigue life while the ratio of rest period to the load
duration was fixed. He observed that fatigue life of asphalt mixtures is decreased by increasing the load
duration. Pell (1961) used bending and torsional tests to control stress and strain, respectively and then
concluded that decreasing load duration (increasing vehicle speed) will increase fatigue life in both
tests. He also mentioned that there is an inverse linear relation between the stress applied to sand-sheet
specimen and its fatigue life in the stress control test, when the specimen’s fatigue life is beyond 10000
cycles. Al-Khateeb and Ghuzlan (2014) used indirect tensile test and observed that increasing loading
frequency and decreasing stress level will increase fatigue life of asphalt mixtures. Also in higher
frequencies, decreasing loading stress level will increase the fatigue life of asphalt mixtures. Epps and
Monismith (1972) studied the effects of loading frequency by fixing load duration. They observed that
fatigue life does not change in the range of 0 to 30 rpm loading frequencies (Fakhri, 1997). Deacon
(1965) showed that if loading frequency increases from 30 to 100 rpm, fatigue life will decrease.
Raithby and Sterling (1972) studied load duration and rest period using direct tensile test. They used
two load duration of 40 and 400 ms. The rest period was varied from 0 to 1 second for the load duration
of 40 ms and from 0 to 800 ms for the load duration of 400 ms in their study. They concluded that
asphalt mixtures with load duration of 400 ms have lesser fatigue life. Also effects of rest period in
load duration of 40 ms is much more than its effects in load time of 400 ms. In the other words, rest
period effects will decrease by increasing load duration. In this research the effect of loading type (i.e.
haversinse and triangular loading waveforms) is studied experimentally on fatigue life of an asphalt
mixture. Moreover, the influence of other affecting parameters such as load duration, stress level and
rest period is investigated on the fatigue behavior of tested asphalt mixtures.
2. Research approach
To reach the objectives of this study, we first determined the optimum content of Hot Mix Asphalt
(HMA) specimens using Marshall method. Using the optimum percentages of HMA composition, a
few cylindrical shape specimens were manufactured by means of gyratory compactor machine. The air
void content of manufactured samples was determined approximately 4% which demonstrate the
validity of process used for manufacturing the asphalt samples. The specimens were then tested using
indirect tensile shape specimen by means of a universal testing machine.
2.1. Material Used
2.1.1. Aggregate
The aggregate used in this study was crushed limestone aggregate. The limestone was obtained
from Az-Chenan mine which is located near Tehran. Table 1 shows summary of physical attributes of
the used mineral aggregates. Maximum nominal aggregate size used in this study was 12.5 mm. The
aggregate gradations are presented in Fig. 1.
Table 1
Properties of aggregate
Test Standard Test Result
22/3
AASHTO T96
Los Angeles abrasion loss (%)
93 ASTM D5821 Tow fractured faces (%)
2/2
ASTM C127
Absorption coarse aggregate
2/4 ASTM C127 Absorption fine aggregate
2/59
ASTM C127
Bulk specific gravity, g/Cm3
96
Fig. 1. Gradation of used aggregate
2.1.2. Asphalt
Asphalt binder having a penetration of 60/70 was used for preparing HMA specimens which was
obtained from the Pasargad Oil Company (Tehran, Iran). Table 2 summarizes the physical properties
of the asphalt.
Table 2
Properties of asphalt binder
Test result ASTM test designation Test
1/03 ASTM D-70 Specific gravity at 25°C
64 ASTM D-5 Penetration at 25 °C
54 ASTM D-36 Softening point(°c)
102 ASTM D-113 Ductility at 25 (cm)
305 ASTM D-92 Flash point (°C)
317 ASTM D-92 Fire point (°C)
2.2. Determination Optimum Asphalt Content
The Marshall method was used for calculating the optimum percentage of asphalt content. Hence,
mineral aggregates with different percentages of asphalt binder (i.e. 4 to 6% with intervals of 0.5 %)
were mixed to obtain the optimum HMA composition. A total number of 15 specimens were tested for
investigating the stability, flow, air voids, unit weight, and voids of mineral aggregate. The optimum
asphalt content was calculated as the average of asphalt contents that meet the maximum stability,
maximum unit weight, and 4.0% air voids. The resulting optimum asphalt contents were checked to
find whether they have achieved the specification limits of the five parameters (stability, flow, air voids,
unit weight, and voids in mineral aggregate). The resulting optimum asphalt binder content was 5.1 %.
2.3. Specimens Preparation by Gyratory Compactor Machine
After obtaining the optimum asphalt content, a number of test specimens were made by a gyratory
compactor machine (based on Superpave standard). The produced specimens have approximately 100
0
20
40
60
80
100
0 0.15 0.3 0.75 2.36 4.75 9 12.5 19
% Pass
Sieve Opening (mm)
Upper
Design Gradtion
Lower
A. MansourKhaki et al. / Engineering Solid Mechanics 3 (2015)
97
mm diameter and 68 mm height. It was observed that the air voids of produced specimens are almost
4 percent which reveals the acceptability of the manufactured specimens.
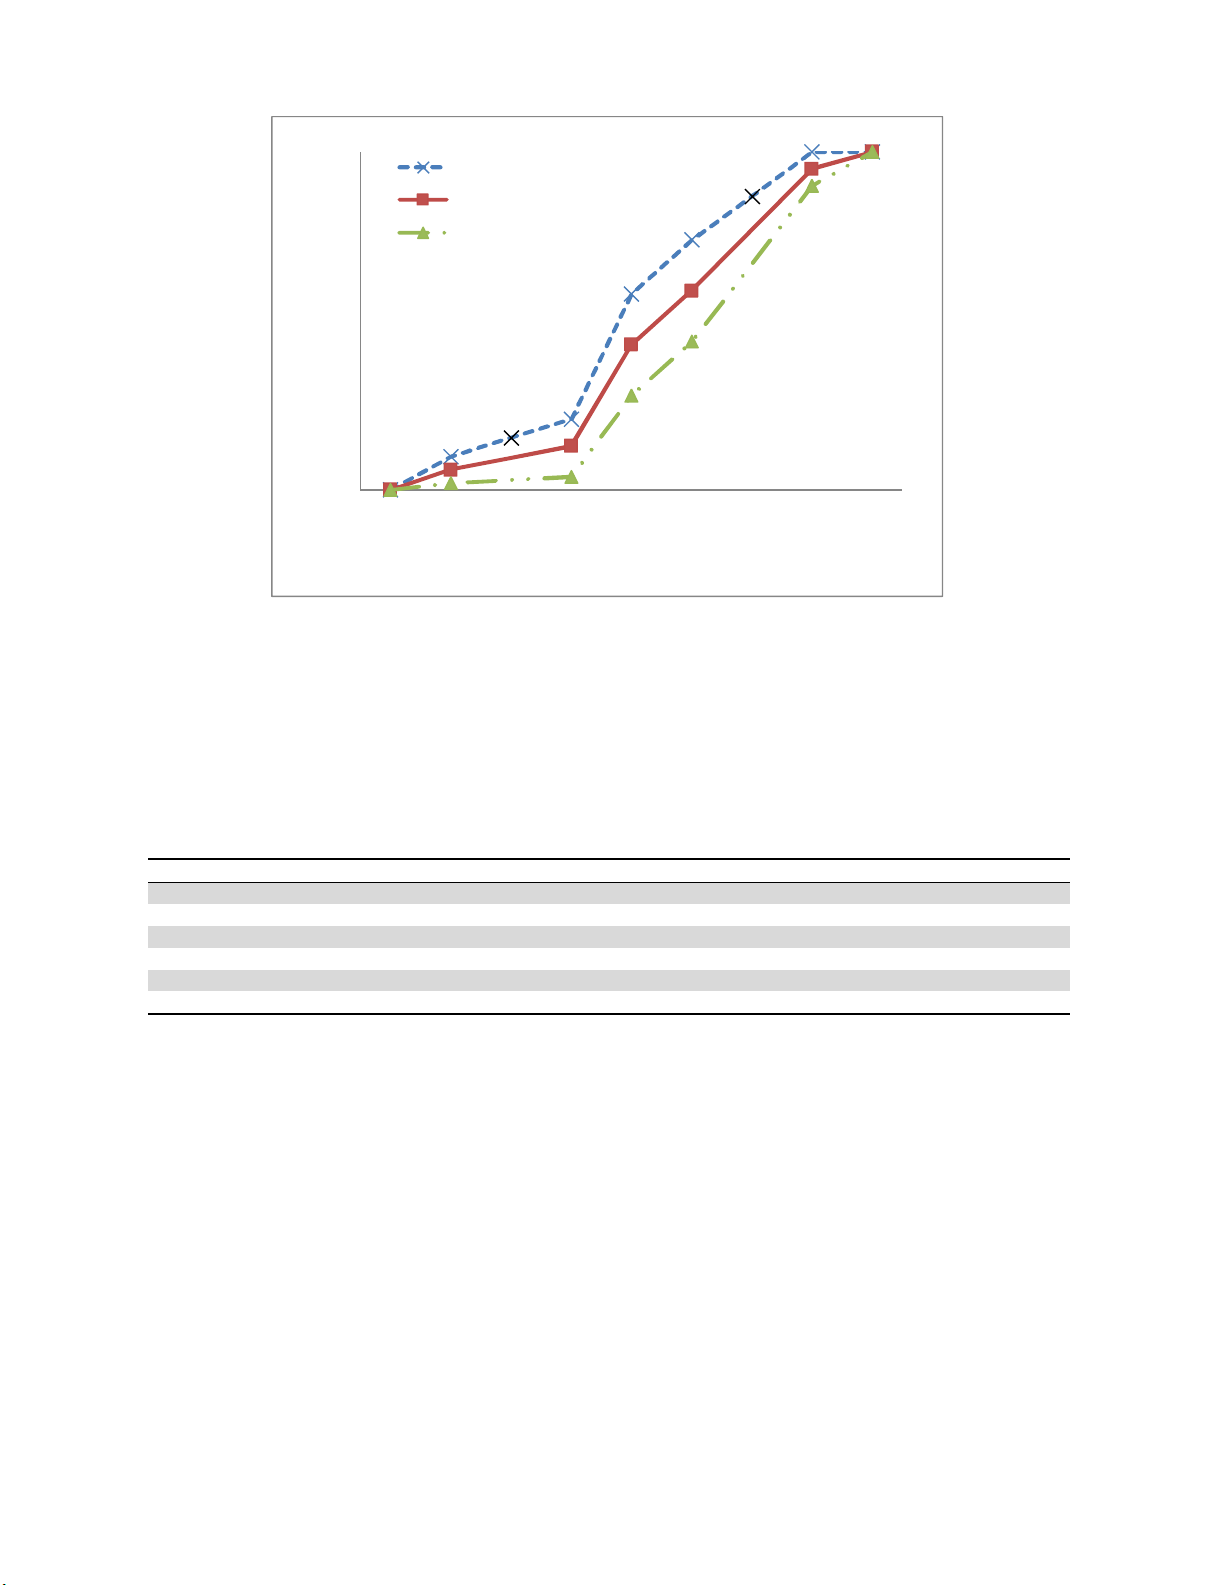
3.4. Indirect tensile fatigue test
An indirect tensile test with strain control was performed to determine the fatigue life of the
manufactured asphalt mixtures using the UTM machine. A number of loading cycles were drawn
against horizontal permanent deformation to calculate the fatigue life of specimens. Fatigue criteria
were specimen fracture or 9 mm horizontal permanent deformation (based on Khaleed (2000)
suggestion). We used two stress levels of 170 and 250 kPa, two waveforms (i.e. haversine and triangle),
three load durations of 100, 200, 400 ms, and two rest period to load duration ratios of 4 and 9. All the
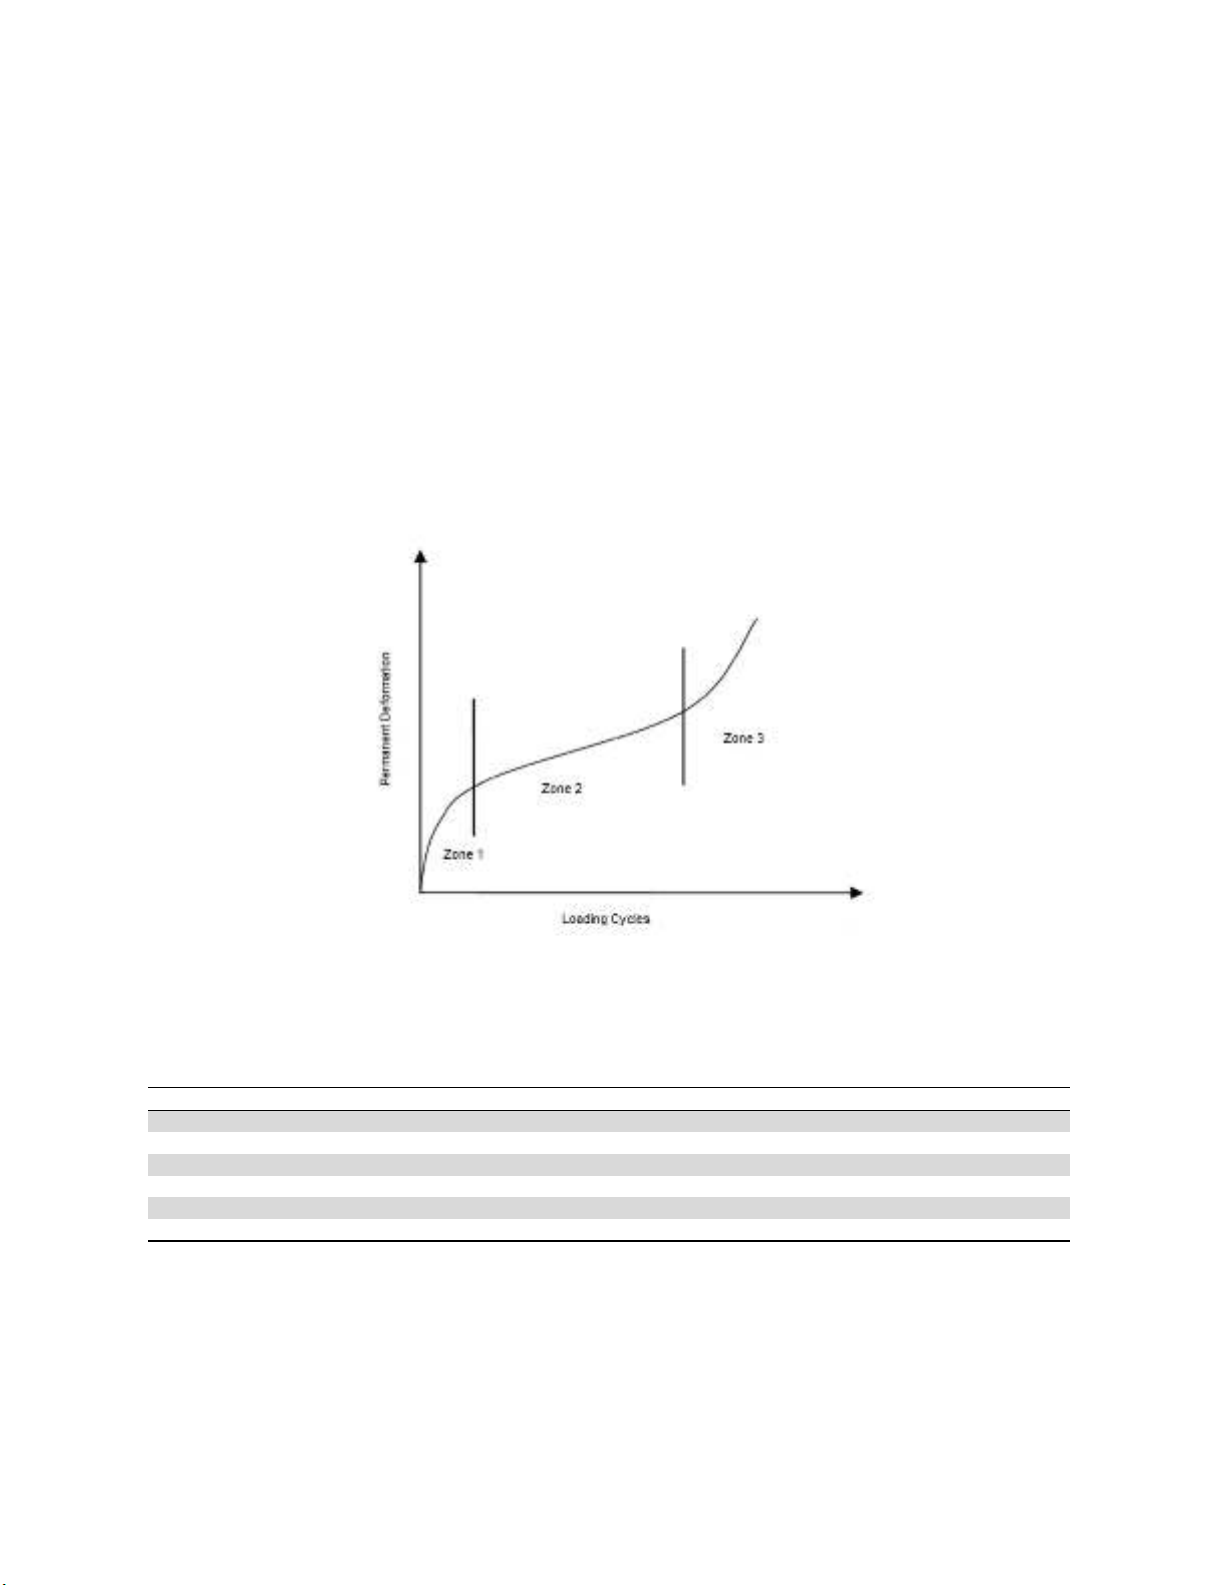
experiments were conducted at 25oC. The conducted fatigue tests showed the graph of number of
loading cycles versus horizontal permanent deformation has a general trend shown in Fig. 2. At the
zone 1, the rate of permanent deformation decreases by increasing the number of loading cycles. This
rate is constant at zone 2 and increases by the number of loading cycles at zone 3. Table 3 shows a
summary of used variables.
Fig. 2. General trend of permanent deformation based on the number of cycles observed in the
indirect fatigue test (Ameri & mansourian, 2007)
Table 3
IDT fatigue testing matrix
Value Number of conducted tests Variables (Test Condition)
Haversien & Triangle 2 Loading waveform
170 , 250 2 Stress levels (kPa)
100, 200, 400 3 load duration (ms)
4 , 9 2 rest period to load duration ratios
Three IDT fatigue specimens 3 Replicates
2*2*3*2*3=72 tests Total number of IDT fatigue tests
3. Experimental results
The main purpose of this research is to study effect of haversine and triangular waveform, rest
period and stress level on the fatigue life of asphalt mixtures. To reach this goal, we performed several
indirect tensile tests on the hot asphalt specimens, which were made by a gyratory compactor machine.
Table 4 shows summary of experimental result.


![Giáo trình Vật liệu cơ khí [mới nhất]](https://cdn.tailieu.vn/images/document/thumbnail/2025/20250909/oursky06/135x160/39741768921429.jpg)


