
EPJ Nuclear Sci. Technol. 6, 9 (2020)
c
A. Laureau et al. published by EDP Sciences, 2020
https://doi.org/10.1051/epjn/2020004
Nuclear
Sciences
& Technologies
Available online at:
https://www.epj-n.org
REGULAR ARTICLE
Uncertainty propagation for the design study of the PETALE
experimental programme in the CROCUS reactor
Axel Laureau1,*,Vincent Lamirand1,2, Dimitri Rochman2, and Andreas Pautz3
1Laboratory for Reactor Physics and Systems behaviour (LRS), Ecole Polytechnique F´
ed´
erale de Lausanne (EPFL),
1015 Lausanne, Switzerland
2Laboratory for Reactor Physics and Thermal Hydraulics (LRT), Paul Scherrer Institut (PSI), 5232 Villigen,
Switzerland
3Nuclear Energy and Safety Research Division (NES), Paul Scherrer Institut (PSI), 5232 Villigen, Switzerland
Received: 2 September 2019 / Accepted: 16 January 2020
Abstract. The PETALE experimental programme in the CROCUS reactor intends to provide integral
measurements to constrain stainless steel nuclear data. This article presents the tools and the methodology
developed to design and optimize the experiments, and its operating principle. Two acceleration techniques
have been implemented in the Serpent2 code to perform a Total Monte Carlo uncertainty propagation using
variance reduction and correlated sampling technique. Their application to the estimation of the expected
reaction rates in dosimeters is also discussed, together with the estimation of the impact of the nuisance
parameters of aluminium used in the experiment structures.
1 Introduction
Numerous integral experiments intend to improve the
knowledge on the nuclear data and their associated uncer-
tainty. Such experiments can be employed to validate
the present nuclear data libraries and numerical codes,
or can be used to improve the nuclear data libraries via
assimilation techniques. In this frame, the present work
is related to the PETALE experimental programme [1,2]
during its design phase. This programme aims at pro-
viding better constraints on the neutron cross sections
in heavy reflectors for water reactors such as the Euro-
pean Pressurized Reactor (EPR) [3,4]. It consists in a
reactivity worth and a neutron transmission experiment
in the CROCUS reactor. A stack of thick (2 cm) metal
plates interleaved with neutron detectors in the reflector.
These detectors consist of thin activation foils (<mm)
of several materials in order to use different reactions
to be sensitive to different parts of the neutron spec-
trum. Specific numerical developments have been required
and are detailed in the twin article [5] to perform the
propagation of nuclear data uncertainty on this kind of
system.
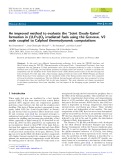
As an illustration, the 56Fe total cross section uncer-
tainty is represented in Figure 1 as the dispersion between
random ACE files from the TENDL library [6]. The
*e-mail: laureau.axel@gmail.com
discrepancy between these different random files is of
around 5–30% at high energy (bottom-right), and may
be locally very important near resonances due to the
uncertainty on the energy position of these resonances
(middle).
In order to optimize the capability of the PETALE
experimental programme to provide useful information,
the general objective is to maximize the uncertainty prop-
agation of the reflector plate cross sections on the reaction
rates in the foils. At the same time, the objective is to
minimize the impact of the uncertainties due to all the
other elements: e.g. fuel/water cross sections, core and
experiment geometry, composition. Achieving a measure-
ment with an accuracy better than the prior uncertainty
will ensure that PETALE can provide new constraints
and that the posterior uncertainty after the assimilation
process will be reduced. From the prior uncertainty prop-
agation, an estimation of the required precision on the
measurement of the reaction rates in the foils will also be
obtained.
Section 2 is devoted to the description of the experimen-
tal setup and its implementation in the Serpent2 Monte
Carlo calculation code [7]. Section 3 then describes the
variance reduction method developed to manage the low
probability that a neutron coming from the core reaches
the foils in the reflector. Finally, the nuclear data uncer-
tainty propagation with a correlated sampling approach is
presented in Section 4 to estimate the target uncertainties
to provide feedback on the nuclear data.
This is an Open Access article distributed under the terms of the Creative Commons Attribution License (http://creativecommons.org/licenses/by/4.0),
which permits unrestricted use, distribution, and reproduction in any medium, provided the original work is properly cited.
,

2 A. Laureau et al.: EPJ Nuclear Sci. Technol. 6, 9 (2020)
Fig. 1. 56Fe cross-section selected randomly form ACE files of
the TENDL2017 nuclear database (left) with a zoom on the
first resonance (middle) and in the high energy (right) regions.
The first ACE file (in red in the upper row) has been used as
reference and the variation between this file and 32 versions of
this cross section is displayed in the lower row.
2 Description of the experimental setup
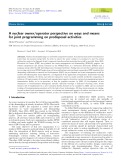
2.1 Description of the CROCUS reactor
The CROCUS reactor represented in Figure 2 is a zero
power light water reactor operated at Ecole Polytechnique
F´
ed´
erale de Lausanne (EPFL) for teaching and research
activities [1]. It is composed of two interlocked fuel zones,
with oxide uranium enriched at 1.806% in the inner zone
and metal uranium enriched at 0.947% at the periph-
ery. The maximum authorized power is 100 W. More
information on CROCUS is available in [8,9].
2.2 Description of the PETALE experimental
programme
As already mentioned, the PETALE experimental pro-
gramme aims at providing reactivity worth and a precise
characterisation of the neutron flux amplitude and spec-
tral variation in a heavy reflector materials. The in-core
device allows up to eight successive thick metal plates of
2×30 ×30 cm3interleaved with nine thin foils (dosime-
ters), one between each plate and two at the endpoints
of the device. The plates are surrounded by a hoistable
waterproof aluminium box. The foils are extracted for an
activity measurement using a High Purity Germanium
(HPGe) detection system in the reactor hall for dosimeters
with a short lifetime.
The measured activities in the different foils will char-
acterise the attenuation of the neutron flux. Associated
to various foil compositions (Au, Ag, In, etc.) and then
different cross sections (see Fig. 3), the experiment will
be sensitive to different parts of the neutron spectrum.
In this article, we focus on the example of indium foils
for which two pieces of information are available: the cap-
ture and the inelastic reactions. Both reactions induce the
emission of specific gamma ray emissions: the former pro-
vides feedback mainly in the thermal range, whereas the
latter is sensitive to the fast range only.
Fig. 2. Axial section of CROCUS represented using the Ser-
pent2 code, with the addition of the PETALE metal reflector
(top-left). The oxide uranium fuel is displayed in orange, the
metal uranium fuel in red, and the water in blue. The four cir-
cles in the water reflector are fission and ionisation chambers
used as CROCUS monitors. A zoom on the interface between
CROCUS and the metal reflector shows the first foil with a
width multiplied by 10 in order to be visible (1 g of indium for
the first foil instead of 0.1 g).
Fig. 3. Cross section of interest of different foil compositions.
A first parametric study [2] performed with the MCNP
code [10] has shown that the dimension of the plates can
be limited to 30 ×30 cm2with acceptable border effects.
In order to obtain precise data for the different isotopes
composing a heavy reflector, the measurements will be
repeated for different plate compositions: Fe, Ni, Cr, and
steel. In this paper, the results presented have been com-
puted with the iron plate composition associated to the
indium foils to illustrate the methodology and discuss the
results obtained. Further studies will be performed with
all the other configurations.
Figure 4 presents the neutron flux with a linear
scale in CROCUS and the heavy reflector plates of the
PETALE setup in the upper left region. A different pat-
tern is observed between the thermal and fast ranges.
As expected, the fast neutrons (bottom-right) are very
concentrated at the core center, and the pin positions
are observed in this case through the maximum spots
obtained. One can see that an important number of fast
neutrons go through the metal reflector due to the larger
slowing down area of iron compared to water. Concern-
ing the thermal neutrons (top-right), the pins are directly
visible through the local flux reduction. The strong flux

A. Laureau et al.: EPJ Nuclear Sci. Technol. 6, 9 (2020) 3
Fig. 4. Radial neutron flux in linear scale for different ranges:
total (top-left), thermal (top-right), epithermal (bottom-left)
and fast (bottom-right). The axial position used to score the flux
corresponds to a 10 cm width gate centered around the PETALE
device.
depletion in the reflector area is already noticeable for
this range of energy due to the neutron reflection and
absorption in iron. It is interesting to note that the ther-
mal neutron population is larger in the water behind
the experiment due to the fast neutrons that propagate
through the iron and are finally thermalised there.
3 Variance reduction in the metal reflector
In order to estimate the absorption rate inside the foils
located in the metal reflector, a variance reduction is
required in order to increase the number of thermal
neutrons simulated in the metal reflector plates. This
work has been performed with a modified version of
Serpent2 code v2.1.21 used for previous studies [11]
and where the correlated sampling technique has been
implemented [12,13]. Even if some variance reduction
methods have already been implemented in recent devel-
opments [14] of Serpent2, a specific variance reduction
has been developed in this work dedicated to applications
for detectors near to a reactor with specific treatments
according to the neutron energy. Different approaches
exist, for example using weight windows [15] and adjoint
flux [16] to drive the neutrons on a path leading to
the detectors. However in this work the main target is
the uncertainty propagation. The variance reduction is a
mandatory step but not the final objective. For this rea-
son a more straightforward approach has been developed
here whose algorithm can be improved in a future work.
3.1 Observables and figure of merit
The final parameters of interest in this study are the reac-
tion rates in the foils. As already detailed, several foil
materials will be used, characterised by different absorp-
tion or inelastic cross sections, and sensitive to different
parts of the neutron spectrum. To avoid being specific to
a foil composition, we have developed a generic variance
reduction method with an optimisation on the whole neu-
tron spectrum in the different foils and not on a specific
reaction rate.
In order to check the implementation of this algorithm,
an analog reference solution is calculated without any
variance reduction using a classic Serpent2 calculation.
Combining this reference and the result of the calculation
with the variance reduction, two results are considered:
– The residual: difference between the biased and the
reference flux in the lethargy bin, expressed in num-
ber of standard deviations (σ). The quadratic sum
of the statistical uncertainties are expected to be
between ±1 at ∼68% as a quality check.
– The figure of merit (FOM): quantification of the
‘improvement’ provided by the variance reduction.
Since the variance σ2decreases with the simulation
time t, then FOM = 1
σ2×tis constant and propor-
tional to the number of events useful for the detector.
Finally, the FOM ratio between the reduced variance
and the reference calculation is considered (large
values being better).
The two methods applied and detailed below are
directly adjusted by ‘trial and error’ runs with short cal-
culations. For this purpose, additionally to the FOM and
to the classic flux-map as represented in Figure 4, a twin
map called a raw flux map is generated without the neu-
tron weighting in the score process. For a classic neutron
weighted flux score, the summed quantity for each neu-
tron is the travelled distance multiplied by the neutron
weight (normalised by the sum of the absorptions); in this
raw flux, the neutron travelled distance is thus not nor-
malised by the neutron weight. This second map provides
useful information complementary to the FOM to answer
the question ‘where does the simulation spend time?’, the
objective being to concentrate the neutrons close to the
detectors. In order to compare these calculations, each
result presented in this Section 3 has been performed using
a 10-hour calculation on an Intel Xeon 2.2 GHz×24 cores.
3.2 Biasing methods
3.2.1 Biasing of the neutron source distribution
The first implemented method concerns the fission distri-
bution in the core, the general idea being to produce more
fissions near the experiment setup and then optimise the
variance reduction. Instead of creating the neutrons with
a distribution corresponding to the real distribution of
the fissions in the reactor, the fission neutrons are pref-
erentially created close to the metal reflector. To do so,
the fission neutron production rate is artificially increased

4 A. Laureau et al.: EPJ Nuclear Sci. Technol. 6, 9 (2020)
near the position of the experiment, and the created neu-
trons get a lower weight accordingly. This distribution is
provided by the user with two arguments: a specific posi-
tion (here the metal reflector) and a ratio (2% here). Then
the distribution of the neutron source amplification is 1
near to the reference position followed by an exponential
decrease down to 2% at the furthest position of fuel in
the core. The maximum distance is determined on the
fly during the calculation through the occurring fission
events. The ratio is taken large enough to allow some of
the neutrons to reach this portion of space, in the opposite
case the convergence of global estimate would be too slow
(such as the keff or the average energy released by fission
per source neutron).
3.2.2 Biasing based on the hit-distance to target
The second approach is a neutron biasing based on neu-
tron splitting with a duplication in n-neutrons with the
same properties (position, energy, etc.) and a conserva-
tion of the total weight. A weight map has to be provided
or estimated by the Monte Carlo code. A possible impor-
tance map is the adjoint flux, the latter coming from a
deterministic neutron calculation or from the Monte Carlo
calculation. As previously mentioned, the variance reduc-
tion is a mandatory step but not the final objective. For
this reason a straightforward approach has been developed
here.
The importance map used here is provided by the
Monte Carlo calculation itself. The algorithm is based on
a progressive learning of the minimum number of hits
required to reach the target (the foils). When a neutron
is coming from any position and reaches a foil, then the
weight map is modified by learning that the previous posi-
tion is at 1hit from the target. And iteratively, when
another neutron reaches this intermediate position, the
distance is set to +1 and so on. Finally, the whole space
has a weight corresponding to the distance to the target.
Note that for this approach, the weight map is progres-
sively built during the calculation. The user only has to
provide a maximal weight for the targets (the foils here),
this weight being adjusted after a few calculation itera-
tions. For the closest foil the weight is set to 25, and 29.8
for the furthest one (+0.6per foil).
3.2.3 Results
The following results use both neutron source distribu-
tion and hit-distance approaches. The weight field is
discretized in space (250 ×250 ×250 bins) and energy
(12 lethargy bins – one per decade). There is no angular
discretisation yet, although this feature would be inter-
esting for a better biasing of the fast neutrons. The map
field is represented in Figure 5 with the obtained flux in
the reactor.
The weight map (first line of Fig. 5) show that the
fast component (right) travels a larger distance than the
thermal one (left). Note that the thermal weight increases
on the boundary of the metal reflector. This is due to
the thermal neutrons that might reach the foils in a very
Fig. 5. Weight map (top) for 0.1 to 1 meV (left) and 0.1 to
1 MeV (right) neutrons, together with the raw thermal (E <
0.3eV) and fast (E > 0.1eV) flux represented with a logarithmic
scale (second line) and linear scale (third line), and finally the
weighted flux in the core (last line).
limited number of hits with a streaming effect between
the metal plates.
The raw flux maps (lines 2 and 3) show that the amount
of simulated neutrons is much larger near the experiment.
Fast neutrons are focused in the foil direction. Compared
to the weighted flux (real flux), the amount of thermal
neutrons is two orders of magnitude larger (orange versus
light blue).
Thanks to the larger number of neutrons simulated in
the region of interest, a better statistical convergence is
obtained as illustrated in Figure 6. This figure presents
the reference (no variance reduction) and the optimised
neutron spectra, together with the residual and the FOM.

A. Laureau et al.: EPJ Nuclear Sci. Technol. 6, 9 (2020) 5
Fig. 6. Neutron flux using a color gradient from blue to red
when increasing the radial position of the dosimeter: without
biasing as reference (top), with biasing (2nd line), residual (3rd
line) and figure of merit (last line) with the average in black.
The impact of the variance reduction method is directly
visible by comparing the two first plots of Figure 6. The
residual showed for all the different volumes is centered
around zero. The fraction of events located out of ±1σ
is equal to 65% for the energies larger than 0.03 meV,
meaning that the results are normally distributed (68%
expected for a pure statistical noise). In the energy range
below 0.03 meV (under the thermal peak), the fraction of
events out of ±1σis around 35%. The difference between
the residual values and a normal distribution is actually
decreasing with the calculation time: the statistical uncer-
tainty is not correctly estimated with a low number of
events in the foils. Note that some points seem to be not
perfectly normally distributed. Only 92% of the residuals
are contained in 2σ. If we focus on the residual at 10 keV
for the foil number 6 (the orange point), the correspond-
ing value is 4.1 σ, which is a large value even if possible
with a low apparition frequency. If we focus on this point,
and the previous one for comparison, the convergence of
the flux value is plotted in Figure 7.
On the reference calculation of Figure 7 with an extra
calculation time (not used for Fig. 6), we can see that
Fig. 7. Neutron flux estimation as a function of the calculation
time, for the specific bin with a residual of 4.13 at 10 h (bot-
tom) and another bin for comparison (top). The red curve is the
reference calculation without biasing, and the blue curve is the
result with the biasing.
the final red curve is much closer to the blue one: the
residual reduces from 4.1 to 2.7 σ. An important element
highlighted by this figure is that the reference flux value
increases by successive gaps. These gaps correspond to
specific batches where a neutron succeeds to reach the foil.
There is no neutron in most of the batches. For this reason,
the standard deviation is not correctly estimated because
of the law of large number assumption in its estimation,
even if the average value is correct.
Finally, concerning the FOM distribution (Fig. 6 bot-
tom) we observe that, thanks to biasing, the variance is
one order of magnitude smaller in the fast and epithermal
regions. Moreover, the FOM reaches a factor of 50 in the
thermal region of the spectrum for the foils located deep
inside the metal reflector: the reference spectrum (top)
is much more noisy for the yellow-orange curves at the
energy of the thermal bump.
4 Uncertainty propagation and data
assimilation principle
To optimise the quality of the experimental data that will
be obtained with the PETALE experiment, a necessary
but not sufficient condition is that the uncertainty prop-
agation shows a larger impact from the nuclear data than
the measurement uncertainty. In order to have this suffi-
cient condition, the first step is the quantification of the
propagation of nuclear data uncertainty.
4.1 Total Monte Carlo
The nuclear data uncertainty is expressed as a set of
sampled cross sections with the TENDL2017 library (see
Fig. 1). Each random cross section is associated to an


![Đề ôn tập cuối kỳ môn Kỹ thuật nhiệt - Nhiệt động học [mới nhất]](https://cdn.tailieu.vn/images/document/thumbnail/2026/20260310/hoaphuong0906/135x160/60681773197823.jpg)

![Bài giảng thang máy và thang cuốn: Tổng hợp kiến thức [chuẩn nhất]](https://cdn.tailieu.vn/images/document/thumbnail/2026/20260310/hoaphuong0906/135x160/41471773283876.jpg)
