
Open Access
Available online http://ccforum.com/content/9/3/R266
R266
Vol 9 No 3
Research
In vivo validation of the adequacy calculator for continuous renal
replacement therapies
Zaccaria Ricci1, Gabriella Salvatori2, Monica Bonello3, Tirak Pisitkun4, Irene Bolgan5,
Giuseppe D'Amico6, Maurizio Dan7, Pasquale Piccinni7 and Claudio Ronco8
1Consultant, Department of Intensive Care, Policlinico Umberto I, Rome, Italy
2Research fellow, Department of Nephrology, St Bortolo Hospital, Vicenza, Italy
3Specialist registrar, Department of Nephrology, St Bortolo Hospital, Vicenza, Italy
4Research fellow, Department of Nephrology, St Bortolo Hospital, Vicenza, Italy
5Statistician, Department of Nephrology, St Bortolo Hospital, Vicenza, Italy
6Research fellow, Department of Intensive Care, Policlinico Umberto I, Rome, Italy
7Head, Department of Intensive Care, St Bortolo Hospital, Vicenza, Italy
8Head, Department of Nephrology, St Bortolo Hospital, Vicenza, Italy
Corresponding author: Zaccaria Ricci, z.ricci@libero.it
Received: 23 Sep 2004 Revisions requested: 19 Oct 2004 Revisions received: 22 Feb 2005 Accepted: 14 Mar 2005 Published: 7 Apr 2005
Critical Care 2005, 9:R266-R273 (DOI 10.1186/cc3517)
This article is online at: http://ccforum.com/content/9/3/R266
© 2005 Ricci et al.; licensee BioMed Central Ltd.
This is an Open Access article distributed under the terms of the Creative Commons Attribution License (http://creativecommons.org/licenses/by/
2.0), which permits unrestricted use, distribution, and reproduction in any medium, provided the original work is properly cited.
Abstract
Introduction The study was conducted to validate in vivo the
Adequacy Calculator, a Microsoft Excel-based program,
designed to assess the prescription and delivery of renal
replacement therapy in the critical care setting.
Methods The design was a prospective cohort study, set in two
intensive care units of teaching hospitals. The participants were
30 consecutive critically ill patients with acute renal failure
treated with 106 continuous renal replacement therapies
(CRRT). Urea clearance computation was performed with the
Adequacy Calculator (KCALC). Simultaneous blood and effluent
urea samples were collected to measure the effectively
delivered urea clearance (KDEL) at the beginning of each
treatment and, during 73 treatments, between the 18th and
24th treatment hour. The correlation between 179 computed
and 179 measured clearances was assessed. Fractional
clearances for urea were calculated as spKt/V (where sp
represents single pool, K is clearance, t is time, and V is urea
volume of distribution) obtained from software prescription and
compared with the delivered spKt/V obtained from empirical
data.
Results We found that the value of clearance predicted by the
calculator was strongly correlated with the value obtained from
computation on blood and dialysate determination (r = 0.97)
during the first 24 treatment hours, regardless of the renal
replacement modality used. The delivered spKt/V (1.25) was
less than prescribed (1.4) from the Adequacy Calculator by
10.7%, owing to therapy downtime.
Conclusion The Adequacy Calculator is a simple tool for
prescribing CRRT and for predicting the delivered dose. The
calculator might be a helpful tool for standardizing therapy and
for comparing disparate treatments, making it possible to
perform large multi-centre studies on CRRT.
Introduction
Acute renal failure (ARF), as a component of the multiple organ
failure syndrome, affects morbidity and mortality in critically ill
patients [1]. This is still the case even though several aspects
of medical care and applied technology in ARF were improved.
Much development in renal replacement therapy (RRT) is
ongoing, concerning new techniques, new membranes, and
new integrated equipment. However, it is still unclear whether
a correlation between treatment dose and outcome exists and
no consensus has been reached on how much treatment is
ARF = acute renal failure; CRRT = continuous renal replacement therapy; CVVH = continuous veno-venous hemofiltration; CVVHD = continuous
veno-venous hemodialysis; CVVHDF = continuous veno-venous hemodiafiltration; K = clearance; KCALC = calculator-estimated urea clearance; KDEL
= delivered clearance evaluated from urea concentrations on simultaneous blood and effluent samples; RRT = renal replacement therapy; spKt/V =
single pool fractional clearance for urea;t = time; V = urea volume of distribution.

Critical Care Vol 9 No 3 Ricci et al.
R267
adequate [2,3]. A long-term, large-scale, multi-center study to
determine how the outcome of critically ill patients is affected
by RRT dose and modality (intermittent or continuous, diffusive
or convective) is still lacking [4,5]. This is in part due to the
complexity of data collection and to the variety of existing
standards in RRT prescription and dose evaluation.
We tested a computer program called 'Adequacy Calculator
for ARF', a simple and manageable tool designed to prescribe
RRT dose and to collect information about the quantity of
delivered treatments. Pisitkun and colleagues [6] have
described this Microsoft excel based program and its algo-
rithms in a previous paper. Once the required parameters are
entered, it calculates urea clearance and fractional clearance,
spKt/V (sp = single pool; K = clearance, t = time, V = urea vol-
ume of distribution) for each continuous RRT (CRRT)
modality.
Materials and methods
We prospectively collected data from 106 consecutive contin-
uous renal replacement treatments administered to 30
patients with acute renal failure in the intensive care unit of St
Bortolo Hospital and Policlinico Umberto I in the period from
March 2003 to November 2004. The decision to start and to
withdraw RRT, anticoagulation and prescription of net ultrafil-
tration rate were left to institutional protocols (Table 1).
Treatments were delivered at different modalities and machine
settings depending on the preference of the prescribing
physician, but a final spKt/V of 1.4 had to be prescribed by
means of the Adequacy Calculator. The plasma filtration frac-
tion, in the case of postfilter reinfusion of replacement solution,
was kept below 20%. By protocol, filters were changed after
24 hours of treatment, or earlier if clotting occurred. The avail-
able membranes were Diacap α (1.2 m2, polysulphone, B
Braun) and Aquamax HF 12 (1.2 m2; polyethersulphone;
Edwards Lifescience) for 59 and 47 treatments respectively.
Sixty-four treatments were performed with bicarbonate-buff-
ered replacement and dialysate fluids, and 42 with lactate-
buffered fluids. Daily operative treatment times and downtimes
were reported. Intermittent treatments were excluded from the
analysis.
The Adequacy Calculator estimated urea clearance (KCALC)
for each different modality and machine setting (Additional file
1). The calculator estimation is founded on the assumption
that urea sieving coefficient is equal to unity for convective
therapies; at the same time the calculator assumes that com-
plete saturation of spent dialysate occurs under continuous
veno-venous hemodialysis (CVVHD) conditions.
To correlate KCALC with effectively delivered instantaneous
urea clearance (KDEL), simultaneous samples from prefilter
blood and effluent were collected during each treatment, to
measure urea concentration; 106 blood and 106 effluent sam-
ples were withdrawn during the first hour from the start of
RRT; 73 blood-effluent samples were withdrawn between the
18th and 24th hours (in 33 cases treatment was stopped
before the 18th hour). KDEL was calculated as described in
Additional file 1. One hundred and six KDEL values at treatment
start (T0) and 73 values after 18 to 24 hours of treatment (T18)
were correlated with 106 and 73 KCALC values obtained for the
same treatments.
The calculator prescribed spKt/VCALC after KCALC, the
expected treatment time and patient's body weight (for
assessment of urea volume of distribution, V; Fig. 1) had been
entered. spKt/VDEL was calculated from KDEL, V and effective
operative treatment times (Additional file 1).
Statistical analysis
Statistical analysis was performed with the SPSS 11.5 soft-
ware package. Data are reported as means ± standard devia-
tion (SD). Correlations between estimated and measured urea
clearance were performed with the Pearson correlation coeffi-
cients (r). spKt/V, KCALC and KDEL have no normal distribution,
so we used a Mann-Whitney test (between two samples) or a
Kruskal-Wallis test (between three or more samples) to
indicate whether groups had different locations. P < 0.05 was
considered statistically significant.
Results
A total of 106 RRTs administered to 30 patients were ana-
lysed with the Adequacy Calculator. An average of 3.5 treat-
ment days was examined for each patient. Nineteen post-
dilution continuous veno-venous hemofiltrations (CVVHs), 23
pre-dilution CVVHs, 23 CVVHDs and 41 post-dilution contin-
uous veno-venous hemodiafiltrations (CVVHDF) were pre-
scribed. The duration of each treatment was 17 ± 6 hours. The
daily operative treatment time was 20 ± 3 hours with a down-
time of 3 ± 2 hours. Thirty-three treatments lasted less than 18
hours (16 CVVH and 17 CVVHD); 73 treatments lasted more
than 18 hours (26 CVVH, 6 CVVHD and 41 CVVHDF). Exam-
ined clearances ranged from 15 ml min-1 to 100 ml min-1 (Table
2), this wide range being explained by variability in patients'
weights and prescribed treatment times: because the pre-
scribed spKt/VCALC was maintained at a constant 1.4, a 35 kg
patient treated for 24 hours with a KCALC of 20 ml min-1
obtained the same fractional clearance as a 98 kg patient dia-
lyzed for 12 hours with a KCALC of 100 ml min-1.
The difference between KDEL and KCALC was -1.75 ± 5.9 ml
min-1. Applying a Pearson correlation we obtained r = 0.97; a
significant (P = 0.022) decrease in calculator accuracy in pre-
dicting effectively delivered clearance was obtained when
data from the KCALC < 60 ml min-1 subgroup (r = 0.95) were
compared with data from the KCALC > 60 ml min-1 subgroup (r
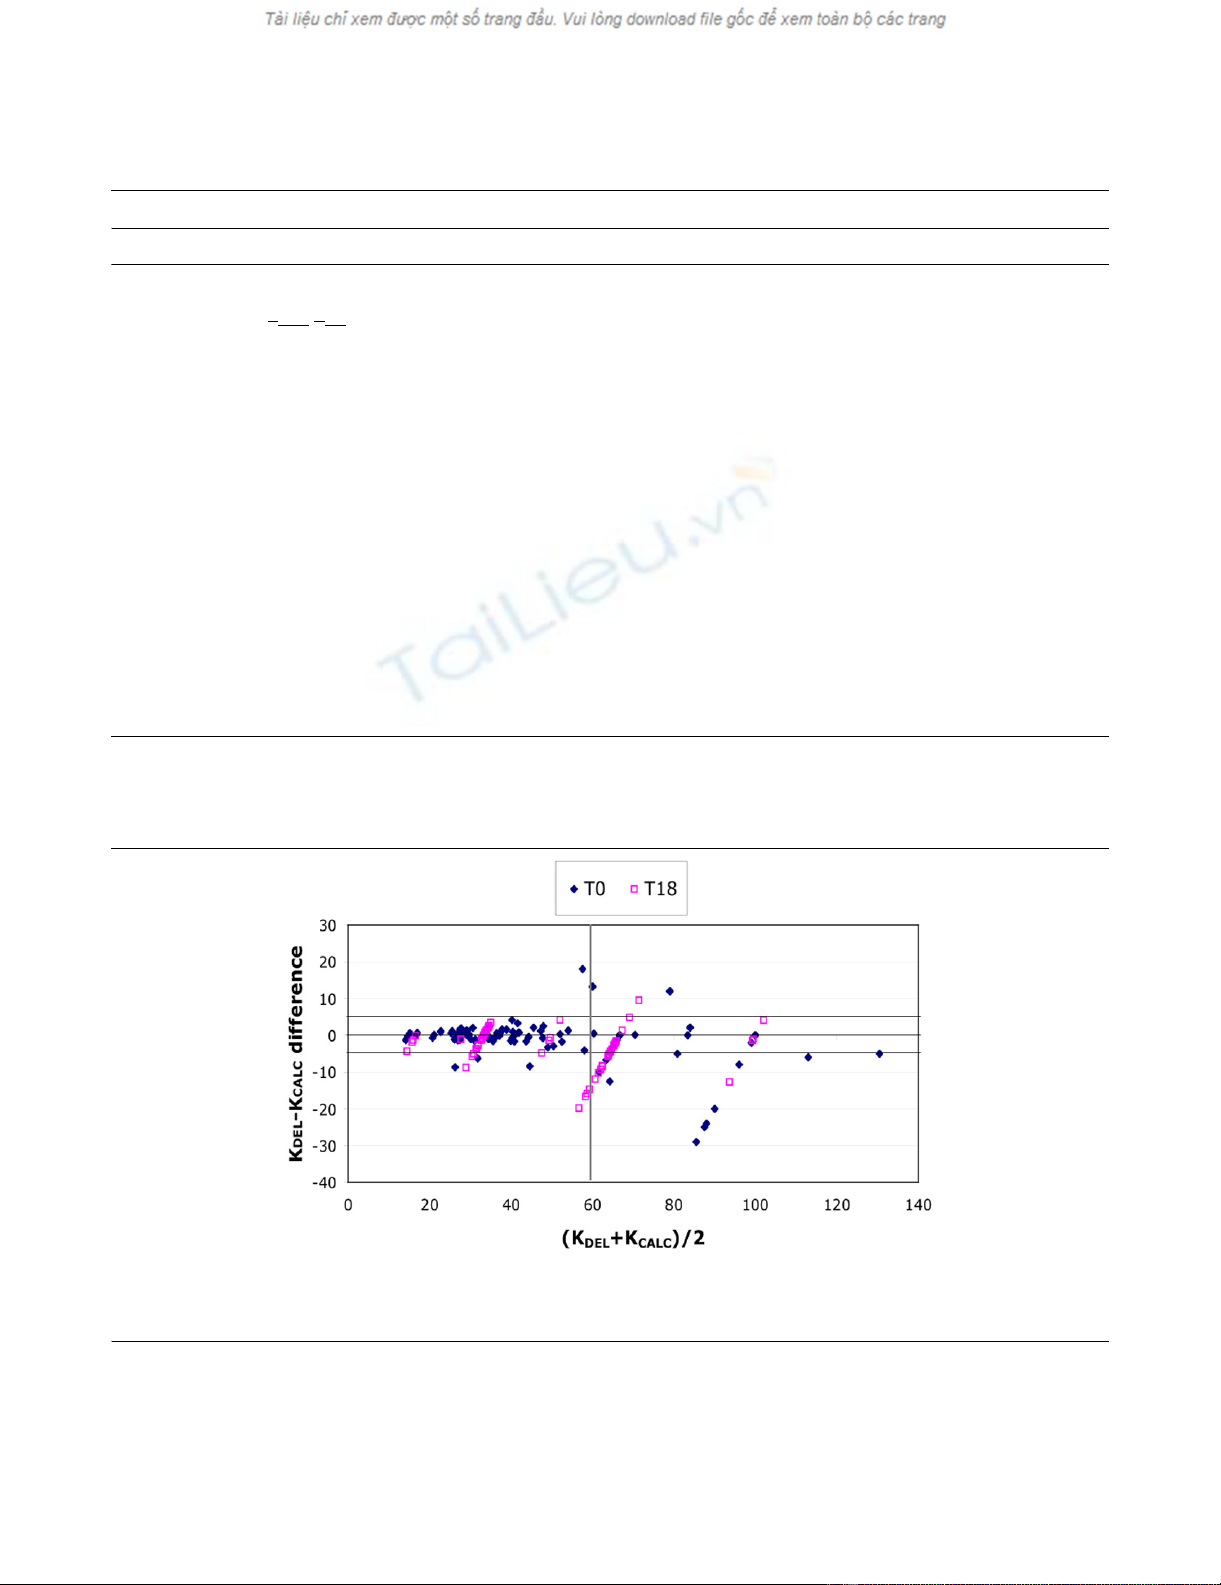
= 0.89). A Bland-Altman analysis (Fig. 2) confirmed high cor-
relation: this result was particularly evident up to an average
clearance ([KDEL + KCALC]/2) of 60 ml min-1, with the KDEL -
KCALC difference never exceeding a standard deviation of 5.9

Available online http://ccforum.com/content/9/3/R266
R268
ml min-1, whereas for [KDEL + KCALC]/2 > 60 ml min-1, the KDEL
- KCALC difference tended to increase. However, we found that
155 of 179 (87%) KDEL values fell within a ± 15% KCALC error:
in 5 cases the calculator underestimated, and in 19 overesti-
mated, the delivered clearance. No significant KDEL - KCALC dif-
ference was observed when T0 and T18 clearances were
analysed (P = 0.54) and no significant difference (P = 0.394)
was observed when KCALC > 60 ml min-1 in the T0 subgroup
and KCALC > 60 ml min-1 in the T18 subgroup were analyzed:
calculator accuracy was not affected by filter lifespan (Table
3).
After analysis of each modality group, correlations were still
high: rCVVHpre = 0.96, rCVVHpost = 0.96, rCVVHD = 0.97 and rCV-
VHDF = 0.98 (Fig. 3), with no significant difference between
groups (P = 0.099) (Table 3).
Membrane type did not affect the KDEL - KCALC correlation: r
obtained for Diacap M and Aquamax HF 12 were 0.96 and
0.97 respectively (P = 0.1).
The average spKt/VDEL obtained during our treatments was
1.25 ± 0.6; the delivered/prescribed ratio was 0.89 (Table 3);
the delivered fractional clearance was significantly less than
the prescribed spKt/VCALC of 1.4 (P = 0.045).
Table 1
Characteristics of patients
Parameter Value (mean ± SD; range)
Total no. of patients 30
Age (years) 58 ± 12
Weight (kg) 73.7 ± 15.7 (35–105)
SAPS II score 38 ± 12
No. of evaluated treatments 106
Examined treatment days 3.5 ± 1.1
Prescribed spKt/V1.4
Diagnosis
Sepsis/septic shock 8
Bowel perforation 3
Aortic aneurysm repair 3
Pneumonia 5
Hemorrhagic shock 2
Pancreatitis 1
Multiple trauma 5
Cardiogenic shock 3
Urine output at RRT start (ml per 24 h) 150 ± 70
Urea levels at RRT start (mg dl-1) 124 ± 55
Urea levels after 24 h from RRT start (mg dl-1) 98 ± 50
Urea levels at RRT withold 68 ± 53
Creatinine levels at RRT start (mg dl-1)2.9 ± 0.9
Creatinine levels after 24 h from RRT start (mg dl-1) 2.4 ± 1.25
Creatinine levels at RRT withold 1.8 ± 0.6
No. of patients receiving heparin < 500 U h-1 12
No. of patients receiving heparin > 500 U h-1 11
No. of patients receiving no anticoagulation 7
RRT, renal replacement therapy; SAPS II, Systems Approach Problem Solver II.
Critical Care Vol 9 No 3 Ricci et al.
R269
Discussion
Ideal marker molecules and performance parameters to com-
pare treatment dose in different techniques are difficult to
establish. In spite of its moderate toxicity, urea is currently
used as a marker of RRT adequacy because it is easily meas-
urable and, representing the end of protein metabolism, its
accumulation during kidney failure defines the requirement for
dialysis while its elimination defines the efficiency of treatment.
Because urea is equally distributed at steady state in body
water compartments, its volume of distribution (V) equals total
body water. Urea is therefore a surrogate of the low-molecular-
mass toxins. In chronic hemodialysis, the treatment dose of
RRT is defined as a fractional clearance, Kt/V, where K is the
instantaneous clearance, t is treatment time and V is the vol-
ume of distribution of the marker molecule. This is a dimension-
less parameter that represents the efficacy of treatments, and
allows comparison between different therapies and among dif-
ferent patients. In fact, different instantaneous clearances, rep-
resenting treatment efficiency, can yield comparable results in
terms of efficacy only if correlated with treatment time and the
patient's total body water. A Kt/V value of 1.2 is an established
maker of adequacy that has been shown to be correlated with
morbidity and mortality in patients with end-stage kidney dis-
ease [7-11]. Kt/V has not yet been validated as a marker of
adequacy in patients with acute renal failure, but it seems that
a good rationale exists for its use in continuous therapies. The-
oretically, in its original conception, clearance was thought to
evaluate renal function of disparate individuals whose kidneys
were operating 24 hours per day and blood levels were at
steady state. Similarly, after some days of CRRT, patients' urea
levels approach a real steady state (never obtained with inter-
mittent dialysis) and post-dialysis rebound is not present. It is
thus reasonable to consider urea distribution volume as in a
single-pool kinetic model (spKt/V).
Recently, Brause and colleagues [12] stated that spKt/V is a
valuable tool for evaluating continuous hemofiltration, and
higher values (0.8 versus 0.53) were correlated to improve
uremia control and acid–base balance. Ronco and colleagues
[2] showed an improved outcome with postdilution hemofiltra-
tion delivered at 35 ml h-1 kg-1 in a 450-patient population. Set-
ting a spKt/V threshold that could guide clinicians towards
adequate treatments, we should possibly meet the target of 35
ml h-1 kg-1, which, delivered as a 24-hour treatment, may trans-
late into a spKt/V of 1.4 independently of the RRT modality.
We found that the Adequacy Calculator was able to predict
the delivered urea clearance accurately, regardless of which
CRRT modality was selected; the correlation between predic-
tion and effective delivery remained high over a time range of
24 hours. When clearances above 60 ml min-1 were pre-
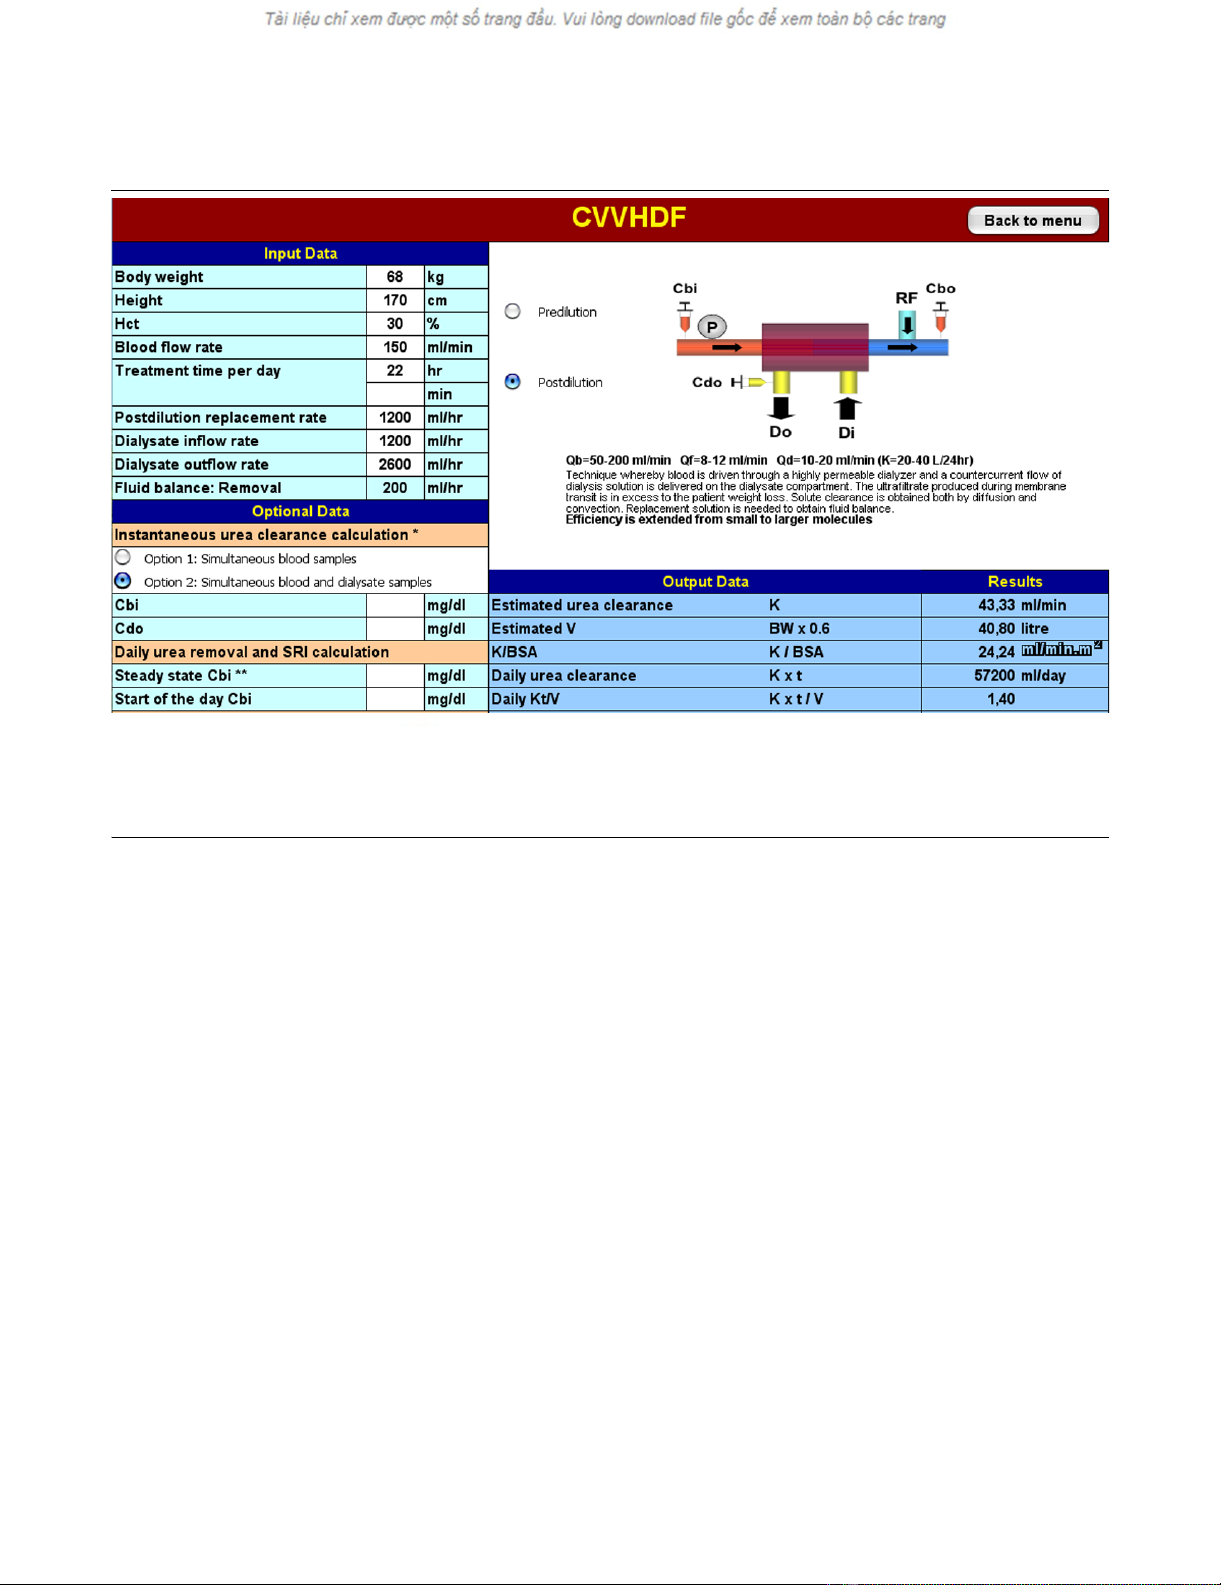
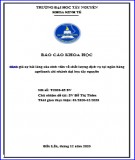
Figure 1
An Adequacy Calculator worksheet: continuous veno-venous hemodiafiltration (CVVHDF) is delivered in a 70 kg patientAn Adequacy Calculator worksheet: continuous veno-venous hemodiafiltration (CVVHDF) is delivered in a 70 kg patient. Post-dilution mode is
selected, machine settings and prescribed treatment time per day are entered on the upper left panel: estimated urea clearance (KCALC) and 'daily
Kt/V' (spKt/VCALC) are displayed on the right. In the lower left panel it is possible to obtain KDEL measure after entering prefilter blood (Cbi) and efflu-
ent (Cdo) urea concentration: in this case, when operative times are entered, 'daily Kt/V' cell displays effectively delivered fractional clearance (spKt/
VDEL).
Available online http://ccforum.com/content/9/3/R266
R270
scribed, the calculator showed a tendency to overestimate
effective clearances: this overestimation remained generally
within an error of 15%.
Considering our results and the dissociation between treat-
ment delivery and calculator estimation when high clearances
are involved, as could occur with low-efficiency extended dial-
ysis or high-volume hemofiltration, a slight correction to
Table 2
Treatments characteristics
Parameter Value
No. of treatments 106
Total no. of examined KCALC/KDEL(ml min-1) 179 (106 T0; 73 T18)
CVVHpost 38 (19 T0; 19 T18)
CVVHpre 30 (23 T0; 7 T18)
CVVHD 29 (23 T0; 6 T18)
CVVHDF 82 (42 T0; 42 T18)
Total prescribed KCALC (ml min-1) 48.6 ± 24; 18–100
CVVHpost 35.6 ± 16; 16–66
CVVHpre 48.8 ± 19; 15–83
CVVHD 56.2 ± 28; 20–100
CVVHDFa52.2 ± 24; 23–100
Total prescribed net UF (ml h-1) 250 ± 100; 0–500
Treatment hours per day 20 ± 3; 8.5–24
Treatment hours per run 17 ± 6; 5–24
Downtime (hours) 3 ± 2
aDuring continuous veno-venous hemodiafiltration (CVVHDF) modality, prescribed clearance was delivered with even hemofiltration and
hemodialysis flow rates. Where errors are given, results are means ± SD; ranges follow a semicolon. CVVH, continuous veno-venous
hemofiltration; CVVHD, continuous veno-venous hemodialysis; KCALC, calculator-estimated urea clearance; KDEL, delivered clearance evaluated
from urea concentrations on simultaneous blood and effluent samples; T0, at therapy start; T18, after 18 to 24 hours of uninterrupted therapy.
Figure 2
Bland–Altman correlation between urea clearance obtained by two methods: urea clearance calculated with the described software (KCALC) and urea clearance obtained by direct measure on prefilter blood and effluent samples (KDEL)Bland–Altman correlation between urea clearance obtained by two methods: urea clearance calculated with the described software (KCALC) and
urea clearance obtained by direct measure on prefilter blood and effluent samples (KDEL). It is possible to distinguish the correlations between KCALC
and KDEL, at therapy start (T0) and after 18 to 24 hours of uninterrupted therapy (T18).


%20--%3e%3cdefs%3e%3cstyle%3e%20.st0%20{%20fill:%20%23fff;%20}%20.st1%20{%20fill:%20%237800fa;%20}%20%3c/style%3e%3c/defs%3e%3cpath%20class='st1'%20d='M117.78,12.18H43.11c2.9,3.47,4.65,7.94,4.65,12.82,0,5.6-2.3,10.66-6.01,14.29h76.02l7.22-13.56-7.22-13.56Z'/%3e%3cg%3e%3cpath%20class='st0'%20d='M53.58,26.17h-.59v-1.46h.59v-4.96h2.83c1.78,0,2.67.94,2.67,2.82v5.76c0,1.87-.89,2.81-2.67,2.81h-2.83v-4.96ZM55.36,21.37v3.34h1.1v1.46h-1.1v3.34h1.01c.61,0,.91-.37.91-1.1v-5.93c0-.74-.3-1.1-.91-1.1h-1.01Z'/%3e%3cpath%20class='st0'%20d='M65.99,31.14h-1.8l-.31-2.07h-2.19l-.31,2.07h-1.64l1.82-11.39h2.62l1.82,11.39ZM65.28,18.04c-.25.46-.51.77-.75.94-.21.15-.47.22-.79.22-.26,0-.57-.07-.92-.22l-.38-.15c-.14-.05-.26-.07-.37-.07-.3,0-.53.18-.71.54l-.91-.68c.25-.46.51-.77.75-.94.21-.14.48-.21.79-.21.26,0,.57.07.92.21l.38.15c.14.05.26.07.37.07.3,0,.53-.18.71-.54l.91.68ZM61.91,27.52h1.73l-.87-5.76-.87,5.76Z'/%3e%3cpath%20class='st0'%20d='M74.53,26.89v1.52c0,1.91-.89,2.86-2.67,2.86s-2.67-.95-2.67-2.86v-5.93c0-1.91.89-2.86,2.67-2.86s2.67.95,2.67,2.86v1.11h-1.69v-1.22c0-.75-.31-1.12-.93-1.12s-.93.37-.93,1.12v6.15c0,.74.31,1.11.93,1.11s.93-.37.93-1.11v-1.63h1.69Z'/%3e%3cpath%20class='st0'%20d='M81.4,31.14h-1.8l-.31-2.07h-2.19l-.31,2.07h-1.64l1.82-11.39h2.62l1.82,11.39ZM75.9,19.2l1.52-1.91h1.71l1.51,1.91h-1.61l-.76-.95-.75.95h-1.61ZM77.32,27.52h1.73l-.87-5.76-.87,5.76ZM83.1,15.99l-1.76,1.91h-1.26l1.17-1.91h1.86Z'/%3e%3cpath%20class='st0'%20d='M84.86,19.75c1.78,0,2.67.94,2.67,2.82v1.48c0,1.87-.89,2.81-2.67,2.81h-.85v4.28h-1.79v-11.39h2.64ZM84.01,21.37v3.86h.85c.58,0,.87-.36.87-1.08v-1.71c0-.71-.29-1.07-.87-1.07h-.85Z'/%3e%3cpath%20class='st0'%20d='M93.51,19.75c1.78,0,2.67.94,2.67,2.82v1.48c0,1.87-.89,2.81-2.67,2.81h-.85v4.28h-1.79v-11.39h2.64ZM92.66,21.37v3.86h.85c.58,0,.87-.36.87-1.08v-1.71c0-.71-.29-1.07-.87-1.07h-.85Z'/%3e%3cpath%20class='st0'%20d='M98.8,31.14h-1.79v-11.39h1.79v4.88h2.03v-4.88h1.83v11.39h-1.83v-4.88h-2.03v4.88Z'/%3e%3cpath%20class='st0'%20d='M105.36,24.55h2.46v1.62h-2.46v3.34h3.09v1.63h-4.88v-11.39h4.88v1.63h-3.09v3.18ZM108.17,17.29l-1.76,1.91h-1.26l1.17-1.91h1.86Z'/%3e%3cpath%20class='st0'%20d='M112.2,19.75c1.78,0,2.67.94,2.67,2.82v1.48c0,1.87-.89,2.81-2.67,2.81h-.85v4.28h-1.79v-11.39h2.64ZM111.35,21.37v3.86h.85c.58,0,.87-.36.87-1.08v-1.71c0-.71-.29-1.07-.87-1.07h-.85Z'/%3e%3c/g%3e%3ccircle%20class='st1'%20cx='25'%20cy='25'%20r='20'/%3e%3cpath%20class='st0'%20d='M32.78,19.27c2.92,0,4.43,2.55,5.28,5.33l.71,2.17c.14.38-.33.75-.71.75h-5.61c.19-.33.24-.71.09-1.08l-.75-2.45c-.43-1.32-.99-2.64-1.79-3.77.75-.57,1.65-.94,2.78-.94h0ZM25,18.38c3.25,0,4.9,2.78,5.89,5.89l.76,2.45c.14.42-.33.8-.8.8h-11.69c-.42,0-.94-.38-.8-.8l.75-2.45c.99-3.11,2.64-5.89,5.89-5.89h0ZM25,11.35c1.74,0,3.11,1.37,3.11,3.11s-1.37,3.11-3.11,3.11-3.11-1.41-3.11-3.11,1.41-3.11,3.11-3.11h0ZM17.27,19.27c1.08,0,1.98.38,2.73.94-.8,1.13-1.37,2.45-1.74,3.77l-.8,2.45c-.14.38-.05.75.09,1.08h-5.56c-.42,0-.9-.38-.75-.75l.71-2.17c.9-2.78,2.41-5.33,5.33-5.33h0ZM17.27,12.91c1.51,0,2.78,1.27,2.78,2.83s-1.27,2.83-2.78,2.83-2.83-1.27-2.83-2.83,1.27-2.83,2.83-2.83h0ZM32.78,12.91c1.56,0,2.78,1.27,2.78,2.83s-1.23,2.83-2.78,2.83-2.83-1.27-2.83-2.83,1.27-2.83,2.83-2.83h0ZM27.07,28.56v.09c0,.57-.24,1.08-.61,1.46h0v.05c-.38.33-.9.57-1.46.57s-1.08-.24-1.46-.61h0c-.38-.38-.61-.9-.61-1.46v-.09h1.41v.09c0,.19.05.38.19.47v.05c.09.09.28.19.47.19s.38-.09.47-.19v-.05c.14-.09.24-.28.24-.47t-.05-.09h1.41ZM30.99,28.56v.09c0,1.65-.66,3.16-1.74,4.24-1.08,1.08-2.59,1.79-4.24,1.79s-3.16-.71-4.24-1.79l-.05-.05c-1.04-1.08-1.7-2.55-1.7-4.2v-.09h1.41v.09c0,1.27.47,2.4,1.27,3.25h.05c.85.85,1.98,1.37,3.25,1.37s2.4-.52,3.25-1.37c.85-.8,1.37-1.98,1.37-3.25v-.09h1.37ZM34.99,28.56v.09c0,2.78-1.13,5.28-2.92,7.07-1.79,1.79-4.29,2.92-7.07,2.92s-5.23-1.13-7.07-2.92c-1.79-1.79-2.92-4.29-2.92-7.07v-.09h1.41v.09c0,2.4.94,4.53,2.5,6.08,1.56,1.56,3.72,2.5,6.08,2.5s4.52-.94,6.08-2.5c1.56-1.56,2.5-3.68,2.5-6.08v-.09h1.41Z'/%3e%3c/svg%3e)