
Research article
Evidence for large domains of similarly expressed genes in the
Drosophila genome
Paul T Spellman and Gerald M Rubin
Address: Howard Hughes Medical Institute and Department of Molecular and Cell Biology, University of California, Berkeley
CA 94720-3400, USA.
Correspondence: Paul T Spellman. E-mail: spellman@bdgp.lbl.gov
Abstract
Background: Transcriptional regulation in eukaryotes generally operates at the level of
individual genes. Regulation of sets of adjacent genes by mechanisms operating at the level of
chromosomal domains has been demonstrated in a number of cases, but the fraction of genes
in the genome subject to regulation at this level is unknown.
Results: Drosophila gene-expression profiles that were determined from over 80
experimental conditions using high-density oligonucleotide microarrays were searched for
groups of adjacent genes that show similar expression profiles. We found about 200 groups
of adjacent and similarly expressed genes, each having between 10 and 30 members;
together these groups account for over 20% of assayed genes. Each group covers between
20 and 200 kilobase pairs of genomic sequence, with a mean group size of about 100 kilobase
pairs. Groups do not appear to show any correlation with polytene banding patterns or
other known chromosomal structures, nor were genes within groups functionally related to
one another.
Conclusions: Groups of adjacent and co-regulated genes that are not otherwise functionally
related in any obvious way can be identified by expression profiling in Drosophila. The
mechanism underlying this phenomenon is not yet known.
Published: 18 June 2002
Journal of Biology 2002, 1:5
The electronic version of this article is the complete one and can be
found online at http://jbiol.com/content/1/1/5
© 2002 Spellman and Rubin, licensee BioMed Central Ltd
ISSN 1475-4924
Received: 28 March 2002
Revised: 7 May 2002
Accepted: 17 May 2002
BioMed Central
Journal
of Biology
Background
The regulation of gene expression is a fundamental process
within every cell that often allows exquisite control over a
genes activity (for review see [1]). Altering transcription
rates is an effective strategy for regulating gene activity. It
is well established that transcription of a given gene is
dependent upon a promoter sequence located within a few
hundred base pairs of the transcriptional start site.
Promoter activity is modulated by sequence-specific tran-
scription factors that physically interact either with the
protein complexes that make up the core transcriptional
machinery or with the promoter sequence itself.
Journal of Biology 2002, 1:5

In eukaryotes, the activity of a promoter can be modified by
transcription factors binding to DNA sequences (frequently
termed cis-regulatory modules or enhancers) that are
located from hundreds to hundreds of thousands of base
pairs away from the promoter. These regulatory modules
can either increase or decrease the rate of transcription for
a target gene, depending on the cellular state and the activi-
ties of the bound transcription factors. There are several
mechanisms by which transcription factors bound to regu-
latory modules exert their effects. First, many transcription
factors interact directly with the core transcriptional
machinery by recruiting the latters protein complexes to
the promoter. Second, transcription factors may bend or
twist the DNA, altering the way in which other transcription
factors interact with the DNA. Finally, transcription factors
can alter local chromatin structure by modifying histones
(typically through methylation, acetylation, and substitu-
tion of histone subunits) to permit or restrict access to the
DNA. Modifications of chromosome structure also occur at
much larger scales. Most eukaryotes exhibit distinct chro-
mosomal regions that are usually either transcriptionally
active (euchromatin) or inactive (heterochromatin). In
animals, heterochromatin is typically found near
centromeres and other regions of low sequence complexity.
Less clear are the mechanisms by which the regulation
provided by a cis-regulatory module is restricted to specific
target genes. Several examples of insulators - sequences
that prevent neighboring modules from affecting tran-
scription - have been identified (reviewed in [2]). Insula-
tors seem to function not by deactivating cis-regulatory
modules but by preventing their influence from being
propagated along the chromosome. It is not known how
common insulators are in the Drosophila (or any other)
genome. Some insulator-binding proteins localize to a few
hundred chromosomal positions, and these positions coin-
cide with genomic sequences that are not heavily com-
pacted by chromatin structure (the interbands of polytene
chromosomes) [3]. There is substantial evidence that,
although gene expression can be tightly controlled, neigh-
boring genes or chromatin regions are important for the
expression of individual genes. For example, otherwise
identical transgenes inserted into different chromosomal
sites show varying levels of expression [4].
Two recent observations lend credence to the idea that
genomes may be divided into domains important for con-
trolling the expression of groups of adjacent genes. First,
there is evidence from budding yeast that some genes are
found in pairs or triplets of adjacent genes that display
similar expression patterns [5]. Second, about 50 much
larger regions of the human genome show a strong cluster-
ing of highly expressed genes [6], which is caused by
clustering of genes that are expressed in nearly all tissues
[7]. We have examined the fraction of genes in the
Drosophila genome that are subject to regulation that
reflects large domains, using data from high-density
oligonucleotide microarrays that reflect over 80 experi-
mental conditions, and have found more than 20% of the
genes clustered into co-regulated groups of 10-30 genes.
Results
Many neighboring genes show similar expression
patterns
We collected relative gene-expression profiles covering 88
distinct experimental conditions from 267 Affymetrix
GeneChip Drosophila Genome Arrays (see Materials and
methods section). When the genes in this dataset were
organized according to their positions along the chromo-
some, we observed numerous groups of physically adjacent
genes that shared strikingly similar expression profiles. We
sought to measure the magnitude of this effect by identify-
ing all groups of physically adjacent genes that showed
pair-wise correlations between their expression profiles
that were higher than expected by chance.
Visual inspection of the entire dataset using TreeView
software [8] revealed that groups of adjacent genes with
similar expression patterns appeared frequently in our real
dataset but rarely in a randomized dataset. The size of these
groups varied, but appeared to average about 10 genes. In
order to systematically identify groups of adjacent, similarly
expressed genes, we calculated the average pair-wise
Pearson correlation of gene expression for genes in a sliding
ten-gene window across the genome. The Pearson correla-
tion is a commonly used metric for determining the similar-
ity between two gene expression profiles [8], and the
average pair-wise correlation is the average of the Pearson
correlations of all 45 possible pairs of genes within the ten-
gene set. We estimated the probability of the average cor-
relation scores by randomly sampling one million times
from the dataset and calculating the average pair-wise
correlation for windows of ten genes. We also created a
random dataset of the same size, by randomly shuffling the
associations from genes to expression profiles, and used
this to illustrate the significance of our results. Our analyses
show that groups of physically adjacent genes with similar
expression are common; nearly 1,100 such groups are sig-
nificant at a pvalue of 10-2 (Table 1). In more conservative
analyses (requiring an uncorrected pvalue of 10-4), where
we expect to observe only one group by chance, in fact we
observed 124 groups (Table 1).
To ensure that ten-gene windows were appropriate, we
repeated the analysis using windows of various sizes. As
Journal of Biology 2002, 1:5
5.2 Journal of Biology 2002, Volume 1, Issue 1, Article 5 Spellman and Rubin http://jbiol.com/content/1/1/5

the window size increases from two to eight genes, the net
number of genes in groups (that is, the genes in groups in
the ordered dataset minus genes in groups from the
random dataset) increases linearly. At a window size of
about ten genes, the net number of genes begins to plateau
(Figure 1). This suggests that most groups include about
ten genes, so we used a window size of ten for the remain-
der of our analysis. There are no qualitative differences in
the nature of groups identified by larger window sizes.
Many of the ten-gene groups that have high average pair-
wise correlations of gene expression represent physically
overlapping stretches of genes (that is, genes nthrough
n+ 9 make up one group and genes n+ 1 through n+10
form another). For all further analyses, therefore, we
collapsed all groups that bordered one another into a
single group. This substantially reduced the number of
groups, showing that the effect on expression extends well
beyond ten genes (Table 2). Nearly 1,100 ten-gene groups
are significant at p< 10-2, but these collapse into only 211
groups with an average group size of greater than 15 genes.
As the pvalues decrease the average group size also
decreases, but even at p< 10-4 there are, on average, 12
genes in each group (553 genes in 46 groups; see Table 2).
The 44 groups (681 genes in total) that map to the left arm
of chromosome two and have a pvalue of less than 10-2 are
shown, using a ratiogram [8] aligned to the chromosome
arm, in Figure 2. The distribution of groups along the chro-
mosomes appears random and there is little bias for genes
in a group to be on the same strand. The length of genomic
sequence occupied by similarly expressed gene groups is
highly variable. The average group size is nearly 125 kilo-
base pairs (kbp) in length, with a standard deviation of
about 90 kbp, while the smallest group is 22 kbp and the
largest is over 450 kbp. As might be expected, there is a
relationship between the number of genes in a group and
the length of genomic DNA covered by each group
(Pearson correlation 0.59).
Gene groups are not explained by gene function or
homology
Many genes that are related by function share similar
expression patterns, and it is plausible that the same is
true for homologous genes, particularly those that arose
from recent duplications. In Drosophila there are 2,207
genes for which there is a homolog within the genome and
the two homologs are separated by less than 10 genes. To
determine whether homologs account for our observa-
tions, we repeated our analysis on a dataset from which
homologs that are physically near one another were
removed. This dataset is just under 12,000 genes, and
although there is a significant decrease in the numbers of
http://jbiol.com/content/1/1/5 Journal of Biology 2002, Volume 1, Issue 1, Article 5 Spellman and Rubin 5.3
Journal of Biology 2002, 1:5
Table 1
The number of ten-gene groups of adjacent, similarly
expressed genes that are found in ordered and randomized
datasets, or are expected to be found in a randomized dataset
Significance (p value) Ordered Randomized Expected
dataset dataset
10-4 124 0 1
10-3 352 6 13
10-2 1,077 106 130
The ‘Expected’ column gives an approximate number.
Figure 1
The number of genes identified as being in groups when different
window sizes are used. In order to identify groups of adjacent, similarly
expressed genes, the average pair-wise correlation of gene expression
was calculated for genes in a sliding window across the genome, and
this process was repeated for windows of different sizes. The net
number of genes (that is, the number of genes in groups in the ordered
dataset minus the number of genes in groups from the random dataset)
is plotted against window size.
0 5 10 15 20 25 30
Window size
0
500
1000
1500
2000
2500
3000
3500
4000
Net genes
Table 2
The number of groups of genes, and total numbers of genes in
groups, that are identified at various levels of significance
(pvalues)
Groups Genes
Significance Ordered Randomized Ordered Randomized
(p value) dataset dataset dataset dataset
10-4 46 0 553 0
10-3 93 5 1,219 51
10-2 211 53 3,228 586
genes found to be in groups in this dataset (Table 3), 176
groups remain, containing about 2,500 genes.
We considered an extreme model to account for our obser-
vations - that evolutionary selection has organized gene
groups according to the biological processes the genes are
involved in, so that their expression can be coordinately
regulated. We sought to test this model using the Gene
Ontology (GO) database [9,10] as a source of annotations
of biological processes. We first used the hypergeometric
distribution to calculate the probability of observing each
GO term as enriched in each group, on the basis of the
number of genes in the group, the number of genes in that
group that are annotated with that GO term, and the
number of genes in the genome that are annotated with
that GO term. We then selected all GO process terms
associated with a group at p< 0.05 where at least two
genes had the selected GO term. Of the 211 groups identi-
fied in our full dataset and the 176 groups from the
homologs-removed dataset, 43 and 11 GO terms, respec-
tively, have associations to groups that meet the above
criteria. These numbers are modestly higher than would be
expected by placing a random selection of genes into
groups, where we would expect 7 ± 2 from the full dataset
and 4 ± 2 from the homologs-removed dataset. The
observed enrichment is clearly dependent on homologs,
however, given the nearly four-fold decrease in observed
associations when homologs are excluded from the analy-
sis. Thus, with the present level of functional annotation,
the vast majority of gene groups we observe are not com-
posed of genes with similar biological processes, and the
extreme model is not supported.
Similarly expressed gene groups can be identified
from smaller datasets
Our dataset is derived from RNA samples taken from
embryos or adults (primarily males). The groups in our
dataset show a pattern of gene expression that mirrors this
Journal of Biology 2002, 1:5
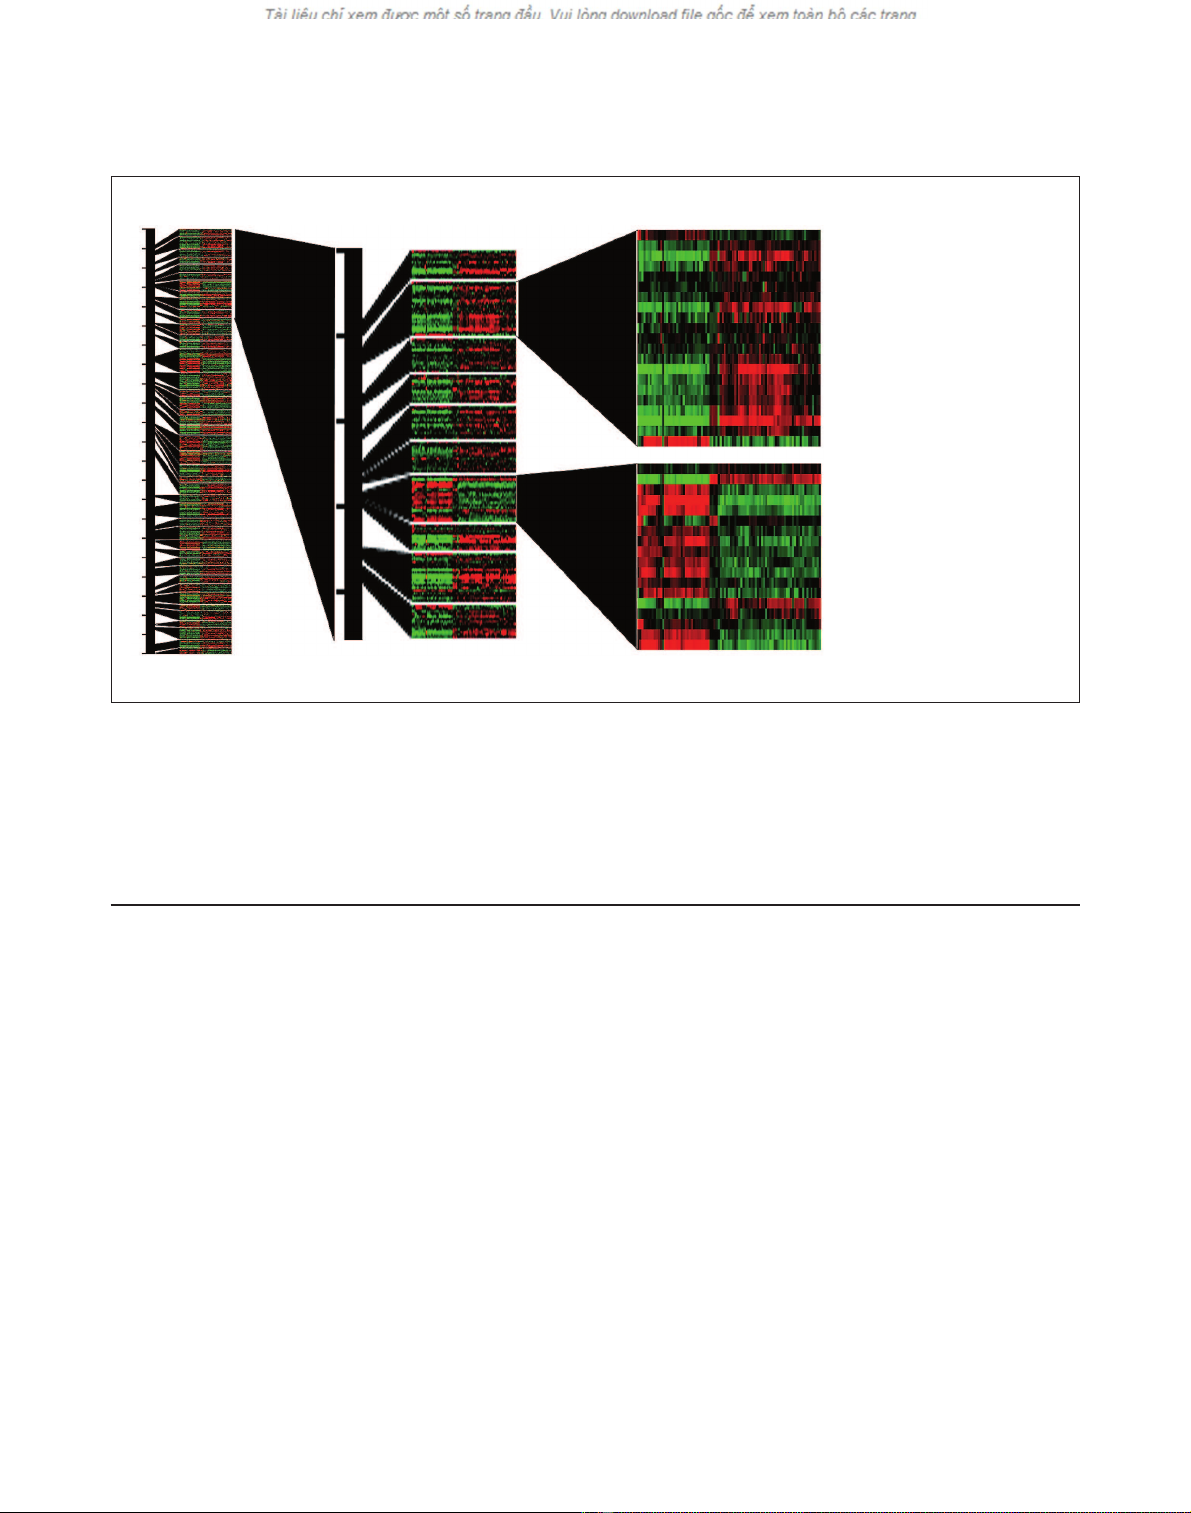
Figure 2
Similarly expressed adjacent genes on the left arm of Drosophila chromosome 2 (2L). (a) Ratiograms show the relative expression of all gene groups
on 2L that are significant at p< 10-2. In each ratiogram, columns represent individual experimental conditions and rows represent individual genes.
For each square on the resulting grid, red denotes relative expression higher than the average for a gene in an experiment, green denotes lower
relative expression and black indicates that the expression is equal to the average. The black bar represents the chromosome, and the ticks along its
left side mark 1 megabase (Mb) distances. The black shapes link the positions of groups on 2L to the expanded views of certain groups that are
shown in (b,c). (b) An expanded view of about 5 Mb. (c) The genes in two groups are shown in detail. The CT (computed transcript identifier), CG
(computed gene identifier), and gene name are shown for each of the genes in these two groups. Each of the two expanded sections represents
one group.
CT15882 CG4947 CG4947
CT15884 CG5001 CG5001
CT16455 CG5139 CG5139
CT16096 CG5011 CG5011
CT33975 CG14342 CG14342
CT33976 CG14343 CG14343
CT16503 CG5156 CG5156
CT16527 CG5397 CG5397
CT17158 CG5423 CG5423
CT33977 CG14344 CG14344
CT33978 CG14345 CG14345
CT17230 CG5430 a5
CT17252 CG5440 CG5440
CT17290 CG5450 Cdlc2
CT17558 CG5556 CG5556
CT17554 CG5561 CG5561
CT17492 CG5564 CG5564
CT17332 CG5565 CG5565
CT33980 CG16933 NLaz
CT33979 CG14346 CG14346
CT17328 CG5574 CG5574
(a) (b) (c)
CT35452 CG15402 CG15402
CT38165 CG3151 Rbp9
CT10673 CG3181 Ts
CT10659 CG3178 Rrp1
CT10601 CG3157 Tub23
CT27262 CG9641 CG9641
CT10615 CG3165 CG3165
CT27264 CG9643 CG9643
CT12153 CG3733 Chd1
CT42330 CG18642 Bem46
CT12137 CG3736 okr
CT11970 CG3558 CG3558
CT35453 CG17265 CG17265
CT38181 CG17224 CG17224
CT35454 CG17264 CG17264
CT38179 CG17223 CG17223
CT38167 CG3542 CG3542
CT12091 CG3605 CG3605
5.4 Journal of Biology 2002, Volume 1, Issue 1, Article 5 Spellman and Rubin http://jbiol.com/content/1/1/5

bifurcation: most genes are expressed at higher levels in
either adults or embryos. We wished to determine whether
our observations of groups reflect this division, so we
divided our dataset in two, creating one dataset of embryo
experiments and one of adult experiments. It should be
noted that four of the adult experiments contained RNA
from males and from females, which contain a substantial
number of oocytes, whereas the rest of the dataset was only
from males. We calculated the average pair-wise correla-
tions for all groups of genes in each of the two new
datasets; Table 4 summarizes the number of genes in
groups for the embryo and adult datasets (both random-
ized and ordered). The gene numbers are remarkably
similar to those found for the entire dataset, as are the
numbers of groups (see the Additional data files with this
article online).
We wished to know if there was a correlation between the
gene groups identified in the adult, embryo, and combined
datasets. To do this we tabulated all genes identified in
each dataset at each of three pvalues (10-2, 10-3 and 10-4)
and calculated the Pearson correlation between each pair
of datasets at each pvalue (Table 5). The average correla-
tion between either the embryo or the adult dataset and
the combined dataset is about 0.35, while the average cor-
relation between the adult and embryo datasets is lower
(about 0.23). The number of genes involved makes little
difference, because the correlations are similar at each
pvalue, despite the vastly different numbers of genes iden-
tified at different pvalues. In all, 890 genes are present in
a group defined by one of the three datasets at p<10
-4.
After correcting for genes expected to be found in groups
by chance, about 2,250 genes are identified in one of the
three datasets at a pvalue of 10-3 and about 4,000 genes
are identified at 10-2.
Correlations with known chromosome structures
We attempted to determine whether the locations of simi-
larly expressed gene groups correlate with known chromo-
some structures. Polytene chromosomes show a distinct,
reproducible pattern of extended and compacted regions.
The compacted regions contain the vast majority of the
DNA, although the amount of DNA in each band can vary
by more than one order of magnitude. The mean DNA
content of each band is approximately 25 kbp [11,12] as
compared with approximately 125 kbp for each group of
co-expressed genes. We calculated the number of bands
that overlap (or are contained in) each group and com-
pared this with the number of bands that overlap (or are
contained in) a randomly placed group matched for size.
There was very little difference in the average number of
bands overlapping each co-expressed group or each ran-
domly placed group (5.9 versus 6.6).
It has been proposed that Drosophila chromosomes are
attached to a nuclear scaffold at precise locations [13], but
there is very limited mapping data on the position of these
attachments. Mirkovitch et al. [13] mapped four attach-
ment sites in a 320 kbp region near the rosy gene on chro-
mosome 3R, dividing the region into a number of discrete
domains of average size 50 kbp, each containing many
genes. We wished to determine whether the groups we
identified might correspond to distinct regions between
attachment sites, as several of our groups fall in the region
Journal of Biology 2002, 1:5
Table 3
The number of groups of genes, and total numbers of genes in
groups, from a dataset containing no physically close
homologs
Groups Genes
Significance Ordered Randomized Ordered Randomized
(p value) dataset dataset dataset dataset
10-4 18 2 200 21
10-3 62 7 767 80
10-2 176 49 2,561 576
Table 4
The number of genes within groups identified in either ‘adult’
or ‘embryo’ experiments
Embryo Adult
Significance Ordered Randomized Ordered Randomized
(p value) dataset dataset dataset dataset
10-4 285 0 371 0
10-3 1,159 52 1,139 114
10-2 3,108 686 3,144 938
Table 5
The correlation between sets of genes identified in the adult,
embryo and combined datasets
Significance Combined: Combined: Adult:
(p value) adult embryo embryo
10-4 0.33 0.41 0.24
10-3 0.34 0.34 0.23
10-2 0.38 0.28 0.22
http://jbiol.com/content/1/1/5 Journal of Biology 2002, Volume 1, Issue 1, Article 5 Spellman and Rubin 5.5


![Mẫu đề cương chi tiết sinh viên thực tế tại doanh nghiệp [chuẩn nhất]](https://cdn.tailieu.vn/images/document/thumbnail/2014/20140523/duongxuan92/135x160/1681621_356.jpg)


![Báo cáo môn học Công Nghệ Di Truyền [năm] [trường] (hoặc: Mới nhất/Chi tiết)](https://cdn.tailieu.vn/images/document/thumbnail/2013/20130225/trautuongquan/135x160/8601361760920.jpg)


%20--%3e%3cdefs%3e%3cstyle%3e%20.st0%20{%20fill:%20%23fff;%20}%20.st1%20{%20fill:%20%237800fa;%20}%20%3c/style%3e%3c/defs%3e%3cpath%20class='st1'%20d='M117.78,12.18H43.11c2.9,3.47,4.65,7.94,4.65,12.82,0,5.6-2.3,10.66-6.01,14.29h76.02l7.22-13.56-7.22-13.56Z'/%3e%3cg%3e%3cpath%20class='st0'%20d='M53.58,26.17h-.59v-1.46h.59v-4.96h2.83c1.78,0,2.67.94,2.67,2.82v5.76c0,1.87-.89,2.81-2.67,2.81h-2.83v-4.96ZM55.36,21.37v3.34h1.1v1.46h-1.1v3.34h1.01c.61,0,.91-.37.91-1.1v-5.93c0-.74-.3-1.1-.91-1.1h-1.01Z'/%3e%3cpath%20class='st0'%20d='M65.99,31.14h-1.8l-.31-2.07h-2.19l-.31,2.07h-1.64l1.82-11.39h2.62l1.82,11.39ZM65.28,18.04c-.25.46-.51.77-.75.94-.21.15-.47.22-.79.22-.26,0-.57-.07-.92-.22l-.38-.15c-.14-.05-.26-.07-.37-.07-.3,0-.53.18-.71.54l-.91-.68c.25-.46.51-.77.75-.94.21-.14.48-.21.79-.21.26,0,.57.07.92.21l.38.15c.14.05.26.07.37.07.3,0,.53-.18.71-.54l.91.68ZM61.91,27.52h1.73l-.87-5.76-.87,5.76Z'/%3e%3cpath%20class='st0'%20d='M74.53,26.89v1.52c0,1.91-.89,2.86-2.67,2.86s-2.67-.95-2.67-2.86v-5.93c0-1.91.89-2.86,2.67-2.86s2.67.95,2.67,2.86v1.11h-1.69v-1.22c0-.75-.31-1.12-.93-1.12s-.93.37-.93,1.12v6.15c0,.74.31,1.11.93,1.11s.93-.37.93-1.11v-1.63h1.69Z'/%3e%3cpath%20class='st0'%20d='M81.4,31.14h-1.8l-.31-2.07h-2.19l-.31,2.07h-1.64l1.82-11.39h2.62l1.82,11.39ZM75.9,19.2l1.52-1.91h1.71l1.51,1.91h-1.61l-.76-.95-.75.95h-1.61ZM77.32,27.52h1.73l-.87-5.76-.87,5.76ZM83.1,15.99l-1.76,1.91h-1.26l1.17-1.91h1.86Z'/%3e%3cpath%20class='st0'%20d='M84.86,19.75c1.78,0,2.67.94,2.67,2.82v1.48c0,1.87-.89,2.81-2.67,2.81h-.85v4.28h-1.79v-11.39h2.64ZM84.01,21.37v3.86h.85c.58,0,.87-.36.87-1.08v-1.71c0-.71-.29-1.07-.87-1.07h-.85Z'/%3e%3cpath%20class='st0'%20d='M93.51,19.75c1.78,0,2.67.94,2.67,2.82v1.48c0,1.87-.89,2.81-2.67,2.81h-.85v4.28h-1.79v-11.39h2.64ZM92.66,21.37v3.86h.85c.58,0,.87-.36.87-1.08v-1.71c0-.71-.29-1.07-.87-1.07h-.85Z'/%3e%3cpath%20class='st0'%20d='M98.8,31.14h-1.79v-11.39h1.79v4.88h2.03v-4.88h1.83v11.39h-1.83v-4.88h-2.03v4.88Z'/%3e%3cpath%20class='st0'%20d='M105.36,24.55h2.46v1.62h-2.46v3.34h3.09v1.63h-4.88v-11.39h4.88v1.63h-3.09v3.18ZM108.17,17.29l-1.76,1.91h-1.26l1.17-1.91h1.86Z'/%3e%3cpath%20class='st0'%20d='M112.2,19.75c1.78,0,2.67.94,2.67,2.82v1.48c0,1.87-.89,2.81-2.67,2.81h-.85v4.28h-1.79v-11.39h2.64ZM111.35,21.37v3.86h.85c.58,0,.87-.36.87-1.08v-1.71c0-.71-.29-1.07-.87-1.07h-.85Z'/%3e%3c/g%3e%3ccircle%20class='st1'%20cx='25'%20cy='25'%20r='20'/%3e%3cpath%20class='st0'%20d='M32.78,19.27c2.92,0,4.43,2.55,5.28,5.33l.71,2.17c.14.38-.33.75-.71.75h-5.61c.19-.33.24-.71.09-1.08l-.75-2.45c-.43-1.32-.99-2.64-1.79-3.77.75-.57,1.65-.94,2.78-.94h0ZM25,18.38c3.25,0,4.9,2.78,5.89,5.89l.76,2.45c.14.42-.33.8-.8.8h-11.69c-.42,0-.94-.38-.8-.8l.75-2.45c.99-3.11,2.64-5.89,5.89-5.89h0ZM25,11.35c1.74,0,3.11,1.37,3.11,3.11s-1.37,3.11-3.11,3.11-3.11-1.41-3.11-3.11,1.41-3.11,3.11-3.11h0ZM17.27,19.27c1.08,0,1.98.38,2.73.94-.8,1.13-1.37,2.45-1.74,3.77l-.8,2.45c-.14.38-.05.75.09,1.08h-5.56c-.42,0-.9-.38-.75-.75l.71-2.17c.9-2.78,2.41-5.33,5.33-5.33h0ZM17.27,12.91c1.51,0,2.78,1.27,2.78,2.83s-1.27,2.83-2.78,2.83-2.83-1.27-2.83-2.83,1.27-2.83,2.83-2.83h0ZM32.78,12.91c1.56,0,2.78,1.27,2.78,2.83s-1.23,2.83-2.78,2.83-2.83-1.27-2.83-2.83,1.27-2.83,2.83-2.83h0ZM27.07,28.56v.09c0,.57-.24,1.08-.61,1.46h0v.05c-.38.33-.9.57-1.46.57s-1.08-.24-1.46-.61h0c-.38-.38-.61-.9-.61-1.46v-.09h1.41v.09c0,.19.05.38.19.47v.05c.09.09.28.19.47.19s.38-.09.47-.19v-.05c.14-.09.24-.28.24-.47t-.05-.09h1.41ZM30.99,28.56v.09c0,1.65-.66,3.16-1.74,4.24-1.08,1.08-2.59,1.79-4.24,1.79s-3.16-.71-4.24-1.79l-.05-.05c-1.04-1.08-1.7-2.55-1.7-4.2v-.09h1.41v.09c0,1.27.47,2.4,1.27,3.25h.05c.85.85,1.98,1.37,3.25,1.37s2.4-.52,3.25-1.37c.85-.8,1.37-1.98,1.37-3.25v-.09h1.37ZM34.99,28.56v.09c0,2.78-1.13,5.28-2.92,7.07-1.79,1.79-4.29,2.92-7.07,2.92s-5.23-1.13-7.07-2.92c-1.79-1.79-2.92-4.29-2.92-7.07v-.09h1.41v.09c0,2.4.94,4.53,2.5,6.08,1.56,1.56,3.72,2.5,6.08,2.5s4.52-.94,6.08-2.5c1.56-1.56,2.5-3.68,2.5-6.08v-.09h1.41Z'/%3e%3c/svg%3e)