
RESEARC H Open Access
Differential patterns of intronic and exonic DNA
regions with respect to RNA polymerase II
occupancy, nucleosome density and H3K36me3
marking in fission yeast
Brian T Wilhelm
1,2*
, Samuel Marguerat
1
, Sofia Aligianni
1,3
, Sandra Codlin
1
, Stephen Watt
1,4
and Jürg Bähler
1
Abstract
Background: The generation of mature mRNAs involves interconnected processes, including transcription by RNA
polymerase II (Pol II), modification of histones, and processing of pre-mRNAs through capping, intron splicing, and
polyadenylation. These processes are thought to be integrated, both spatially and temporally, but it is unclear how
these connections manifest at a global level with respect to chromatin patterns and transcription kinetics. We
sought to clarify the relationships between chromatin, transcription and splicing using multiple genome-wide
approaches in fission yeast.
Results: To investigate these functional interdependencies, we determined Pol II occupancy across all genes using
high-density tiling arrays. We also performed ChIP-chip on the same array platform to globally map histone H3 and
its H3K36me3 modification, complemented by formaldehyde-assisted isolation of regulatory elements (FAIRE).
Surprisingly, Pol II occupancy was higher in introns than in exons, and this difference was inversely correlated with
gene expression levels at a global level. Moreover, introns showed distinct distributions of histone H3, H3K36me3
and FAIRE signals, similar to those at promoters and terminators. These distinct transcription and chromatin
patterns of intronic regions were most pronounced in poorly expressed genes.
Conclusions: Our findings suggest that Pol II accumulates at the 3’ends of introns, leading to substantial
transcriptional delays in weakly transcribed genes. We propose that the global relationship between transcription,
chromatin remodeling, and splicing may reflect differences in local nuclear environments, with highly expressed
genes being associated with abundant processing factors that promote effective intron splicing and transcriptional
elongation.
Background
Generation of mature mRNA transcripts requires com-
plex and interconnected processes that involve opening
of the local chromatin structure around the DNA region
to be transcribed, binding and transcription by RNA
polymerase II (Pol II), and processing of the pre-
mRNAs, including the splicing of the non-coding
introns [1,2]. Protein production is streamlined at sev-
eral levels of gene expression, including coordinated
transcription and translation [3]. Moreover, there is
some evidence for functional coupling between tran-
scription and pre-mRNA processing [4-6].
We have previously reported that, in fission yeast
(Schizosaccharomyces pombe), highly transcribed genes
tend to be most efficiently spliced while lowly tran-
scribed genes are less efficiently spliced [7]. The reason
for this unexpected global coordination between tran-
scription and splicing is not known. Moreover, Pol II-
directed transcription is controlled by permissive or
repressive chromatin modifications but in turn also
affects such modifications [8]. Splicing is initiated co-
transcriptionally in a chromatin context, which raises
the possibility of a functional relationship between
* Correspondence: brian.wilhelm@umontreal.ca
1
Department of Genetics, Evolution and Environment and UCL Cancer
Institute, University College London, Darwin Building, Gower Street, London
WC1E 6BT, UK
Full list of author information is available at the end of the article
Wilhelm et al.Genome Biology 2011, 12:R82
http://genomebiology.com/2011/12/8/R82
© 2011 Wilhelm et al.; licensee BioMed Central Ltd. This is an open access article distributed under the terms of the Creative Commons
Attribution License (http://creativecommons.org/licenses/by/2.0), which permits unrestricted use, distribution, and reproduction in
any medium, provided the original work is properly cited.
splicing and the local chromatin environment. In addi-
tion to controlling the accessibility of DNA to the basal
transcriptional machinery, there is evidence that chro-
matin structure can influence the co-transcriptional spli-
cing of immature transcripts [9-11]. Notably, differential
marking of introns and exons has recently been reported
in several organisms [12,13], although the mechanism
and functional consequences of such marking are not
clear.
We applied multiple genome-scale approaches in fis-
sion yeast to clarify the relationships between chromatin,
transcription and splicing. Introns, besides promoter and
terminator regions, were relatively depleted of histones
andalsoshoweddistinctchromatin patterns. Unexpect-
edly, Pol II occupancy was much higher in intronic than
in exonic DNA regions, most notably in lowly expressed
genes. This differential marking of introns at the DNA
level suggests that Pol II stalls at the 3’-ends of intronic
regions, leading to substantial accumulation in the
introns of lowly transcribed genes. We speculate that
these patterns reflect a functional coupling between tran-
scription, chromatin remodeling, and splicing, and that
only highly transcribed genes are embedded in processive
environments such as ‘transcription factories’,where
abundant processing factors promote effective intron
splicing and transcriptional elongation.
Results and discussion
Experimental approach
In order to uncover any connections between transcrip-
tion, intron splicing, and chromatin marks in rapidly
growing fission yeast cells, we determined global Pol II
occupancy using chromatin immunoprecipitation on
microarray (ChIP-chip) experiments. Furthermore, we
applied ChIP-chip experiments to analyze the global dis-
tributions of histone H3 and lysine 36 trimethylation of
histone H3 (H3K36Me3), a modification that is enriched
in the body of actively transcribed genes [14]. In addi-
tion, to verify the histone H3 occupancy and reveal
genomic regions that are relatively protein free, we
applied formaldehyde-assisted isolation of regulatory ele-
ments (FAIRE) [15,16]. We used the same high-density
Affymetrix tiling array platform for all these genome-
wide approaches (Materials and methods).
Distinct Pol II occupancy and chromatin patterns in
promoter and terminator regions
The 5’ends of genes, corresponding to the nucleosome-
free regions of promoters, had high FAIRE signals in fis-
sion yeast (Figure 1). These results are consistent with
the originally published results in human [15]. Figure 2
shows the average patterns for the different chromatin-
and transcription-related features across intron-less and
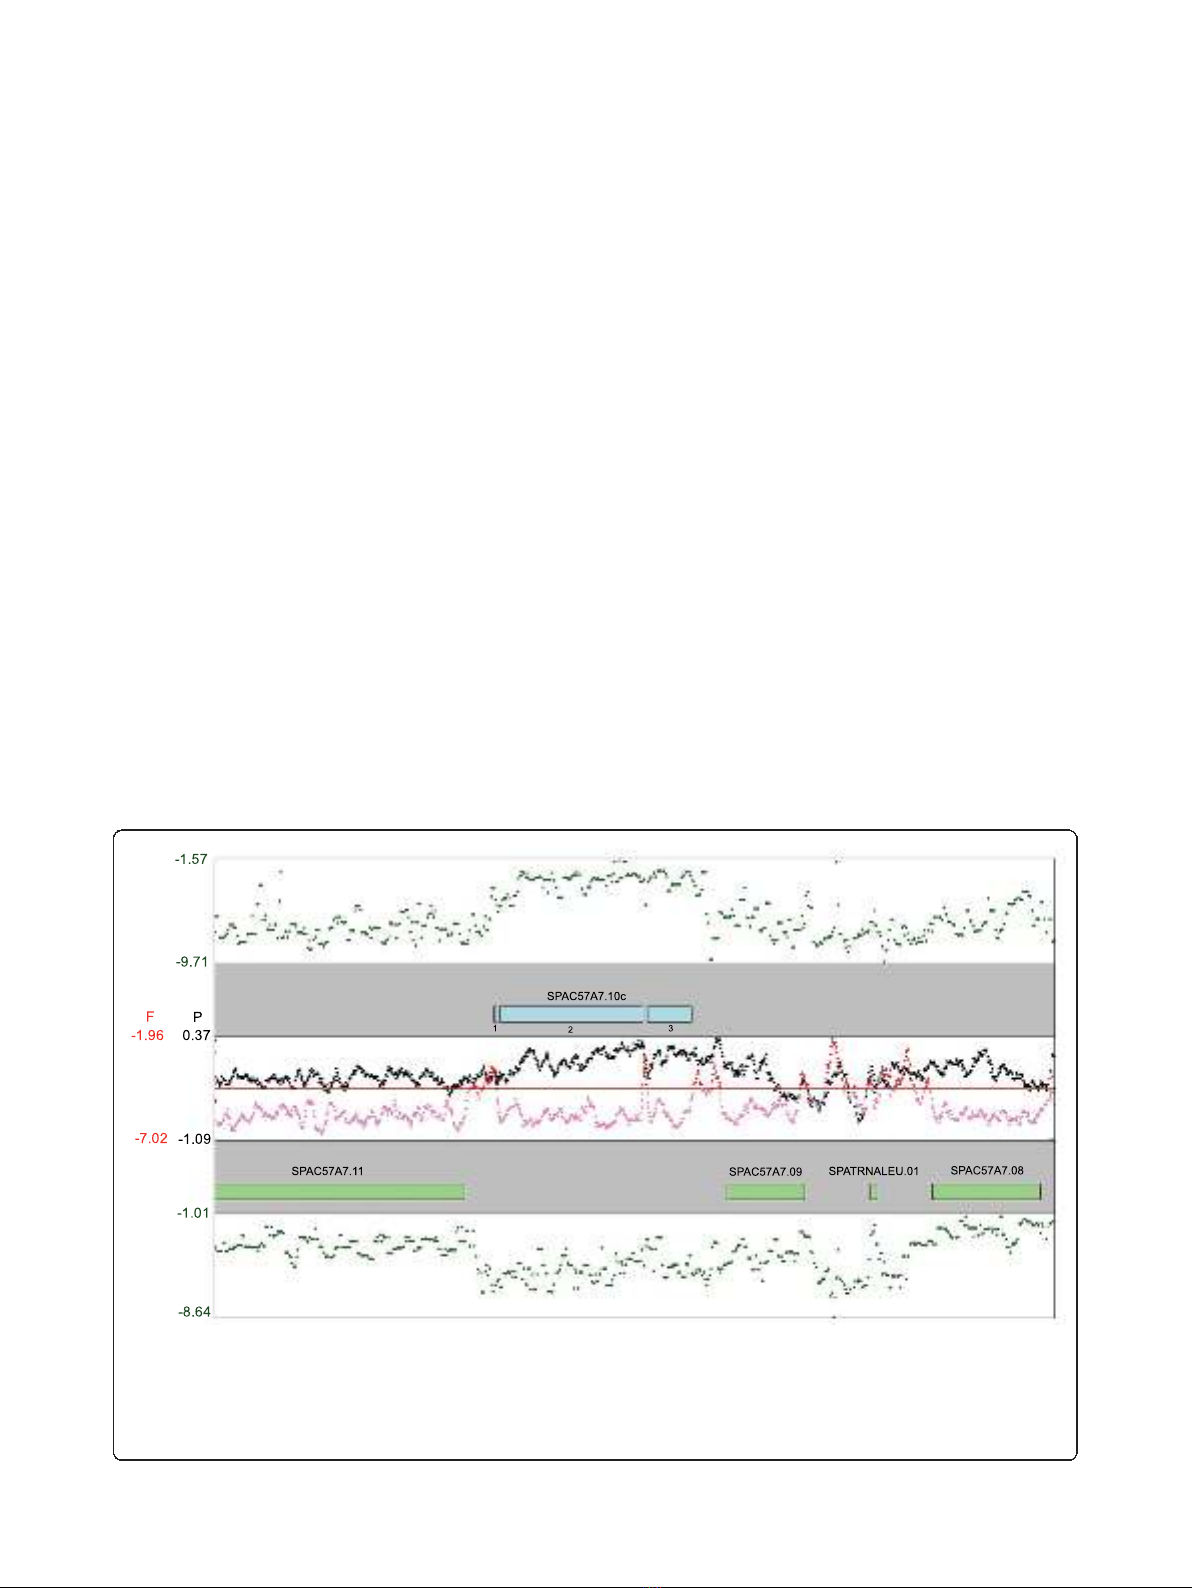
Figure 1 An example of FAIRE, Pol II ChIP-chip, and expression data. The top and bottom panels with green points depict expression data
for the upper and lower strand, respectively, obtained from random-primed RNA hybridized to Affymetrix tiling arrays with each point
representing a single probe. The second and fourth panels show annotated genes in the region around sec21 (SPAC57A7.10c), with exons
numbered underneath the gene. The third panel shows a 5 probe running average of Pol II signals (black points) or FAIRE signals (pink/red
points). The horizontal red line shows the 85% percentile line for all FAIRE probe signals, with probes above this cut-off colored red and those
below colored pink. Note that FAIRE and Pol II signals are not strand-specific.
Wilhelm et al.Genome Biology 2011, 12:R82
http://genomebiology.com/2011/12/8/R82
Page 2 of 12
intron-containing genes. Peaks of Pol II enrichment were
evident in the promoter regions of genes, reflecting the
accumulation of Pol II before transcription elongation
[17,18]. Moreover, these regions showed high FAIRE sig-
nals, but relative depletion of histone H3 and, even more
so, for its H3K36Me3 modification (Figure 2).
Gene promoters are known to contain nucleosome-
free regions [19-21]. Notably, we found that the 3’ends
of genes, corresponding to the terminator regions, also
show Pol II enrichment, low histone H3 density and
high FAIRE signal (Figures 2 and 3). While the nucleo-
some-free regions in promoters have been well charac-
terized, a similar depletion of nucleosomes in terminator
regions is not as well defined. A recent report in bud-
ding yeast shows depletion of nucleosomes at the 3’end
of transcribed genes, and this depletion is coupled to
(a)
(b)
FAIRE, H3, RNA Poll II and H3K36(Me)3 IP signal across average unspliced gene
FAIRE, H3, RNA Pol II and H3K36(Me)3 IP signal across average spliced gene
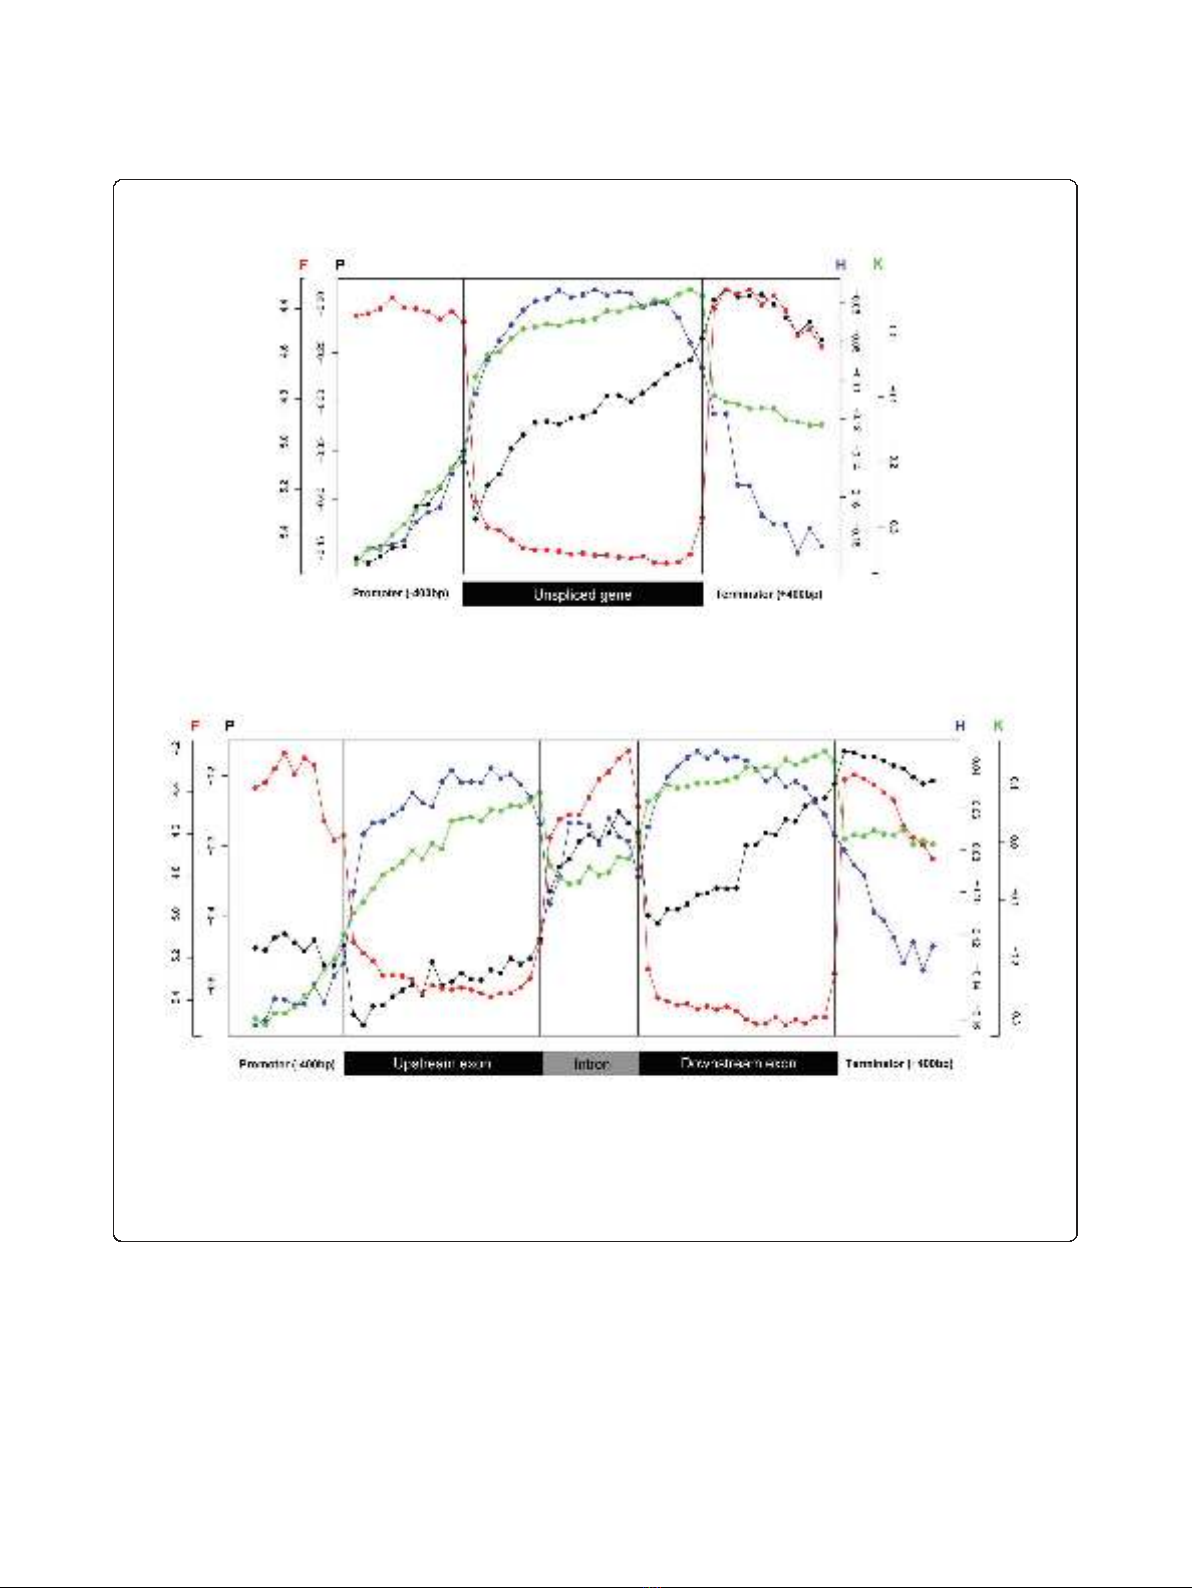
Figure 2 Profiles of transcription- and chromatin-related patterns across average spliced and unspliced genes.(a) Average unspliced
gene profiles for FAIRE (red), histone H3 (blue), H3K36me3 (green, normalized for H3 signals), and Pol II (black) signals from Affymetrix tiling
arrays. Promoter and terminator regions are taken as 400 bp up- and downstream of the start and stop codons, respectively, and divided into 10
bins of 40 bp each, while the coding regions were divided into 20 bins of equal size. Black vertical lines separate different gene sections, and
each plotted point represents the average of all probes that fall into the respective location bin. Color-coded scales for FAIRE (F) and Pol II (P)
signals are shown on the left y-axis of the graph, while the scales for histone H3 (H) and H3K36me3 (K) are shown on the right y-axis. (b)
Average spliced gene profiles for FAIRE (red), histone H3 (blue), H3K36me3 (green), and Pol II (black) signals from Affymetrix tiling arrays as in (a).
Wilhelm et al.Genome Biology 2011, 12:R82
http://genomebiology.com/2011/12/8/R82
Page 3 of 12
transcriptional activity [22].Ourfindingsarealsocon-
sistent with reports in mammalian cells that describe
pausing of Pol II in terminator regions [23,24]. The start
and end of introns showed lower levels of H3 occupancy
(Figure 2b). This pattern might result from a ‘looped’
arrangement of exons and introns analogous to that
proposed for the human BRCA1 gene [25]. Although
this exon-intron pattern is not reflected in FAIRE, the
overall patterns support the notion that nucleosome
density is likely the major determinant for the FAIRE
signals.
Gene expression levels affect Pol II occupancy and
chromatin patterns across genes
We next assessed the effects of transcript levels on the
observed Pol II- and chromatin-related patterns across
genes. To this end, we sorted all genes with measurable
expression on Affymetrix chips into decile ranked
groups, with the first decile representing the 10% most
highly expressed genes, and so on. Average expression
values for unspliced and spliced genes were calculated
for each data set and for each expression bin and
plotted either relative to the values in each bin (Figure
3) to highlight the range within each expression group
or on a single scale according to the range of values of
theentiredataset(Figure4)toshowtheabsolute
enrichment. This analysis revealed that gene expression
levels strongly influence the Pol II- and chromatin-
related patterns. Coherent differences depending on
expression level group were apparent (Figure 4): the
most highly expressed genes showed the highest Pol II
occupancy (Figure 4a), but the lowest density of histone
H3 (Figure 4b), and the highest levels of H3K36me3
modification (after correcting for nucleosome density;
Figure 4c). Glover-Cutter et al. [26] made similar obser-
vations of inverse enrichment between Pol II and
nucleosomes, which could reflect displacement of
nucleosomes by Pol II. The Pol II patterns were also
apparent at the level of highly or lowly expressed single
genes (Additional file 1).
(a) (b)
(c) (d)
RNA Pol II ChIP across average spliced gene H3 ChIP across average spliced gene
H3K35 ChIP across average spliced gene FAIRE across average spliced gene
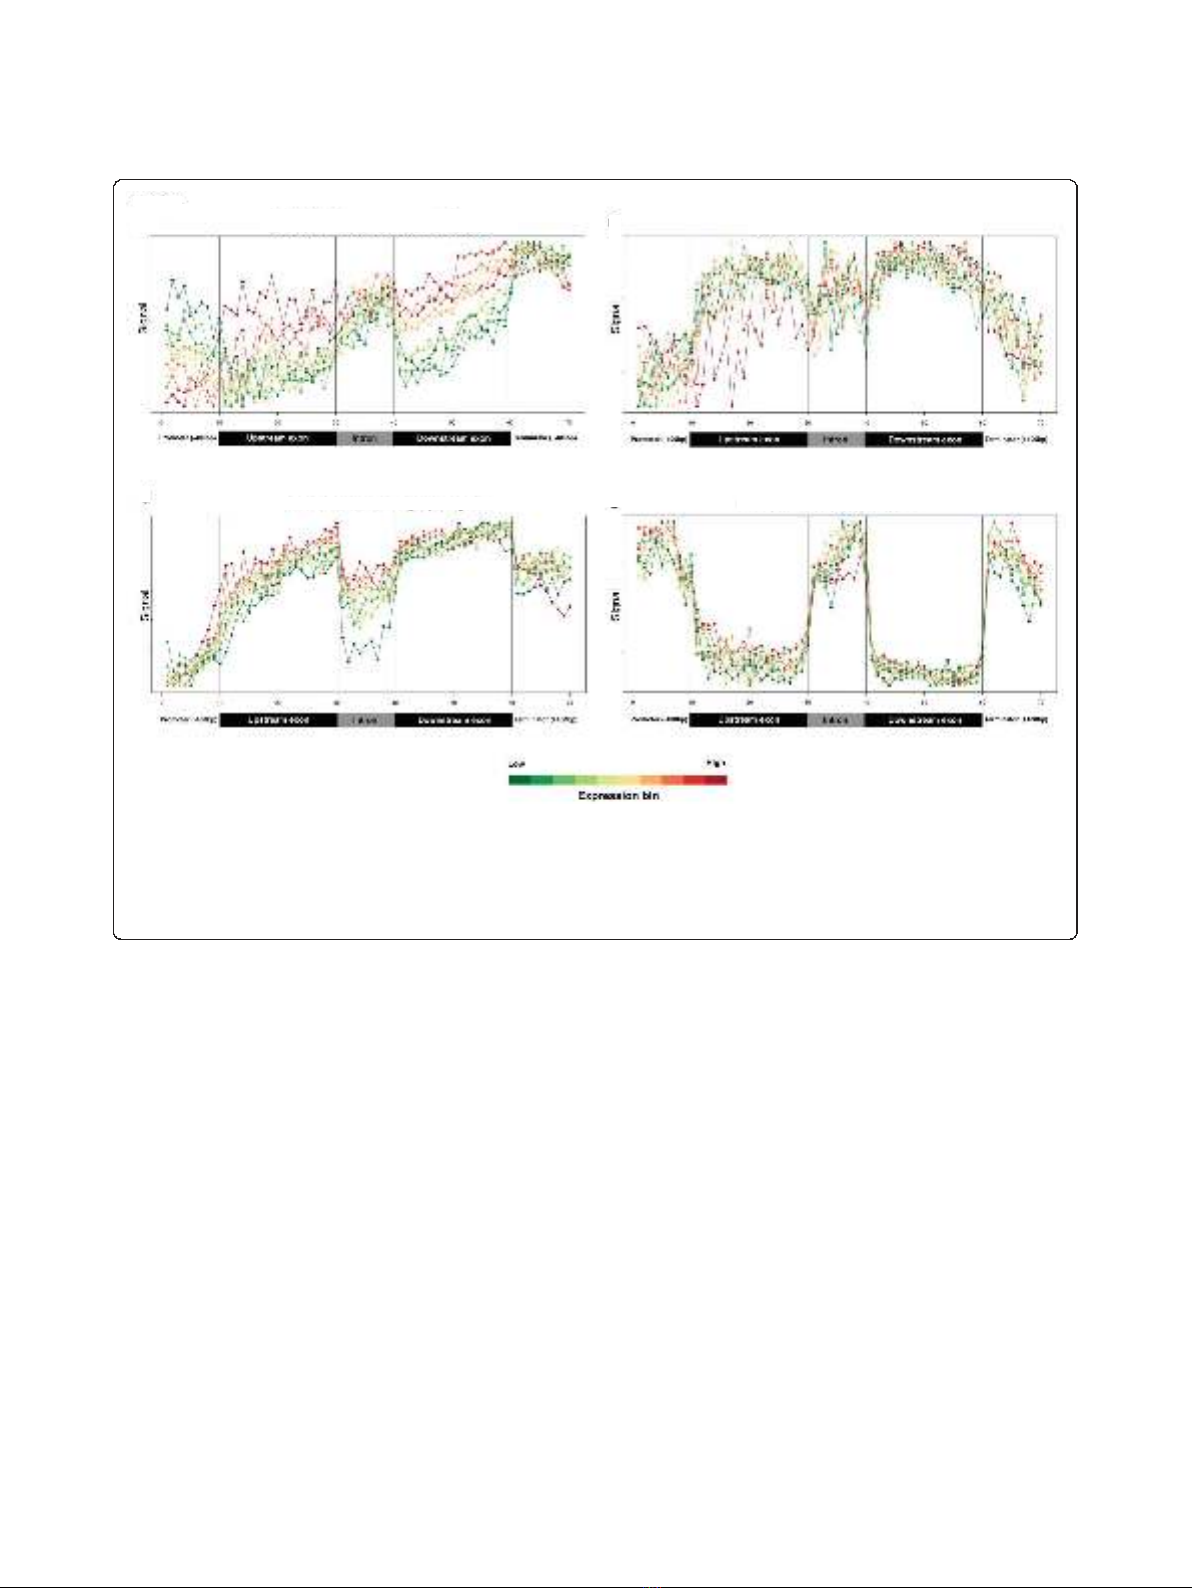
Figure 3 Profiles of transcription and chromatin-related patterns as a function of gene expression.(a-d) Probe signals for Pol II (a),
histone H3 (b), H3K36me3 (c), and FAIRE (d) were used to generate average spliced gene profiles that were grouped into ten ranked bins based
on Affymetrix expression data. Scales for the relative data range from each expression bin were used to generate the plots. Identical data plotted
on the same absolute y-scale for all expression bins is presented for average spliced and unspliced genes in Figure 4. The color bar at bottom
depicts average expression levels of bins (red, high expression; green, low expression), and black vertical lines within each box demarcate
different sections within the average gene.
Wilhelm et al.Genome Biology 2011, 12:R82
http://genomebiology.com/2011/12/8/R82
Page 4 of 12
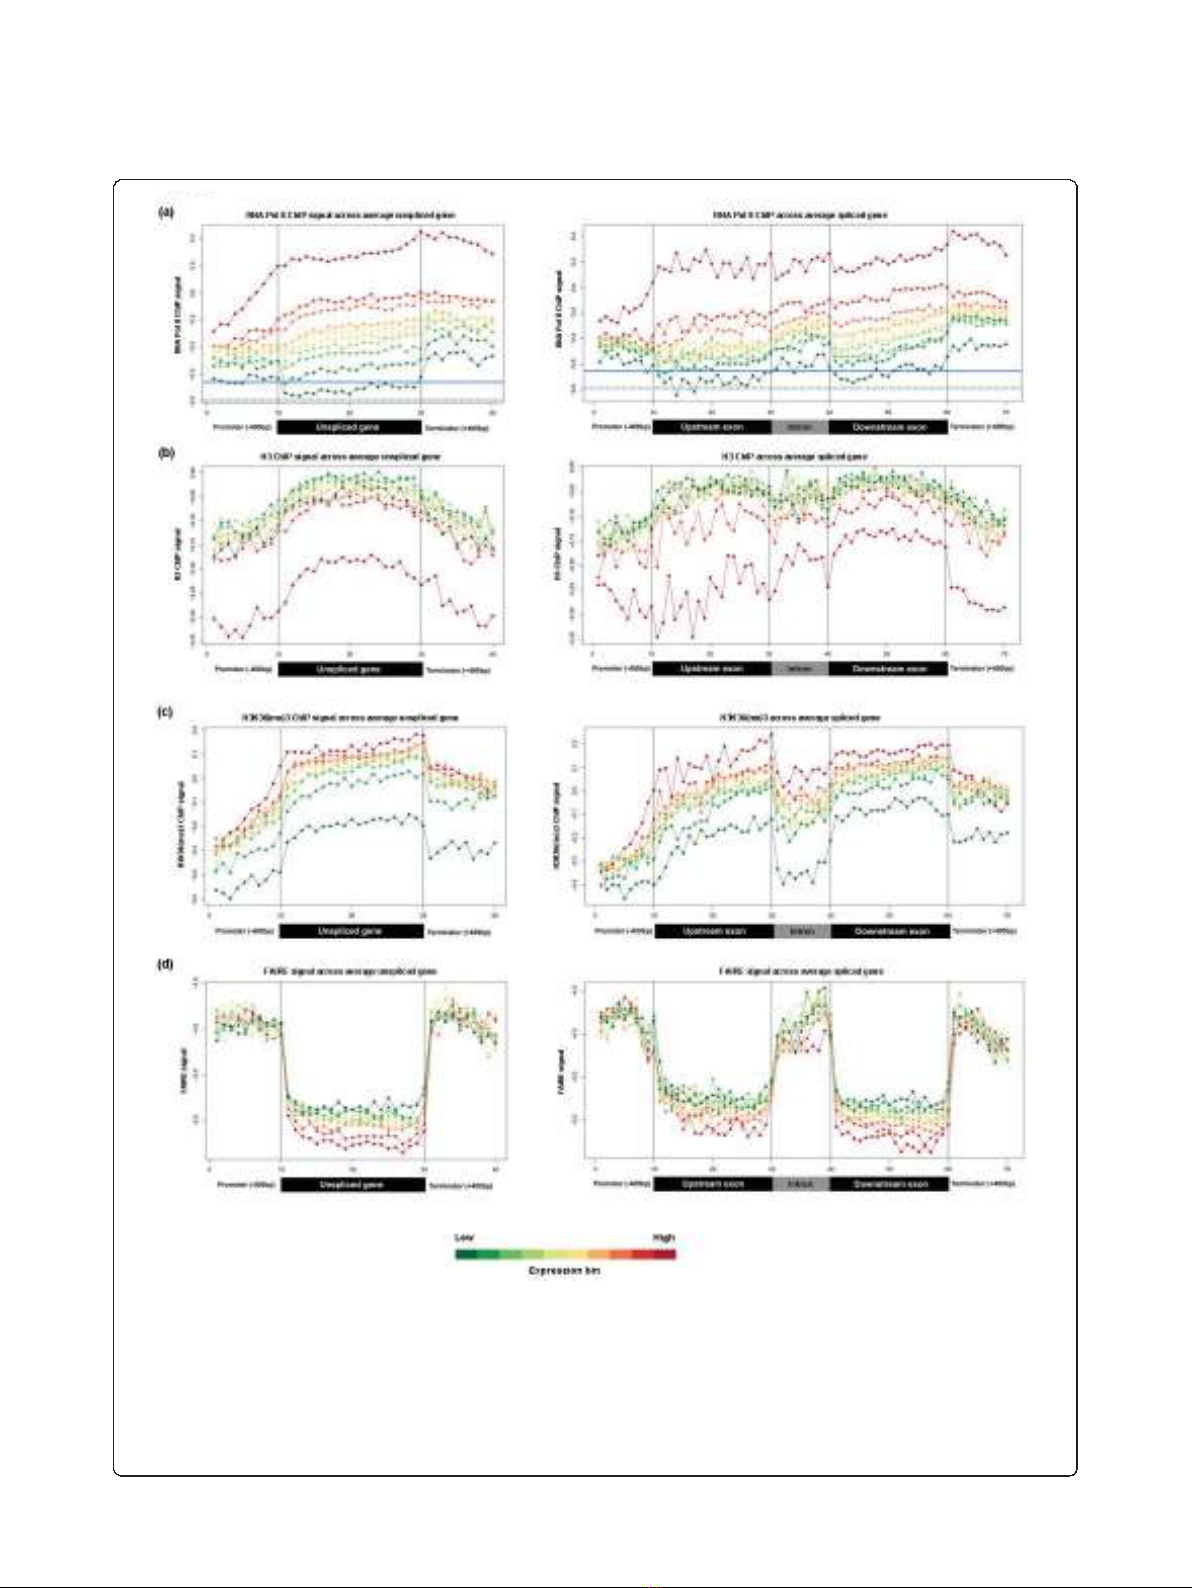
Figure 4 Profiles of transcription and chromatin-related patterns as a function of gene expression.(a-d) Probe signals for Pol II (a),
histone H3 (b), H3K36me3 (c), and FAIRE (d) were used to generate average spliced gene profiles that were grouped into ten ranked bins
based on Affymetrix expression data. Average values for each bin within each expression group were plotted on the same absolute scale for
each experiment type. For panel (a), the background level of RNA Pol II enrichment was estimated by calculating the average signal from all
probes (152,253) that fell outside of binned regions for analysis. This background average is shown as a horizontal blue solid line. Because some
atypically large untranslated regions and novel annotated regions will also contribute signal to this value, a second average (horizontal blue
dotted line) is shown where the top 10% of probes by signal (15,226) are removed. The red-to-green color bar at the bottom of the figure
depicts average expression levels of bins (red, high expression; green, low expression), and black vertical lines within each box demarcate
different sections within the average gene.
Wilhelm et al.Genome Biology 2011, 12:R82
http://genomebiology.com/2011/12/8/R82
Page 5 of 12


%20--%3e%3cdefs%3e%3cstyle%3e%20.st0%20{%20fill:%20%23fff;%20}%20.st1%20{%20fill:%20%237800fa;%20}%20%3c/style%3e%3c/defs%3e%3cpath%20class='st1'%20d='M117.78,12.18H43.11c2.9,3.47,4.65,7.94,4.65,12.82,0,5.6-2.3,10.66-6.01,14.29h76.02l7.22-13.56-7.22-13.56Z'/%3e%3cg%3e%3cpath%20class='st0'%20d='M53.58,26.17h-.59v-1.46h.59v-4.96h2.83c1.78,0,2.67.94,2.67,2.82v5.76c0,1.87-.89,2.81-2.67,2.81h-2.83v-4.96ZM55.36,21.37v3.34h1.1v1.46h-1.1v3.34h1.01c.61,0,.91-.37.91-1.1v-5.93c0-.74-.3-1.1-.91-1.1h-1.01Z'/%3e%3cpath%20class='st0'%20d='M65.99,31.14h-1.8l-.31-2.07h-2.19l-.31,2.07h-1.64l1.82-11.39h2.62l1.82,11.39ZM65.28,18.04c-.25.46-.51.77-.75.94-.21.15-.47.22-.79.22-.26,0-.57-.07-.92-.22l-.38-.15c-.14-.05-.26-.07-.37-.07-.3,0-.53.18-.71.54l-.91-.68c.25-.46.51-.77.75-.94.21-.14.48-.21.79-.21.26,0,.57.07.92.21l.38.15c.14.05.26.07.37.07.3,0,.53-.18.71-.54l.91.68ZM61.91,27.52h1.73l-.87-5.76-.87,5.76Z'/%3e%3cpath%20class='st0'%20d='M74.53,26.89v1.52c0,1.91-.89,2.86-2.67,2.86s-2.67-.95-2.67-2.86v-5.93c0-1.91.89-2.86,2.67-2.86s2.67.95,2.67,2.86v1.11h-1.69v-1.22c0-.75-.31-1.12-.93-1.12s-.93.37-.93,1.12v6.15c0,.74.31,1.11.93,1.11s.93-.37.93-1.11v-1.63h1.69Z'/%3e%3cpath%20class='st0'%20d='M81.4,31.14h-1.8l-.31-2.07h-2.19l-.31,2.07h-1.64l1.82-11.39h2.62l1.82,11.39ZM75.9,19.2l1.52-1.91h1.71l1.51,1.91h-1.61l-.76-.95-.75.95h-1.61ZM77.32,27.52h1.73l-.87-5.76-.87,5.76ZM83.1,15.99l-1.76,1.91h-1.26l1.17-1.91h1.86Z'/%3e%3cpath%20class='st0'%20d='M84.86,19.75c1.78,0,2.67.94,2.67,2.82v1.48c0,1.87-.89,2.81-2.67,2.81h-.85v4.28h-1.79v-11.39h2.64ZM84.01,21.37v3.86h.85c.58,0,.87-.36.87-1.08v-1.71c0-.71-.29-1.07-.87-1.07h-.85Z'/%3e%3cpath%20class='st0'%20d='M93.51,19.75c1.78,0,2.67.94,2.67,2.82v1.48c0,1.87-.89,2.81-2.67,2.81h-.85v4.28h-1.79v-11.39h2.64ZM92.66,21.37v3.86h.85c.58,0,.87-.36.87-1.08v-1.71c0-.71-.29-1.07-.87-1.07h-.85Z'/%3e%3cpath%20class='st0'%20d='M98.8,31.14h-1.79v-11.39h1.79v4.88h2.03v-4.88h1.83v11.39h-1.83v-4.88h-2.03v4.88Z'/%3e%3cpath%20class='st0'%20d='M105.36,24.55h2.46v1.62h-2.46v3.34h3.09v1.63h-4.88v-11.39h4.88v1.63h-3.09v3.18ZM108.17,17.29l-1.76,1.91h-1.26l1.17-1.91h1.86Z'/%3e%3cpath%20class='st0'%20d='M112.2,19.75c1.78,0,2.67.94,2.67,2.82v1.48c0,1.87-.89,2.81-2.67,2.81h-.85v4.28h-1.79v-11.39h2.64ZM111.35,21.37v3.86h.85c.58,0,.87-.36.87-1.08v-1.71c0-.71-.29-1.07-.87-1.07h-.85Z'/%3e%3c/g%3e%3ccircle%20class='st1'%20cx='25'%20cy='25'%20r='20'/%3e%3cpath%20class='st0'%20d='M32.78,19.27c2.92,0,4.43,2.55,5.28,5.33l.71,2.17c.14.38-.33.75-.71.75h-5.61c.19-.33.24-.71.09-1.08l-.75-2.45c-.43-1.32-.99-2.64-1.79-3.77.75-.57,1.65-.94,2.78-.94h0ZM25,18.38c3.25,0,4.9,2.78,5.89,5.89l.76,2.45c.14.42-.33.8-.8.8h-11.69c-.42,0-.94-.38-.8-.8l.75-2.45c.99-3.11,2.64-5.89,5.89-5.89h0ZM25,11.35c1.74,0,3.11,1.37,3.11,3.11s-1.37,3.11-3.11,3.11-3.11-1.41-3.11-3.11,1.41-3.11,3.11-3.11h0ZM17.27,19.27c1.08,0,1.98.38,2.73.94-.8,1.13-1.37,2.45-1.74,3.77l-.8,2.45c-.14.38-.05.75.09,1.08h-5.56c-.42,0-.9-.38-.75-.75l.71-2.17c.9-2.78,2.41-5.33,5.33-5.33h0ZM17.27,12.91c1.51,0,2.78,1.27,2.78,2.83s-1.27,2.83-2.78,2.83-2.83-1.27-2.83-2.83,1.27-2.83,2.83-2.83h0ZM32.78,12.91c1.56,0,2.78,1.27,2.78,2.83s-1.23,2.83-2.78,2.83-2.83-1.27-2.83-2.83,1.27-2.83,2.83-2.83h0ZM27.07,28.56v.09c0,.57-.24,1.08-.61,1.46h0v.05c-.38.33-.9.57-1.46.57s-1.08-.24-1.46-.61h0c-.38-.38-.61-.9-.61-1.46v-.09h1.41v.09c0,.19.05.38.19.47v.05c.09.09.28.19.47.19s.38-.09.47-.19v-.05c.14-.09.24-.28.24-.47t-.05-.09h1.41ZM30.99,28.56v.09c0,1.65-.66,3.16-1.74,4.24-1.08,1.08-2.59,1.79-4.24,1.79s-3.16-.71-4.24-1.79l-.05-.05c-1.04-1.08-1.7-2.55-1.7-4.2v-.09h1.41v.09c0,1.27.47,2.4,1.27,3.25h.05c.85.85,1.98,1.37,3.25,1.37s2.4-.52,3.25-1.37c.85-.8,1.37-1.98,1.37-3.25v-.09h1.37ZM34.99,28.56v.09c0,2.78-1.13,5.28-2.92,7.07-1.79,1.79-4.29,2.92-7.07,2.92s-5.23-1.13-7.07-2.92c-1.79-1.79-2.92-4.29-2.92-7.07v-.09h1.41v.09c0,2.4.94,4.53,2.5,6.08,1.56,1.56,3.72,2.5,6.08,2.5s4.52-.94,6.08-2.5c1.56-1.56,2.5-3.68,2.5-6.08v-.09h1.41Z'/%3e%3c/svg%3e)