
BioMed Central
Page 1 of 15
(page number not for citation purposes)
Retrovirology
Open Access
Research
Dynamics of viral replication in blood and lymphoid tissues during
SIVmac251 infection of macaques
Abdelkrim Mannioui1,2, Olivier Bourry1,2, Pierre Sellier1,2,3,
Benoit Delache1,2, Patricia Brochard1,2, Thibault Andrieu1,2, Bruno Vaslin1,2,
Ingrid Karlsson1,2, Pierre Roques1,2 and Roger Le Grand*1,2
Address: 1CEA, Division of Immuno-Virology, DSV/iMETI, Fontenay-aux-Roses, France, 2Université Paris-Sud 11, UMR E01, Orsay, France and
3Assistance Publique-Hôpitaux de Paris, Service de Médecine Interne A, Hôpital Lariboisière, France
Email: Abdelkrim Mannioui - abdelkrim.mannioui@cea.fr; Olivier Bourry - obourry@yahoo.fr; Pierre Sellier - pierre.sellier@lrb.aphp.fr;
Benoit Delache - benoit.delache@cea.fr; Patricia Brochard - patricia.brochard@cea.fr; Thibault Andrieu - thibault.andrieu@cea.fr;
Bruno Vaslin - bruno.vaslin@cea.fr; Ingrid Karlsson - IKS@ssi.dk; Pierre Roques - pierre.roques@cea.fr; Roger Le Grand* - roger.legrand@cea.fr
* Corresponding author
Abstract
Background: Extensive studies of primary infection are crucial to our understanding of the course
of HIV disease. In SIV-infected macaques, a model closely mimicking HIV pathogenesis, we used a
combination of three markers -- viral RNA, 2LTR circles and viral DNA -- to evaluate viral
replication and dissemination simultaneously in blood, secondary lymphoid tissues, and the gut
during primary and chronic infections. Subsequent viral compartmentalization in the main target
cells of the virus in peripheral blood during the chronic phase of infection was evaluated by cell
sorting and viral quantification with the three markers studied.
Results: The evolutions of viral RNA, 2LTR circles and DNA levels were correlated in a given
tissue during primary and early chronic infection. The decrease in plasma viral load principally
reflects a large decrease in viral replication in gut-associated lymphoid tissue (GALT), with viral
RNA and DNA levels remaining stable in the spleen and peripheral lymph nodes. Later, during
chronic infection, a progressive depletion of central memory CD4+ T cells from the peripheral
blood was observed, accompanied by high levels of viral replication in the cells of this subtype. The
virus was also found to replicate at this point in the infection in naive CD4+ T cells. Viral RNA was
frequently detected in monocytes, but no SIV replication appeared to occur in these cells, as no
viral DNA or 2LTR circles were detected.
Conclusion: We demonstrated the persistence of viral replication and dissemination, mostly in
secondary lymphoid tissues, during primary and early chronic infection. During chronic infection,
the central memory CD4+ T cells were the major site of viral replication in peripheral blood, but
viral replication also occurred in naive CD4+ T cells. The role of monocytes seemed to be limited
to carrying the virus as a cargo because there was an observed lack of replication in these cells.
These data may have important implications for the targeting of HIV treatment to these diverse
compartments.
Published: 23 November 2009
Retrovirology 2009, 6:106 doi:10.1186/1742-4690-6-106
Received: 10 August 2009
Accepted: 23 November 2009
This article is available from: http://www.retrovirology.com/content/6/1/106
© 2009 Mannioui et al; licensee BioMed Central Ltd.
This is an Open Access article distributed under the terms of the Creative Commons Attribution License (http://creativecommons.org/licenses/by/2.0),
which permits unrestricted use, distribution, and reproduction in any medium, provided the original work is properly cited.

Retrovirology 2009, 6:106 http://www.retrovirology.com/content/6/1/106
Page 2 of 15
(page number not for citation purposes)
Background
Viral RNA quantification in plasma provides important
insight into the natural course of HIV infection and is
widely used in both acute and chronic infection as a sur-
rogate marker for the evaluation of disease progression
[1,2]. Other markers such as viral DNA in peripheral
blood mononuclear cells (PBMC) have been used to pre-
dict disease progression from primary infection [3,4]. The
simultaneous determination of viral RNA in plasma and
viral DNA in PBMCs has been shown to be more robustly
related to clinical outcome [3,5]. These studies highlight
the importance of evaluating events occurring during pri-
mary infection to improve our understanding of HIV
pathogenesis.
It is difficult to study primary infection in humans, partic-
ularly those that concern the dynamics of viral infection in
deep tissues. Non-human primate models of HIV infec-
tion are therefore of particular importance. Only a few
studies have focused on these aspects. Mattapallil et al.
demonstrated, by quantifying SIV-gag DNA, that the high
levels of free virus in plasma at the peak of primary SIV
infection are associated with maximal viral spread and
high rates of viral replication in all lymphoid tissues [6].
Other studies have reported viral replication in gut-associ-
ated lymphoid tissue (GALT). Li et al. showed that the lev-
els of SIV mRNA in the GALT of SIV-infected macaques
decreased by a factor of 20 between peak plasma viral load
(PVL) and day 28 post infection (pi) [7]. The high levels
of viral replication in GALT at peak infection resulted in a
profound depletion of CD4+ T lymphocytes, which could
potentially lead to the immunodeficiency observed in the
long term. However, these studies addressed only the
short-term dynamics of viral replication in tissues with a
maximum follow-up of 28 days pi. The studies used only
RNA or total DNA viral markers. Viral RNA has classically
been used to evaluate viral replication or production,
whereas viral DNA is generally used to evaluate dissemi-
nation.
The 2LTR circular viral DNA is another viral marker. It is
an extrachromosomal product formed after the entry of
the virus into the target cell and following its reverse tran-
scription. This structure results from the circularization of
two long terminal repeats of linear viral DNA by cellular
DNA repair factors [8,9] in the absence of integration.
Despite the fact that contradictory studies have been
reported [10-13], the 2LTR circles are labile in vivo and
may therefore be used as an indicator of recently infected
cells [14].
We used cynomolgus macaques infected with SIVmac251
to study in detail the dynamics of viral replication in
peripheral blood and tissues during primary and early
chronic infection as well as its impact in the long term. We
studied both free virus levels in plasma and viral replica-
tion in lymphoid tissues from peak PVL to the set point,
both of which were two key dates for predicting the rate of
disease progression in the long term. We used a combina-
tion of three viral markers simultaneously to study in
detail viral dissemination and the dynamics of viral repli-
cation in tissues: viral DNA (indicating dissemination),
viral RNA (an indicator of viral replication and produc-
tion), and 2LTR circles (to identify recently infected cells)
[12,14-17].
Results
Determinations of viral RNA in plasma and of viral DNA
and 2LTR circles in PBMCs at the set point may predict the
long-term progression of SIV infection
We and others have previously evaluated the relevance of
viral RNA determinations in plasma for predicting disease
progression [18]. We monitored plasma viral RNA
(vRNA), total viral DNA (vDNA), and 2-LTR circle levels
in parallel in PBMCs from cynomolgus macaques inocu-
lated intravenously with SIVmac251 (Figure 1) for a more
precise characterization of viral dynamics during the first
few weeks of primary infection. We have demonstrated
that this virus is pathogenic in this species, and different
profiles of viral and immunological parameters could be
identified depending on the dose and route of inoculum
[18-21].
We intravenously injected two groups of six macaques
each with a high dose (5,000 AID50) or a low dose (50
AID50) of pathogenic SIVmac251 in order to generate dif-
ferent disease progression profiles. These infections gener-
ated two different profiles in terms of vRNA levels at set
point (day 100 pi): a group of rapidly progressing animals
with high plasma viral load (>105 vRNA copies/ml) and a
group of moderately progressing animals with a signifi-
cantly lower (p = 0.012) plasma viral load (<105 vRNA
copies/ml). This pattern was confirmed in the long term,
on day 226 pi, with plasma viral load continuing to
exceed 105 vRNA copies/ml and a significant decrease in
CD4 counts (p = 0.054; CD4+ = 324 ± 373) in the highly
viraemic group. The animals in the group with less than
105 vRNA copies/ml displayed slower disease progression
as demonstrated by the maintenance of high levels of
CD4 counts (CD4+ = 719 ± 281) (Figure 1). These data
are consistent with published data from our group and
other groups working on the same SIV-macaque model
[18,22,23].
MHC typing from individual animals of groups 5000 and
50 AID50 were performed and showed a relative homoge-
neity of haplotype class II. One animal of the progressor
group and two animals from 50 AID were haplotype H6
(data not shown) which is known to be associated with
low disease progression [24].
Retrovirology 2009, 6:106 http://www.retrovirology.com/content/6/1/106
Page 3 of 15
(page number not for citation purposes)
We investigated viral dissemination in the groups display-
ing rapid and moderate progression by following the
dynamics of viral DNA and 2LTR circles in PBMCs. At the
set point, as for vRNA in plasma, viral DNA and 2LTR cir-
cle levels in PBMC were significantly higher in the rapid
progression group (0.019 and 0.017 respectively) than in
the moderate progression group. Moreover, all the viral
parameters determined in peripheral blood (vRNA in
plasma, vDNA and 2LTR circles in PBMCs) increased sig-
nificantly earlier (day 7 pi) in the rapid progression group
than that in the moderate progression group (p = 0.016, p
= 0.033, p = 0.038, respectively) (Figure 1B-D). Thus, our
results confirm that the early spread and persistence of
high levels of viral replication in peripheral blood during
primary infection may predict rapid disease progression.
There was a significant, strong correlation between plasma
viral RNA levels and the levels of viral DNA or 2LTR circles
in PBMCs during infection (day 0 to 100 pi.), as deter-
mined by measuring the area under the curve (Spearman's
rank correlation test, p ≤ 0.0002 and p ≤ 0.0001, respec-
tively) (Figure 1E-F). Thus, during this period, viral DNA
and 2LTR circle levels in PBMC changed in the same man-
ner as plasma viral RNA levels.
Plasma viral load is correlated with viral replication in gut-
associated lymphoid tissue during SIVmac251 primary
infection in macaques
We extended this analysis to tissues to improve our under-
standing of the relationship between the kinetics of viral
replication in blood and viral dissemination in tissues at
peak of viremia and at the set point. We focused our anal-
ysis on the tissues thought to be the main sites of viral rep-
lication, such as digestive tract (ileum and rectum) and
secondary lymphoid (spleen, peripheral and mesenteric
LN) tissues.
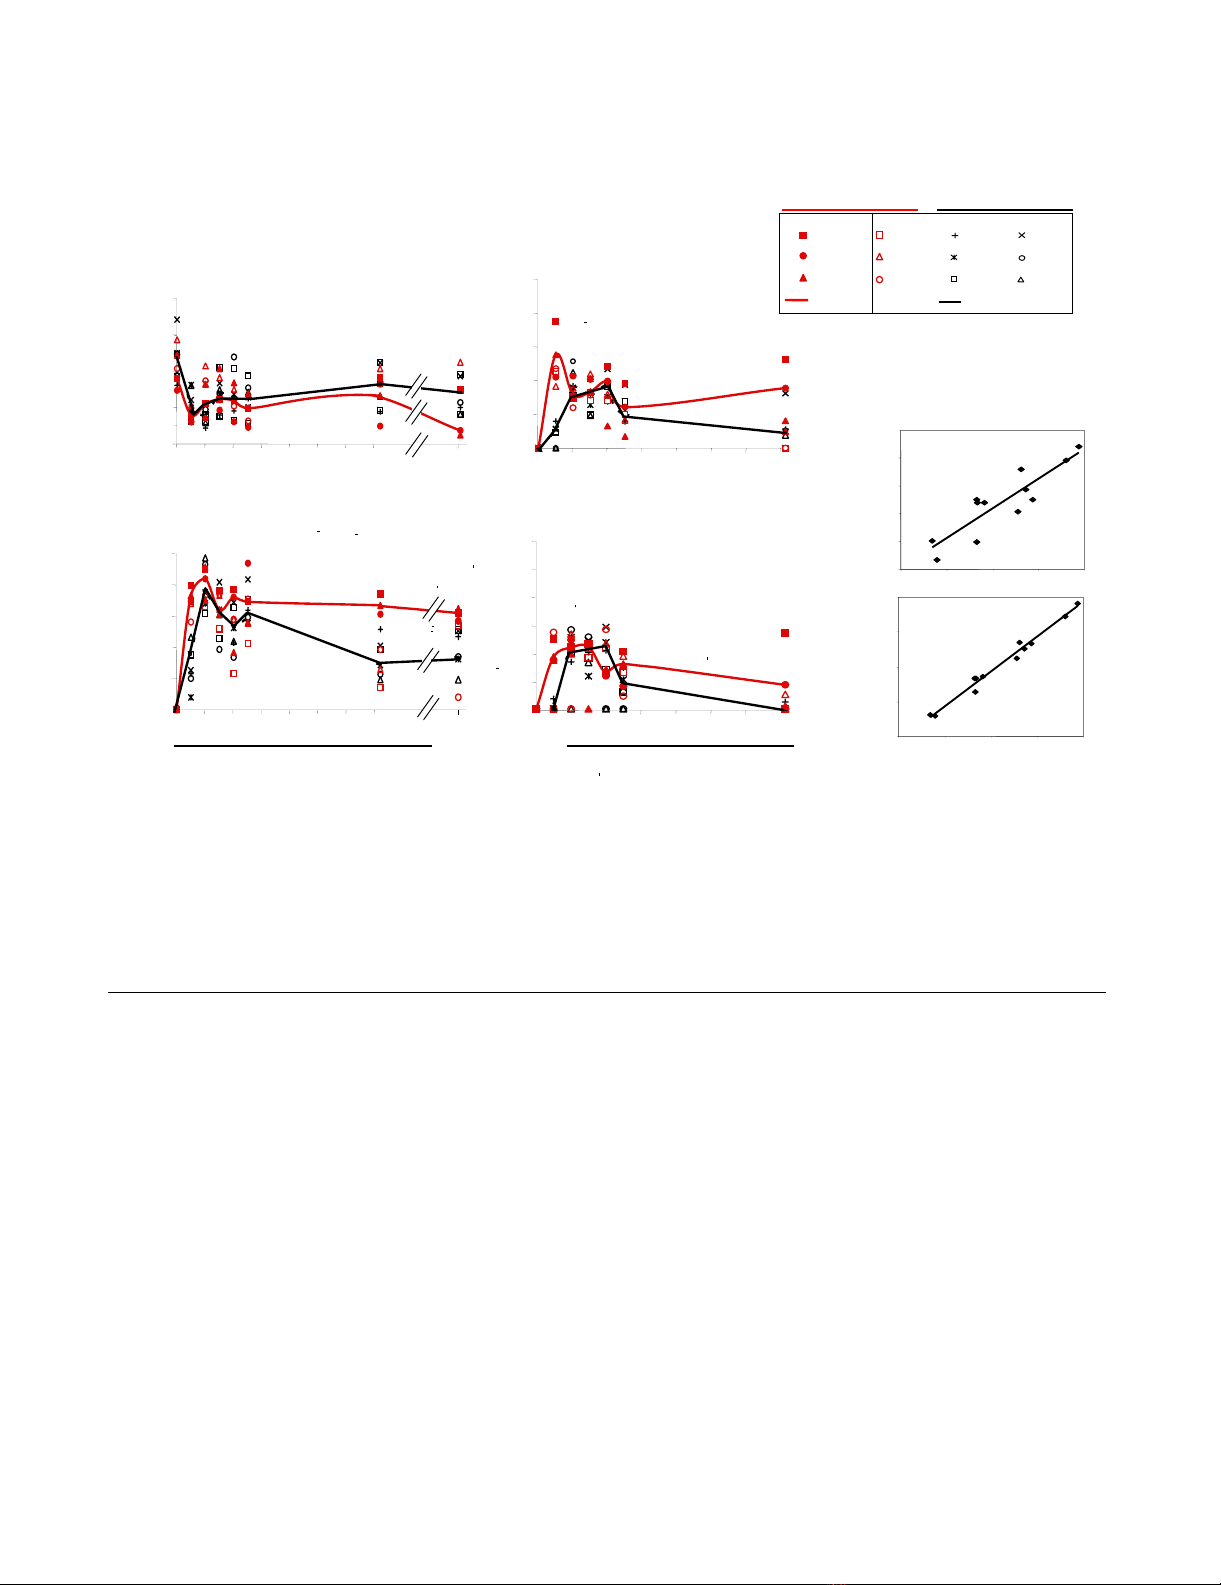
The dynamics of CD4+ T cells, viral replication and dissemination of the virus in the peripheral blood of SIV-infected macaquesFigure 1
The dynamics of CD4+ T cells, viral replication and dissemination of the virus in the peripheral blood of SIV-
infected macaques. We divided macaques into the low and high replication groups (black and red full lines, respectively),
regardless of the viral doses used for inoculation, and according to the level of plasma viral load at set point (day 100 pi. 105/ml
copies RNA). The symbols of macaques infected with low dose (50 AID50) and high dose (5,000 AID50) were represented by
black and red colors respectively. (A) Changes in absolute CD4+ T-cell counts in peripheral blood. (B-C-D) Changes in viral
RNA levels in plasma and viral DNA and 2LTR circle levels in the PBMCs. (E-F) Correlations between 2LTR circle levels and
viral DNA or plasma viral RNA levels.
10
2
>
10
3
10
4
10
5
10
6
10
7
10
1
>
10
2
10
3
10
4
10
5
10
6
10
7
0 14284256708498
viral DNA copies / 10
6
cells2-LTR copies / 10
6
cells
Total viral DNA in PBMCs
2-LTR levels in PBMCs
P=0.017
P=0.019
P=0.033
P=0.038
C.
D.
0
500
1 000
1 500
2 000
0 14284256708498
CD4+ T cells/μlviral RNA copies / ml
CD4+ circulating T lymphocytes
Plasma viral load
10
2
>
10
3
10
4
10
5
10
6
10
7
P=0.012
P=0.016
A.
Days post infection
B.
226
P=0.012
P=0.054
2LTR copies/10
6
PBMCs
AUC d0-100
6,5
7
7,5
8
8,5
9
99.510
10.5 11
plasma viral RNA
AUC d0-100
(RNA copies/ml)
P=0.0002
8
8,5
9
9,5
10
9 9.5 10 10.5 11
total viral DNA
AUC d0-100
DNA copies/10
6
PBMCs
P=<0.0001
2LTR copies/10
6
PBMCs
AUC d0-100
E.
F.
15729
15816
16834
20555
20784
20973
MED>10
5
MED<10
5
5000 AID50 50 AID50
15596
20483
20654
20525
20595 15693

Retrovirology 2009, 6:106 http://www.retrovirology.com/content/6/1/106
Page 4 of 15
(page number not for citation purposes)
Another group of fourteen macaques were infected with
50 AID50 of the same SIVmac251 viral stock. As expected,
they showed a pattern of moderate progression involving
a slow decrease in CD4 counts and PVL similar to that
observed in the majority of humans infected with HIV-1.
The animals were then euthanized, on day 14 (4 animals),
21 (4 animals), 28 (3 animals) or 100 (3 animals) pi (Fig-
ure 2A). For each animal, we simultaneously analysed
viral RNA levels in plasma and tissue and total viral DNA
and 2-LTR circle levels in both PBMC and tissues.
The immunological and virological patterns in peripheral
blood of these animals (Figure 2B-E) were similar (similar
curves for CD4+T-cell counts, plasma viral RNA, total
DNA and 2LTR circle levels) to that we previously
reported for macaques receiving the same dose of virus.
An analysis of viral RNA levels in plasma and tissues on
day 14 pi showed that peak plasma viral load was associ-
ated with a very high level of viral replication in all the tis-
sues explored (Figure 3). Parallel evaluations of both viral
DNA and 2LTR circles in PBMCs and tissues showed that
the cell-associated viral load peak in PBMCs was also
accompanied by high levels of viral dissemination in all
tissues (Figure 3). At this time point, no major difference
in the level of viral replication or dissemination was
observed between the different tissues (Figure 3). Thus, at
peak viraemia, viral replication and dissemination levels
were maximal in all lymphoid tissues. On day 21 post
infection, when plasma viral load began to decrease, we
observed a significant decrease in SIV RNA level in the
GALT, whereas SIV RNA levels remained stable in the
spleen and peripheral lymph nodes. The decrease in SIV
RNA levels in the GALT was associated with decreases in
the levels of both SIV DNA and 2LTR circles in this tissue
(Figure 3). We assumed, as previously reported for this
model, that the simultaneous decrease in all three markers
would result from the loss of infected cells in this com-
partment [25].
Plasma viral load was slightly lower on day 28 than on
day 21 pi, but viral RNA levels in all lymphoid tissues
remained roughly constant. Viral DNA and 2LTR circle
levels in PBMCs displayed a similar pattern (Figure 3).
By the set point, on day 100 pi, plasma RNA load was sig-
nificantly lower than on day 28 pi, and we observed small
numbers of infected cells and low levels of viral replica-
tion in the GALT, as demonstrated by the parallel
decreases observed in SIV RNA/DNA and 2LTR circle lev-
els in this compartment (Figure 3).
The analysis of viral RNA in the tissues by PCR was
enhanced by in situ hybridisation assays. We confirmed
that at day 14 dense collections of SIV RNA-positive cells
developed in the GALT and the spleen. The SIV RNA-pos-
itive cells decreased from day 21 to 28 in the GALT,
whereas they were still detectable in the spleen (Figure 4).
A qualitative assessment revealed at day 14 pi, that SIV
RNA-positive cells were detected in the GALT with no
preferential localization (such cells were detected in the
germinal centers as well as in the lamina propria), there-
after the SIV RNA-positive cells became localized mainly
in the lamina propria., SIV RNA-positive cells in the
spleen were essentially localized around germinal centers
and in the white pulp regardless of the date of infection
(Figure 4).
Because we observed parallel decreases in the number of
infected cells/level of viral replication in the GALT and
plasma viral load during primary infection with SIV, we
hypothesized that the GALT was the principal source of
the virus in the plasma. We tested this hypothesis by
assessing the correlation between viral production in each
tissue and plasma viral load during primary infection with
SIV. As expected, we found a very strong correlation
between SIV RNA level in the ileum or rectum and plasma
viral load (p = 0.0097 and p = 0.001, respectively) but no
correlation with viral load in other lymphoid tissues
(spleen: p = 0.17, peripheral LN: p = 0.097, mesenteric
LN: p = 0.81) could be established (Figure 5).
Levels of viral replication in peripheral blood during
chronic infection differ considerably between central
memory CD4+ T cells, naive CD4+ T cells and monocytes
We assessed the effect of viral load during primary infec-
tion on subsequent virus progression during the chronic
phase of infection. We chose six macaques from the mod-
erate progression group (with viral loads <105 copies
RNA/ml at set point). After two years of infection, we
investigated changes in viral and immunological parame-
ters in the peripheral blood. At that time, the macaques
had slightly higher plasma viral loads (mean = 3.7 ± 0.6,
100 days pi vs. 4.5 ± 0.4, 2 years pi.) and a markedly
higher cell-associated viral load (viral DNA mean = 2.6 ±
0.5, 100 days pi vs. 3.7 ± 0.3, 2 years pi; 2LTR circles mean
= 1.0 ± 0.1, 100 days pi vs. 2.2 ± 1.1, 2 years pi) when
compared to viral load at the set point. The proportion of
circulating CD4+ T cells and particularly of CD4+ central
memory lymphocytes was also lower (38 ± 6%, 100 days
pi vs. 15 ± 5%, 2 years pi.).
We therefore tried to identify the infected peripheral cells
in which active replication of the virus occurred. We
sorted naive lymphocytes (CD4+CD28highCD95low), cen-
tral memory lymphocytes (CD4+CD28highCD95high),
effector memory (CD4+CD28low CD95high) lymphocytes
and CD14+ monocytes (Figure 6), with a mean purity
higher than 96% (Table 1). In each cell subset we quanti-
fied viral RNA, total viral DNA, and 2LTR circles.
Retrovirology 2009, 6:106 http://www.retrovirology.com/content/6/1/106
Page 5 of 15
(page number not for citation purposes)
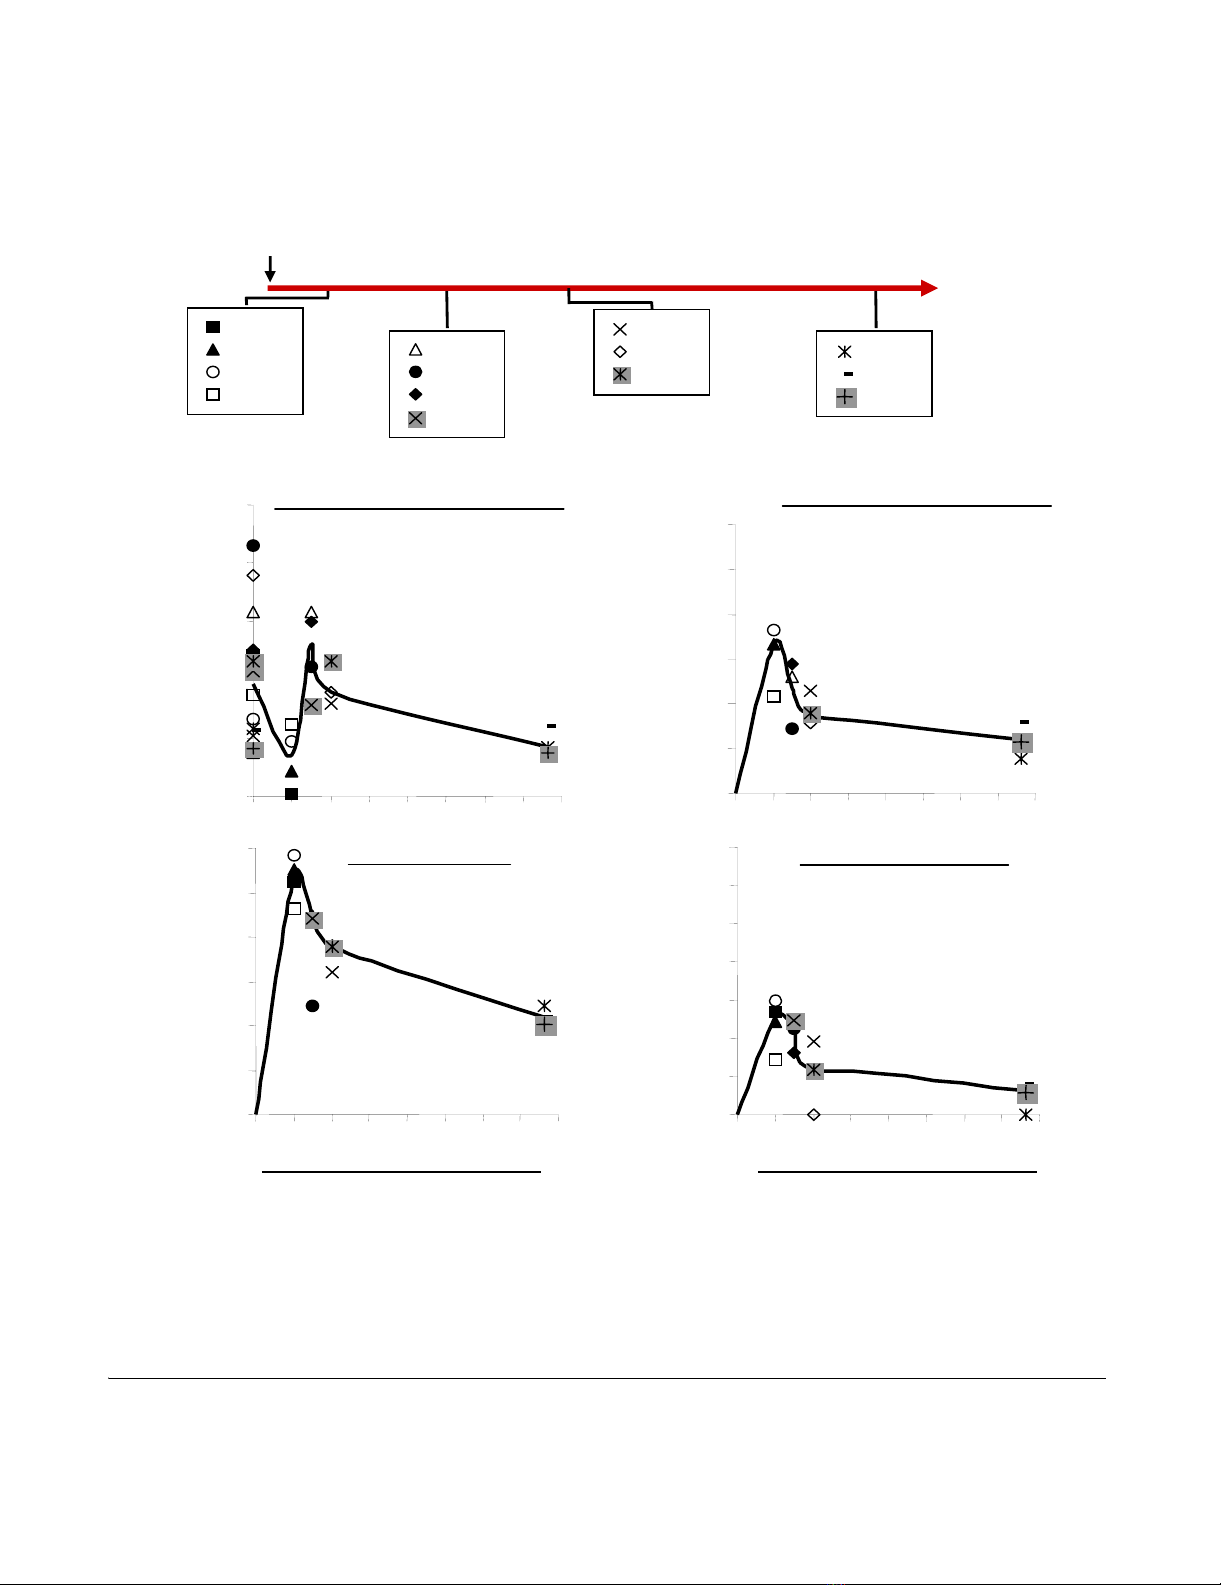
Changes in CD4+ T cell numbers as a function of viral replication and dissemination in the peripheral blood, in four groups of SIV-infected macaques during primary infectionFigure 2
Changes in CD4+ T cell numbers as a function of viral replication and dissemination in the peripheral blood, in
four groups of SIV-infected macaques during primary infection. (A) Protocol for SIV infection, evaluations, and the
euthanasia of each animal. Each box indicates the group of macaques explored at the corresponding times. (B) Changes in abso-
lute counts of total CD4+ T cells in peripheral blood. (C-D-E) Changes in viral RNA levels in plasma and viral DNA and 2LTR
circle levels in PBMCs. Bold lines indicate the mean value (B-D-C-E).
A.
0 14284256708498112
0
500
1000
1500
2000
2500
CD4+ T cells pe rμl
CD4+ circulating T lymphocytes
B.
10
2
>
10
3
10
4
10
5
10
6
10
7
10
8
viral RNA copies pe
ml
Plasma viral load
C.
10
2
>
10
3
10
4
10
5
10
6
10
7
10
8
viral DNA copies per 10
6
cells
Total viral DNA in PBMCs
D.
0 14 28 42 56 70 84 98 112
10
2
10
3
10
4
10
5
10
6
10
7
10
8
10
1
>
2-LTR copies per 10
6
cells
2-LTR levels in PBMCs
E.
Days post infection
Days of
eutanasie
Groups of
infected
macaques
SIVmac251
(50 AID50 IV)
14 21 28 106
13771
13927
13691
13382
14275
13070
13071
10092
9368
10043
9680
8102
8141
9345


%20--%3e%3cdefs%3e%3cstyle%3e%20.st0%20{%20fill:%20%23fff;%20}%20.st1%20{%20fill:%20%237800fa;%20}%20%3c/style%3e%3c/defs%3e%3cpath%20class='st1'%20d='M117.78,12.18H43.11c2.9,3.47,4.65,7.94,4.65,12.82,0,5.6-2.3,10.66-6.01,14.29h76.02l7.22-13.56-7.22-13.56Z'/%3e%3cg%3e%3cpath%20class='st0'%20d='M53.58,26.17h-.59v-1.46h.59v-4.96h2.83c1.78,0,2.67.94,2.67,2.82v5.76c0,1.87-.89,2.81-2.67,2.81h-2.83v-4.96ZM55.36,21.37v3.34h1.1v1.46h-1.1v3.34h1.01c.61,0,.91-.37.91-1.1v-5.93c0-.74-.3-1.1-.91-1.1h-1.01Z'/%3e%3cpath%20class='st0'%20d='M65.99,31.14h-1.8l-.31-2.07h-2.19l-.31,2.07h-1.64l1.82-11.39h2.62l1.82,11.39ZM65.28,18.04c-.25.46-.51.77-.75.94-.21.15-.47.22-.79.22-.26,0-.57-.07-.92-.22l-.38-.15c-.14-.05-.26-.07-.37-.07-.3,0-.53.18-.71.54l-.91-.68c.25-.46.51-.77.75-.94.21-.14.48-.21.79-.21.26,0,.57.07.92.21l.38.15c.14.05.26.07.37.07.3,0,.53-.18.71-.54l.91.68ZM61.91,27.52h1.73l-.87-5.76-.87,5.76Z'/%3e%3cpath%20class='st0'%20d='M74.53,26.89v1.52c0,1.91-.89,2.86-2.67,2.86s-2.67-.95-2.67-2.86v-5.93c0-1.91.89-2.86,2.67-2.86s2.67.95,2.67,2.86v1.11h-1.69v-1.22c0-.75-.31-1.12-.93-1.12s-.93.37-.93,1.12v6.15c0,.74.31,1.11.93,1.11s.93-.37.93-1.11v-1.63h1.69Z'/%3e%3cpath%20class='st0'%20d='M81.4,31.14h-1.8l-.31-2.07h-2.19l-.31,2.07h-1.64l1.82-11.39h2.62l1.82,11.39ZM75.9,19.2l1.52-1.91h1.71l1.51,1.91h-1.61l-.76-.95-.75.95h-1.61ZM77.32,27.52h1.73l-.87-5.76-.87,5.76ZM83.1,15.99l-1.76,1.91h-1.26l1.17-1.91h1.86Z'/%3e%3cpath%20class='st0'%20d='M84.86,19.75c1.78,0,2.67.94,2.67,2.82v1.48c0,1.87-.89,2.81-2.67,2.81h-.85v4.28h-1.79v-11.39h2.64ZM84.01,21.37v3.86h.85c.58,0,.87-.36.87-1.08v-1.71c0-.71-.29-1.07-.87-1.07h-.85Z'/%3e%3cpath%20class='st0'%20d='M93.51,19.75c1.78,0,2.67.94,2.67,2.82v1.48c0,1.87-.89,2.81-2.67,2.81h-.85v4.28h-1.79v-11.39h2.64ZM92.66,21.37v3.86h.85c.58,0,.87-.36.87-1.08v-1.71c0-.71-.29-1.07-.87-1.07h-.85Z'/%3e%3cpath%20class='st0'%20d='M98.8,31.14h-1.79v-11.39h1.79v4.88h2.03v-4.88h1.83v11.39h-1.83v-4.88h-2.03v4.88Z'/%3e%3cpath%20class='st0'%20d='M105.36,24.55h2.46v1.62h-2.46v3.34h3.09v1.63h-4.88v-11.39h4.88v1.63h-3.09v3.18ZM108.17,17.29l-1.76,1.91h-1.26l1.17-1.91h1.86Z'/%3e%3cpath%20class='st0'%20d='M112.2,19.75c1.78,0,2.67.94,2.67,2.82v1.48c0,1.87-.89,2.81-2.67,2.81h-.85v4.28h-1.79v-11.39h2.64ZM111.35,21.37v3.86h.85c.58,0,.87-.36.87-1.08v-1.71c0-.71-.29-1.07-.87-1.07h-.85Z'/%3e%3c/g%3e%3ccircle%20class='st1'%20cx='25'%20cy='25'%20r='20'/%3e%3cpath%20class='st0'%20d='M32.78,19.27c2.92,0,4.43,2.55,5.28,5.33l.71,2.17c.14.38-.33.75-.71.75h-5.61c.19-.33.24-.71.09-1.08l-.75-2.45c-.43-1.32-.99-2.64-1.79-3.77.75-.57,1.65-.94,2.78-.94h0ZM25,18.38c3.25,0,4.9,2.78,5.89,5.89l.76,2.45c.14.42-.33.8-.8.8h-11.69c-.42,0-.94-.38-.8-.8l.75-2.45c.99-3.11,2.64-5.89,5.89-5.89h0ZM25,11.35c1.74,0,3.11,1.37,3.11,3.11s-1.37,3.11-3.11,3.11-3.11-1.41-3.11-3.11,1.41-3.11,3.11-3.11h0ZM17.27,19.27c1.08,0,1.98.38,2.73.94-.8,1.13-1.37,2.45-1.74,3.77l-.8,2.45c-.14.38-.05.75.09,1.08h-5.56c-.42,0-.9-.38-.75-.75l.71-2.17c.9-2.78,2.41-5.33,5.33-5.33h0ZM17.27,12.91c1.51,0,2.78,1.27,2.78,2.83s-1.27,2.83-2.78,2.83-2.83-1.27-2.83-2.83,1.27-2.83,2.83-2.83h0ZM32.78,12.91c1.56,0,2.78,1.27,2.78,2.83s-1.23,2.83-2.78,2.83-2.83-1.27-2.83-2.83,1.27-2.83,2.83-2.83h0ZM27.07,28.56v.09c0,.57-.24,1.08-.61,1.46h0v.05c-.38.33-.9.57-1.46.57s-1.08-.24-1.46-.61h0c-.38-.38-.61-.9-.61-1.46v-.09h1.41v.09c0,.19.05.38.19.47v.05c.09.09.28.19.47.19s.38-.09.47-.19v-.05c.14-.09.24-.28.24-.47t-.05-.09h1.41ZM30.99,28.56v.09c0,1.65-.66,3.16-1.74,4.24-1.08,1.08-2.59,1.79-4.24,1.79s-3.16-.71-4.24-1.79l-.05-.05c-1.04-1.08-1.7-2.55-1.7-4.2v-.09h1.41v.09c0,1.27.47,2.4,1.27,3.25h.05c.85.85,1.98,1.37,3.25,1.37s2.4-.52,3.25-1.37c.85-.8,1.37-1.98,1.37-3.25v-.09h1.37ZM34.99,28.56v.09c0,2.78-1.13,5.28-2.92,7.07-1.79,1.79-4.29,2.92-7.07,2.92s-5.23-1.13-7.07-2.92c-1.79-1.79-2.92-4.29-2.92-7.07v-.09h1.41v.09c0,2.4.94,4.53,2.5,6.08,1.56,1.56,3.72,2.5,6.08,2.5s4.52-.94,6.08-2.5c1.56-1.56,2.5-3.68,2.5-6.08v-.09h1.41Z'/%3e%3c/svg%3e)