
METH O D Open Access
Multi-species integrative biclustering
Peter Waltman
1,2†
, Thadeous Kacmarczyk
3†
, Ashley R Bate
3
, Daniel B Kearns
4
, David J Reiss
5
, Patrick Eichenberger
3*
,
Richard Bonneau
1,2,3*
Abstract
We describe an algorithm, multi-species cMonkey, for the simultaneous biclustering of heterogeneous multiple-
species data collections and apply the algorithm to a group of bacteria containing Bacillus subtilis,Bacillus anthracis,
and Listeria monocytogenes. The algorithm reveals evolutionary insights into the surprisingly high degree of conser-
vation of regulatory modules across these three species and allows data and insights from well-studied organisms
to complement the analysis of related but less well studied organisms.
Background
The rapidly increasing volume of genome scale data has
enabled global regulatory network inference and gen-
ome-wide prediction of gene function within single
organisms. In this work, we exploit another advantage
of the growing quantity of genomics data: by comparing
genome-wide datasets for closely related organisms, we
can add a critical evolutionary component to systems
biology data analysis. Whereas several well-developed
tools exist for identifying orthologous genes on the basis
of sequence similarity, the identification of conserved
co-regulated gene groups (modules) is a relatively recent
problem requiring development of new methods. Here,
we present an algorithm that performs integrative
biclustering for multiple-species datasets in order to
identify conserved modules and the conditions under
which these modules are active. The advantages of this
method are that conserved modules are more likely to
be biologically significant than co-regulated gene groups
lacking detectable conservation, and the identification of
these conserved modules can provide a basis for investi-
gating the evolution of gene regulatory networks.
Clustering has long been a popular tool in analyzing
systems biology data types (for example, the clustering
of microarray data to generate putative co-regulated
gene groups). Most genomics studies employ clustering
methods that require genes to participate in mutually
exclusive clusters, such as hierarchical agglomerative
clustering [1], k-means clustering [2] and singular value
decomposition derived methods [3-5]. Because most
genes are unlikely to be co-regulated under every possi-
ble condition (for instance, bacterial genes can have
more than one transcription start site and, in that case,
each site will be regulated by a different set of transcrip-
tion factors depending on the cell’s state), defining
mutually exclusive gene clusters cannot capture the
complexity of transcriptional regulatory networks.
Clearly, sophisticated integrative methods are needed to
arrive at the identification of more mechanistically
meaningful condition-dependent conserved modules.
Biclustering refers to the simultaneous clustering of
both genes and conditions [6,7]. Early work [8] intro-
duced the idea of biclustering as ‘direct clustering’[9],
node deletion problems on graphs [10], and biclustering
[11]. More recently, biclustering has been used in sev-
eral studies to address the biologically relevant condition
dependence of co-expression patterns [6,12-19]. Addi-
tional genome-wide data (such as association networks
and transcription factor binding sites) greatly improves
the performance of these approaches [19-22]. Examples
include the most recent version of SAMBA, which
incorporates experimentally validated protein-protein
and protein-DNA associations into a Bayesian frame-
work [19], and cMonkey [20], an algorithm we recently
introduced.
cMonkey integrates expression and sequence data,
metabolic and signaling pathways [23], protein-protein
interactions, and comparative genomics networks
[24-26] to estimate condition dependent co-regulated
* Correspondence: pe19@nyu.edu; bonneau@nyu.edu
†Contributed equally
1
Computer Science Department, Warren Weaver Hall (Room 305), 251
Mercer Street, New York, NY 10012, USA
3
Center for Genomics and Systems Biology, Department of Biology, New
York University, Silver Building (Room 1009), 100 Washington Square East,
New York, NY 10003, USA
Full list of author information is available at the end of the article
Waltman et al.Genome Biology 2010, 11:R96
http://genomebiology.com/2010/11/9/R96
© 2010 Waltman et al.; licensee BioMed Central Ltd. This is an open access article distributed under the terms of the Creative
Commons Attribution License (http://creativecommons.org/licenses/by/2.0), which permits unrestricted use, distribution, and
reproduction in any medium, provided the original work is properly cited.

modules. We have previously shown that cMonkey can
be used to ‘pre-cluster’genes prior to learning global
regulatory networks [27]. Biclusters are iteratively opti-
mized, starting with a random or semi-random seed, via
a Monte Carlo Markov chain process. At each iteration,
each bicluster’s state is updated based upon conditional
probability distributions computed using the bicluster’s
previous state. This enables cMonkey to determine the
probability that a given gene or condition belongs in the
bicluster, dependent upon the current state of the
bicluster. The components of this conditional probabil-
ity (one for each of the different data types) are modeled
independently as P-values based upon individual data
likelihoods, which are combined to determine the full
conditional probability of a given gene or condition
belonging to a given bicluster.
Previous multi-species clustering methods generally
fall into two classes (for reviews see [17,28]). The first
class attempts to match conditions between species in
order to identify similarities and differences for a given
cell process [29-32]. By requiring matched conditions,
this approach is not well suited to large sets of public
experiments, as it is limited to only the conditions that
have direct analogs for both species. The second class of
multi-species clustering methods employs a strategy
where the datasets for each organism are reduced to a
unit-less measure of co-expression (for example Pear-
son’s correlation) and are then used to compare
co-expression patterns in multiple species [33-38]. This
second class includes methods analyzing the conserva-
tion of individual orthologous pairs [37,38] and those
seeking to identify larger conserved modules [33,34,36].
The common objective is to gain insight into the evolu-
tion of related species, including the role of duplication
in regulatory network evolution and the occurrence of
convergent evolution versus conserved co-expression
[35,38]. However, none of these studies can be consid-
ered a true multi-species biclustering algorithm; for
example, both Bergmann et al. [34] and Tanay et al.
[36] performed the analyses of the different species
sequentially. Furthermore, with the exception of Tanay
et al. [36], the methods were limited to considering only
expression data.
Below, we present multi-species cMonkey, a bicluster-
ing framework that enables us to integrate data across
multiple species and multiple data-types simultaneously.
Our approach maintains the independence of the organ-
ism-specific data while still allowing for true bicluster-
ing. Specifically, gene membership in multiple clusters is
possible and integration of a variety of data types
remains an integral part of the approach. Once the con-
served modules have been identified, our method further
allows the discovery of species-specific modifications
(which we term ‘elaborations’, that is, the addition of
species-specific genes that fit well with the conserved
core of the bicluster according to the multi-data score).
The ability to find species specific elaborations of con-
served co-regulated core sets of genes is a unique
strength of the method and is critical to understanding
the evolution and function of conserved modules.
Our multi-species biclustering method was applied to
all pairings that are possible for three closely related
species of Firmicutes: Bacillus subtilis,Bacillus anthracis
and Listeria monocytogenes. As one of the best-studied
bacterial model organisms, B. subtilis was selected due
to the wealth of publicly available genomic data and the
large amount of knowledge accumulated on this organ-
ism over the years. Additionally, B. subtilis and
B. anthracis have similar life cycles, alternating between
vegetative cell and dormant spore states [39-43]. The
third member of the triplet, L. monocytogenes,was
selected as it shares similar morphology and physiology
with B. subtilis and B. anthracis, but lacks the ability to
form spores. In addition, B. anthracis and L. monocyto-
genes are pathogenic species, while B. subtilis is
non-pathogenic. Evolutionarily, the Bacillus and Listeria
genera are estimated to have separated more than 1 bil-
lion years ago [44]. Analysis of the biclusters obtained
as a result of the procedure revealed several gene groups
of interest and led us to formulate new hypotheses
about the biology of these organisms. Specifically, we
were able to detect a temporal difference between the
two Bacillus species in the expression of a group of
metabolic genes involved in spore formation. Further-
more, the unexpected identification of a bicluster for
genes required for flagellum formation in B. anthracis
prompted us to re-examine the capacity for flagellar-
based motility in that species.
Results
In this section we provide a description and genome-
wide benchmarking of the multispecies integrative
biclustering method (or FD-MSCM for full-data multi-
species cMonkey). We compare our method to the ori-
ginal single-species cMonkey algorithm, a simple
k-means clustering method that has been adapted to
multi-species analysis and to several other single- and
multi-species biclustering algorithms. We will refer only
to analysis of pairs of organisms here and focus primar-
ily on the B. subtilis-B. anthracis pair. We note that the
method scales linearly with the number of species being
analyzed and can be extended to larger numbers of
organisms. The difficulties in validating biclustering per-
formance and the need to compare the algorithm to pri-
marily single species methods required that we initially
limit the scope of this work to the simpler pairwise case.
Lastly, we include examples of biologically significant
biclusters retrieved by the method.
Waltman et al.Genome Biology 2010, 11:R96
http://genomebiology.com/2010/11/9/R96
Page 2 of 23

Our method is composed of two sequential phases
(Figure 1): an initial step where conserved cores are
learned in a integrated multiple-species fashion and a
later step where species-specific features are added to
the conserved core (called the elaboration step). The
algorithm takes as input a matrix of normalized expres-
sion data for each organism (where each organism’s
data matrix may be normalized separately), upstream
sequences for all genes, and one or more networks for
each organism (in this case we used metabolic and sig-
naling pathways from the Kyoto Encyclopedia of Genes
and Genomes (KEGG), predicted co-membership in an
operon and phylogenetic profile networks). The experi-
mental datasets collected for each organism are
described fully in Additional file 1 (Tables S1 and S2 in
Additional file 1).
The method begins by randomly selecting a single
orthologous pair (for example, dnaA) around which to
buildaseedbicluster.Fortherandomlyselected
orthologous pair, conditions are chosen in each organ-
ism’s expression matrix where the orthologous gene
from that organism is most significantly differentially
expressed. The semi-random seed is completed by add-
ing the five to ten most correlated orthologous pairs
(for example, dnaN) to the randomly selected seed pair
(over the conditions defined in each species). This
heuristic seeding is required as most of the MSCM
score terms demand that a bicluster have three or
more genes in each organism to compute the scores
required for further iterations. Once seeded, ortholo-
gous gene pairs are then iteratively added to (for
example, sigH) or dropped from (for example, cwlH)
the growing bicluster using the multi-data/multi-
species score until no improvements can be made
(convergence). After a bicluster converges, new biclus-
ters are seeded and built from additional random seeds
until no significant biclusters can be found or a maxi-
mum number of biclusters is reached.
Biclusters are generated sequentially and the number
of biclusters to be optimized is chosen by the user.
Considering that initially optimized biclusters will be
unaffected by later biclusters, the number of biclusters
is set higher than the expected number of true co-
regulated modules. For each of the three possible spe-
cies pairs, we generated 150 biclusters in the shared
(multi-species) data-space that were then elaborated in
the single-species data-space. Thus, each bicluster con-
tains a conserved core (orthologous pairs that were
added based on the entire integrated dataset), and 0 or
more genes that were added during the elaboration
step (performed separately for each organism, based on
each single species dataset). A complete specification
of the method is given in the Materials and methods
section.
Genome-wide assessment of multi-species biclustering
performance
To validate MSCM, we compared it to several multi-
species and single-species methods (Table 1; Table S3 in
Additional file 1). Among the single-species methods,
we included the single-species version of cMonkey
(SSCM; which was previously shown to be competitive
with other biclustering methods [20]) as well as two
recent single-species biclustering methods, QUBIC
(QUalitative BIClustering algorithm) [45] and Coalesce
[22] (COAL). In addition, we compared our method to
a multi-species version of the biclustering Iterative Sig-
nature Algorithm (MSISA) [13], and two multi-species
clustering methods, a simple multi-species k-means
algorithm (MSKM) [46] and a balanced multi-species
k-means clustering method (BMSKM). We constructed
the BMSKM version to balance the disproportionate
size of expression datasets between the two species and
thereby perform a more meaningful comparison to
MSCM. We refer to the results as ‘shared’(SH) if we
restrict our analysis to orthologous pairs between the
two species and ‘elaborated’(EL) if a second step is used
to add species-specific genes, that is, MSCM-EL. When
possible, we evaluate both SH and EL results. In order
to remain consistent with the MSISA nomenclature
[13], we also use the terms ‘purified’(MSISA-P) and
‘refined’(MSISA-R), as these terms were used in the ori-
ginal work describing these methods. Descriptions of the
multi-species methods can be found in the Materials
and methods section. When evaluating integrative meth-
ods that take into account more than just expression
data (FD: full data) we also compare to expression-only
(EO) runs of each method. Our evaluation of the various
methods is based on two criteria: the ability to detect
statistically significant modules; and more importantly
to this work, the ability to identify conserved modules.
We show that MSCM produces biclusters that are a
good balance of coverage, functional significance, and
conservation, suggesting that the biclusters obtained by
this procedure are of greater biological significance.
Using multiple metrics for validating multi-species
biclustering
Validation and comparison of clustering methods
remains a difficult problem [20,47]. There is, as of yet,
no ‘solved’organism (that is, an organism whose full
regulatory network is known and experimentally vali-
dated) that can be used as a benchmark. Artificial data-
sets are also of limited value due to the complexity of
generating reasonable synthetic datasets (one would
have to generate sequences, expression data and net-
works, and make assumptions about the evolution of
these data-types). In the face of these challenges, several
criteria for judging the biological significance of gene
clusters have been implemented. We will focus on five
Waltman et al.Genome Biology 2010, 11:R96
http://genomebiology.com/2010/11/9/R96
Page 3 of 23
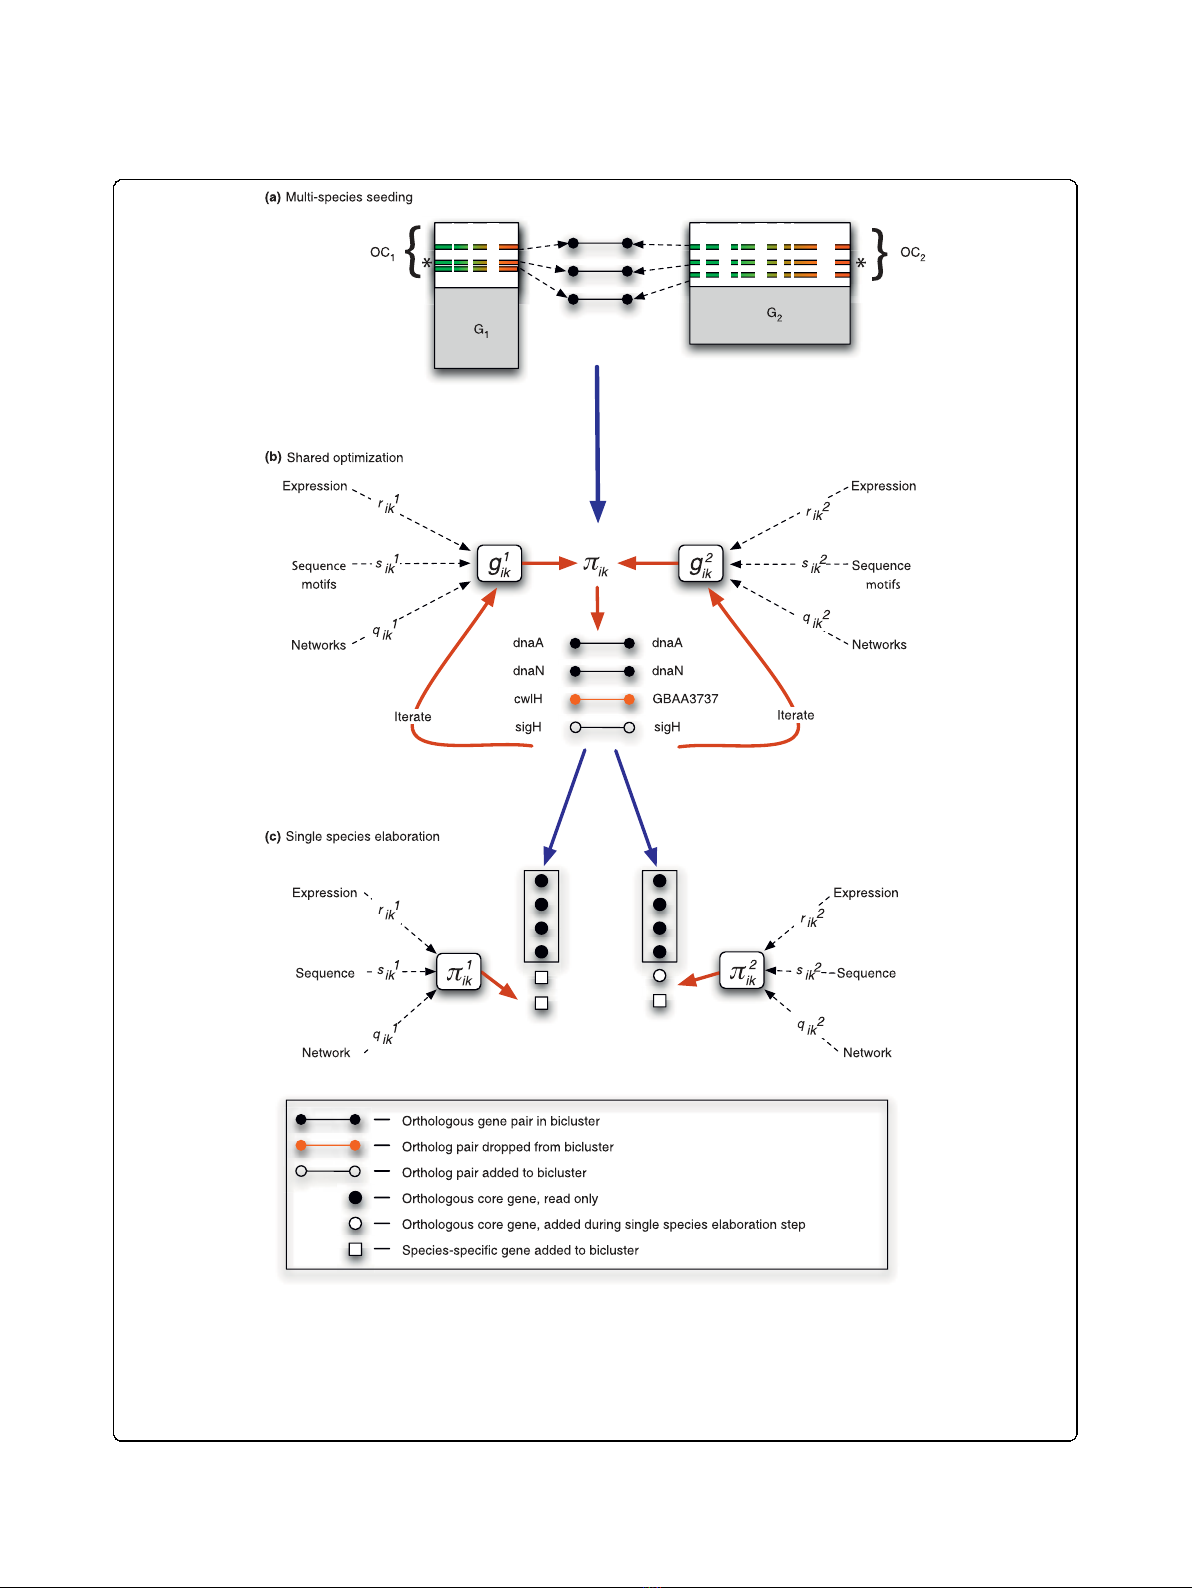
Figure 1 Schematic overview of the multiple-species method.(a) Shared-space bicluster seeds are generated by calculating the pairwise
correlation of the gene pairs to a randomly selected gene pair. (b) The shared-space multi-species optimization, where orthologous gene pairs
are iteratively added or dropped from the bicluster according to the multi-species multi-data score. (c) When completed, shared-space biclusters
are separated into their respective species, and further optimized during the elaboration step. During this step the genes from the original
shared-space bicluster are prevented from being dropped, as indicated by the boxes surrounding these genes (represented as black circles). OC,
orthologous core (the set of actively expressed orthologous genes shared between a group of organisms on which we run our multi-species
biclustering).
Waltman et al.Genome Biology 2010, 11:R96
http://genomebiology.com/2010/11/9/R96
Page 4 of 23

metric classes: 1) bicluster coherence; 2) functional
enrichment; 3) coverage; 4) overlap between biclusters;
and 5) conservation. We evaluate bicluster coherence
with five metrics that gauge the support of the three
data types cMonkey integrates, described further below
and in Additional file 1. We also assess the number of
biclusters that have a significant enrichment, considering
that enrichment metrics imply that co-functional and
interacting genes (by protein-protein or regulatory inter-
action) should have a higher probability of clustering.
Expression matrix coverage and overlap between biclus-
ters were calculated as the percentage of data-matrix
elements that can be in one or more biclusters (as
opposedtojustgenes).Gene-wisecomparisonscanbe
found in Additional file 1.
The last metric we consider, unique to multi-species
datasets, is the conservation of (bi)clustered genes
between the two species. Although we cannot know a
priori what percentage of co-regulated genes will be pre-
served, we can state for two closely related organisms
that: if two biclustering methods are equivalent (accord-
ing to all other metrics), then the more conserved
method is likely to be of higher biological significance;
and the conserved score between biclustering methods
should be well separated from a random background,
but still lower than 1. In addition, more distantly related
organisms should have less conserved co-regulation. By
strictly enforcing a perfect conservation between the
species, the two k-means variants (BMSKM and MSKM)
are good examples of methods that over-estimate the
degree of conservation between two species.
Figures 2 and 3 and Table 2 present this multiple-
metric comparison; Additional file 1 contains additional
details and associated methods supporting these com-
parisons as well as this multi-metric comparison
performed for the other two organism pairings. Given
the above metrics and evolutionary considerations, our
assessment of methods attempts to balance the five
metric classes above:
bicluster quality
data support 1 coherence 2 functi
−=
() ()
:,oonal enrichment
completeness 3 coverage 4 overl
⎡
⎣⎤
⎦×
() ()
:,aap
conservation 5 conservation score
⎡
⎣⎤
⎦×
()
⎡
⎣⎤
⎦
:
Comparing the degree of conserved co-regulation detected
by each method
A bicluster is considered to be perfectly conserved when
all of the orthologous genes from that bicluster are
found in a single bicluster in the related species. We
evaluated the ability of all the tested methods to identify
conserved biclusters using a metric similar to the F-sta-
tistic [48], which gauges the degree of recovery between
a bicluster in one species with that of the closest biclus-
ter in the other species. For the multi-species methods,
we calculated the metric using the shared bicluster for
one organism with its bicluster counterpart in the other.
Details of the procedure can be found in the Materials
and methods section.
Using this simple measure of conservation, we evalu-
ated the results from all the multi-species (MS) methods
with those from several single-species (SS) methods
(Table 2 displays the results for the B. subtilis-B.
anthracis pairing; see Tables S2 and S3 in Additional
file 1 for the others). With the exception of MSISA-R,
the MS methods displayed a far greater degree of con-
servation than any of the SS methods, with the shared
(SH) steps (and the equivalent MSISA-P step) having
perfect conservation, and the elaboration (EL) steps hav-
ing conservation scores >0.85. As they overestimate the
Table 1 Key to abbreviations used for methods tested
Expression only Full data
Shared space Full genome (elaboration) Shared space Full genome (elaboration)
Multi-species
cMonkey EO-MSCM-SH EO-MSCM-EL FD-MSCM-SH FD-MSCM-EL
ISA MSISA-P MSISA-R NA NA
k-means MSKM-SH MSKM-EL NA NA
(Balanced) k-means BMSKM-SH BMSKM-EL NA NA
Single-species
cMonkey EO-SSCM FD-SSCM
Coalesce EO-COAL FD-COAL
Qubic QUBIC NA
Tested methods are shown organized by main method (multi-species or single-species), data types used, and whether the analysis was performed over thefull
genome or restricted to only genes with orthologs across the species analyzed. ISA, Iterative Signature Algorithm; EO, expression only; MSCM, multi-species
cMonkey; SH, shared biclusters; MSISA, multi-species ISA; P, purified biclusters; MSKM, multi-species k-means; BMSKM, balanced multi-species k-means; EL,
elaborated biclusters; R, refined biclusters, applies only to the ISA algorithm (MSISA-R); FD, full data; SSCM, single-species cMonkey; COAL, Coalesce biclustering
method; QUBIC, QUalitative BIClustering algorithm.
Waltman et al.Genome Biology 2010, 11:R96
http://genomebiology.com/2010/11/9/R96
Page 5 of 23


![PET/CT trong ung thư phổi: Báo cáo [Năm]](https://cdn.tailieu.vn/images/document/thumbnail/2024/20240705/sanhobien01/135x160/8121720150427.jpg)


%20--%3e%3cdefs%3e%3cstyle%3e%20.st0%20{%20fill:%20%23fff;%20}%20.st1%20{%20fill:%20%237800fa;%20}%20%3c/style%3e%3c/defs%3e%3cpath%20class='st1'%20d='M117.78,12.18H43.11c2.9,3.47,4.65,7.94,4.65,12.82,0,5.6-2.3,10.66-6.01,14.29h76.02l7.22-13.56-7.22-13.56Z'/%3e%3cg%3e%3cpath%20class='st0'%20d='M53.58,26.17h-.59v-1.46h.59v-4.96h2.83c1.78,0,2.67.94,2.67,2.82v5.76c0,1.87-.89,2.81-2.67,2.81h-2.83v-4.96ZM55.36,21.37v3.34h1.1v1.46h-1.1v3.34h1.01c.61,0,.91-.37.91-1.1v-5.93c0-.74-.3-1.1-.91-1.1h-1.01Z'/%3e%3cpath%20class='st0'%20d='M65.99,31.14h-1.8l-.31-2.07h-2.19l-.31,2.07h-1.64l1.82-11.39h2.62l1.82,11.39ZM65.28,18.04c-.25.46-.51.77-.75.94-.21.15-.47.22-.79.22-.26,0-.57-.07-.92-.22l-.38-.15c-.14-.05-.26-.07-.37-.07-.3,0-.53.18-.71.54l-.91-.68c.25-.46.51-.77.75-.94.21-.14.48-.21.79-.21.26,0,.57.07.92.21l.38.15c.14.05.26.07.37.07.3,0,.53-.18.71-.54l.91.68ZM61.91,27.52h1.73l-.87-5.76-.87,5.76Z'/%3e%3cpath%20class='st0'%20d='M74.53,26.89v1.52c0,1.91-.89,2.86-2.67,2.86s-2.67-.95-2.67-2.86v-5.93c0-1.91.89-2.86,2.67-2.86s2.67.95,2.67,2.86v1.11h-1.69v-1.22c0-.75-.31-1.12-.93-1.12s-.93.37-.93,1.12v6.15c0,.74.31,1.11.93,1.11s.93-.37.93-1.11v-1.63h1.69Z'/%3e%3cpath%20class='st0'%20d='M81.4,31.14h-1.8l-.31-2.07h-2.19l-.31,2.07h-1.64l1.82-11.39h2.62l1.82,11.39ZM75.9,19.2l1.52-1.91h1.71l1.51,1.91h-1.61l-.76-.95-.75.95h-1.61ZM77.32,27.52h1.73l-.87-5.76-.87,5.76ZM83.1,15.99l-1.76,1.91h-1.26l1.17-1.91h1.86Z'/%3e%3cpath%20class='st0'%20d='M84.86,19.75c1.78,0,2.67.94,2.67,2.82v1.48c0,1.87-.89,2.81-2.67,2.81h-.85v4.28h-1.79v-11.39h2.64ZM84.01,21.37v3.86h.85c.58,0,.87-.36.87-1.08v-1.71c0-.71-.29-1.07-.87-1.07h-.85Z'/%3e%3cpath%20class='st0'%20d='M93.51,19.75c1.78,0,2.67.94,2.67,2.82v1.48c0,1.87-.89,2.81-2.67,2.81h-.85v4.28h-1.79v-11.39h2.64ZM92.66,21.37v3.86h.85c.58,0,.87-.36.87-1.08v-1.71c0-.71-.29-1.07-.87-1.07h-.85Z'/%3e%3cpath%20class='st0'%20d='M98.8,31.14h-1.79v-11.39h1.79v4.88h2.03v-4.88h1.83v11.39h-1.83v-4.88h-2.03v4.88Z'/%3e%3cpath%20class='st0'%20d='M105.36,24.55h2.46v1.62h-2.46v3.34h3.09v1.63h-4.88v-11.39h4.88v1.63h-3.09v3.18ZM108.17,17.29l-1.76,1.91h-1.26l1.17-1.91h1.86Z'/%3e%3cpath%20class='st0'%20d='M112.2,19.75c1.78,0,2.67.94,2.67,2.82v1.48c0,1.87-.89,2.81-2.67,2.81h-.85v4.28h-1.79v-11.39h2.64ZM111.35,21.37v3.86h.85c.58,0,.87-.36.87-1.08v-1.71c0-.71-.29-1.07-.87-1.07h-.85Z'/%3e%3c/g%3e%3ccircle%20class='st1'%20cx='25'%20cy='25'%20r='20'/%3e%3cpath%20class='st0'%20d='M32.78,19.27c2.92,0,4.43,2.55,5.28,5.33l.71,2.17c.14.38-.33.75-.71.75h-5.61c.19-.33.24-.71.09-1.08l-.75-2.45c-.43-1.32-.99-2.64-1.79-3.77.75-.57,1.65-.94,2.78-.94h0ZM25,18.38c3.25,0,4.9,2.78,5.89,5.89l.76,2.45c.14.42-.33.8-.8.8h-11.69c-.42,0-.94-.38-.8-.8l.75-2.45c.99-3.11,2.64-5.89,5.89-5.89h0ZM25,11.35c1.74,0,3.11,1.37,3.11,3.11s-1.37,3.11-3.11,3.11-3.11-1.41-3.11-3.11,1.41-3.11,3.11-3.11h0ZM17.27,19.27c1.08,0,1.98.38,2.73.94-.8,1.13-1.37,2.45-1.74,3.77l-.8,2.45c-.14.38-.05.75.09,1.08h-5.56c-.42,0-.9-.38-.75-.75l.71-2.17c.9-2.78,2.41-5.33,5.33-5.33h0ZM17.27,12.91c1.51,0,2.78,1.27,2.78,2.83s-1.27,2.83-2.78,2.83-2.83-1.27-2.83-2.83,1.27-2.83,2.83-2.83h0ZM32.78,12.91c1.56,0,2.78,1.27,2.78,2.83s-1.23,2.83-2.78,2.83-2.83-1.27-2.83-2.83,1.27-2.83,2.83-2.83h0ZM27.07,28.56v.09c0,.57-.24,1.08-.61,1.46h0v.05c-.38.33-.9.57-1.46.57s-1.08-.24-1.46-.61h0c-.38-.38-.61-.9-.61-1.46v-.09h1.41v.09c0,.19.05.38.19.47v.05c.09.09.28.19.47.19s.38-.09.47-.19v-.05c.14-.09.24-.28.24-.47t-.05-.09h1.41ZM30.99,28.56v.09c0,1.65-.66,3.16-1.74,4.24-1.08,1.08-2.59,1.79-4.24,1.79s-3.16-.71-4.24-1.79l-.05-.05c-1.04-1.08-1.7-2.55-1.7-4.2v-.09h1.41v.09c0,1.27.47,2.4,1.27,3.25h.05c.85.85,1.98,1.37,3.25,1.37s2.4-.52,3.25-1.37c.85-.8,1.37-1.98,1.37-3.25v-.09h1.37ZM34.99,28.56v.09c0,2.78-1.13,5.28-2.92,7.07-1.79,1.79-4.29,2.92-7.07,2.92s-5.23-1.13-7.07-2.92c-1.79-1.79-2.92-4.29-2.92-7.07v-.09h1.41v.09c0,2.4.94,4.53,2.5,6.08,1.56,1.56,3.72,2.5,6.08,2.5s4.52-.94,6.08-2.5c1.56-1.56,2.5-3.68,2.5-6.08v-.09h1.41Z'/%3e%3c/svg%3e)