
* Corresponding author.
E-mail addresses: smn.ghoreishi@isrc.ac.ir (S. M. N. Ghoreishi)
© 2019 Growing Science Ltd. All rights reserved.
doi: 10.5267/j.esm.2019.6.003
Engineering Solid Mechanics 7 (2019) 341-354
Contents lists available at GrowingScience
Engineering Solid Mechanics
homepage: www.GrowingScience.com/
esm
Experimental and numerical modal analysis of the first and second stage compressor blades
Seyed Mohammad Navid Ghoreishia*, Mohammad Salarib, Seyed Majid Pourhosseinic and Aram
Bahmanid
aSatellite Research Institute, Iranian Space Research Center, Tehran, Iran
bFaculty of Engineering, Department of Applied Mechanics, University of Qom, Qom, Iran
cFaculty of Mechanical Engineering, K.N. Toosi of Tech, Tehran, Iran
dDepartment of Mechanical and Mechateronics Engineering, University of Waterloo, Waterloo, Ontario, Canada
A R T I C L EI N F O A B S T R A C T
Article history:
Received 25 December, 2018
Accepted 17 June 2019
Available online
17
June
201
9
In this paper, the first and second stage compressor blades of a gas turbine were studied by the
experimental and numerical modal analyses. At first, the geometric models of these blades were
generated by the 3D scanner and then the mode shapes and the natural frequencies of each blade
were extracted by a series of numerical modal analyses. The numerical results were compared with
the data obtained from the experimental modal analysis and the validity and accuracy of the
developed numerical models were confirmed. Unlike most studies that use fixed-free boundary
condition for performing a modal analysis, this objective was pursued by applying a free-free
boundary condition. This study also investigated the effect of using wax or glue for mounting the
accelerometer on the blade by assessing the FRF curves obtained from the modal tests in the
frequency range of 0-10000 Hz. The sensitivity of the test results to applying free-free boundary
condition, the number of accelerometers and their positions were investigated by defining three
modal test configurations. The results obtained by these test configurations were compared with
the results of numerical analyses and finally, the best configuration for the modal test of the studied
compressor blade was determined.
© 2019 Growing Science Ltd. All rights reserved.
Keywords:
Compressor blade
Modal analysis
Natural frequency
Numerical analysis
Experimental analysis
1. Introduction
Blade failures could be caused by several mechanisms under the operating conditions of high
rotational speed at elevated temperature. In general, blade failures could be classified into two categories:
(a) fatigue, including both high cycle fatigue (HCF) and low cycle fatigue (LCF) (Burns, 1998; Sadowski
& Golewski, 2016; Shanyavskiy & Toushentsov, 2016; Walls & Cunningham, 1997) and (b) creep
rupture (Hou et al., 1999; Persson & Persson, 1993). The main failure mechanism in the compressor
blades is the high cycle fatigue (HCF). Numerous reports of failure of the first stage compressor blades
in frame-type gas turbines, such as at plants in China, Korea, USA and recently in Iran, show that similar
fractures are due to compressor design errors. The modal analysis is a powerful tool for detecting and
predicting fatigue failures in delicate components. The most important application of the modal analysis
is detection of natural frequencies and mode shapes of the blades. Recognition of these natural
frequencies can be useful to prevent the resonance effect and critical loads and resulting fatigue failures
and shows internal defects such as notch, crack, void and etc. In the usual modal analysis of the blades,

342
inspectors usually use a fixture to create fixed-free boundary conditions, but the time-consuming and
costly procedure of designing a proper fixture makes this method non-optimal. In addition, the non-
uniform or insufficient exertion of the support force upon the blade root can cause wobble, leading to
reduced rigidity and inaccurate measurement. In contrast, applying excessive force is likely to cause
damage and deformation in the blade root. Thus, attaining reliable and accurate results from this method
requires high-precision design and implementation of boundary conditions.
So far, according to the importance of modal analyses of blades, several efforts have been made to
evaluate the natural frequencies of blades (Bhat et al., 1996; Li et al., 2016; Marugabandhu & Griffin,
2003; Sinha & Turner, 2011; Wang et al., 2014; Yang et al., 2014). In this regard, Kim and Lee (2014)
have studied modal characteristics and fatigue strength of compressor blades. They estimated the natural
frequency of the first-, fifth-, and tenth-stage compressor blades, which varied in size and assembly
method. These authors in another research (Kim & Lee, 2013), have been studied modal characteristics
according to the tip shape and assembly condition of the turbine blade. Effects of natural frequencies on
the failure of R1 compressor blades have been discussed by Poursaeidi et al. (2012). They concluded that
the resonance of the blades under the first and second natural frequency modes is the primary cause of
the fatigue fractures of these blades. Vibration response analyses of a rotational shaft-disk-blade system
with blade-tip rubbing have been studied by Ma et al. (2016). Choi and Lee (2010) have studied the
failure of gas turbine blades. They observed that the fatigue fracture of the blade was originated during
transient events internal to the combustion chamber which was close to the resonance condition of the
assembled blades. In 2009, Witek (2009) examined the crack propagation in the helicopter turbo-engine
compressor blades. He selected a number of extensively used but apparently healthy compressor blades
(healthy in terms of presence of cracks and holes) and subjected them to their first mode of transverse
natural vibration, examining the resulting crack propagation rate. In the second part of this research, he
used a nonlinear finite element method to obtain the stress distribution during vibration and ultimately
reported that the maximum principal stress is located in the zone where the crack begins.
Different articles that have used numerical analyses to study the compressor blades have pursued this
objective through a wide variety of techniques, meshes, and modeling elements. In this regard, Hou et
al. (2002), who combined the finite element method with an experimental approach to study the effect of
blade root flexibility on the vibration characteristics of the gas turbine blades, used tetrahedral elements
due to geometrical complexity of the assessed blade. In the study conducted by Markowski et al. (2011),
which they modeled and analyzed the free vibrations of a gas turbine blade, authors meshed most part of
the model by "hex type" elements but completed the remaining parts by a combination of "wedge" and
"tetrahedral" elements. Assef and Mahfuz (2009) used sweep meshing technique by hex and wedge
elements in the ANSYS software to model and analyze the turbine blades. All these works indicate that
the type of element to be used must be selected based on the blade geometry and its complexity. Although
regular hex elements provide excellent precision and speed for FE analysis, the complexity of blade
geometry usually necessitates the use of tetrahedral elements implemented via a free meshing technique
to generate the model.
In this study, the natural frequencies of gas turbine blades were estimated by using a free-free
boundary condition in place of fixed-free condition used in conventional modal analyses. The free-free
boundary condition for the modal test can simplify the process of implementing boundary condition and
enhance the accuracy of modal analysis. The review of related works shows that most studies on this
subject first develop a simple geometric model, and then apply the results of the modal analysis to modify
it such that its results get sufficiently close to the experimental data. In the present study, the 3D scanned
models were employed to eliminate the process of trial and error normally needed to update and modify
the numerical model. This approach gives a direct high-precision technique in modeling. Also, a series
of modal tests were performed to validate the numerical model obtained for the first and second stage of
compressor blades. In addition, the effect of using glue and wax for mounting the accelerometers on the
blade was assessed, as these are the most common materials used in experimental modal tests for this
S. M. N. Ghoreishi et al.
/ Engineering Solid Mechanics 7 (2019)
343
purpose. To detect the cause of slight differences between the experimental and numerical results in some
vibration modes, the experimental modal tests with three different test configurations were repeated to
assess the sensitivity of results to boundary condition and the number and location of the accelerometers.
2. Numerical modal analysis of the first and second stage compressor blades
For modal and harmonic finite element analyses, the geometric model of each blade was created.
These models were obtained by converting the cloud points of the blades collected by a 3D-scanning
device to the resulting 3D models using the CATIA software. As mentioned, this method provides an
accurate and realistic model and eliminates the updating procedure of alternative numerical approaches.
Thereafter, the ABAQUS software was used to perform a modal numerical analysis on the first and
second stage blades. In these numerical analyses, a hex-dominant mesh with 8 nodes was used to model
the first stage blades and a Tet-dominant mesh with 10 nodes was used for the second stage blades. These
analyses were based on the assumptions of the free-free boundary condition. The material properties of
the FE models are listed in Table 1.
Table 1. Material properties for numerical modeling of the blades
Quantity
Value
Quantity
Value
Material
Titanium
Young's modulus
118 GPa
Density
4510 kg/m3
Poisson's ratio
0.36
2.1. Modal analysis
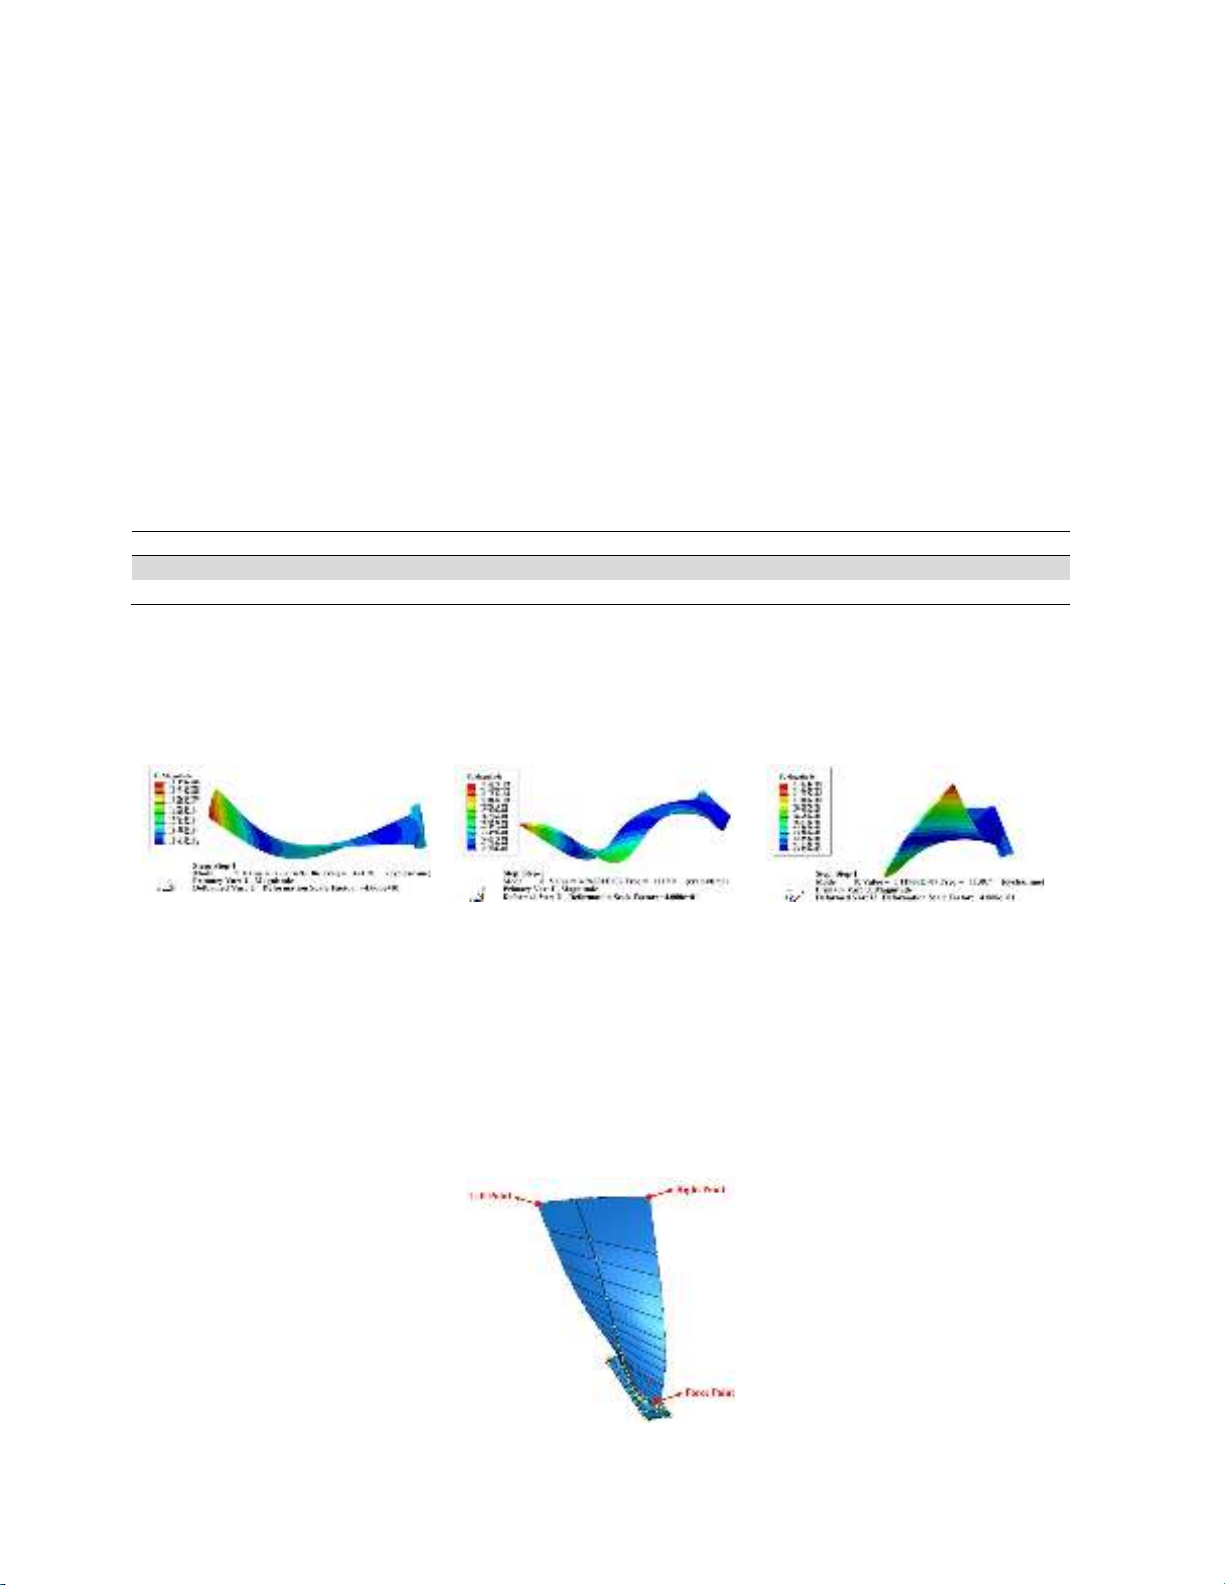
After omitting the rigid modes, the first three natural frequencies and mode shapes obtained for the
first stage blade are shown in Figs. 1 to 3.
Fig. 1. The first mode shape of the first
stage blade
Fig. 2. The second mode shape of the
first stage blade
Fig. 3. The third mode shape of the
first stage blade
The first and second modes are the first and second bending modes and the third mode is the first
torsional mode. Three first modes are important because of two reasons. The first reason is the amplitude
of natural frequency after the third mode is much higher than the working frequency of the blade and the
second reason is related to the tip displacement of the blade which is too low after the third mode. The
dynamic numerical analysis of the first stage blade was performed in the frequency range of 250 to 1250
Hz. In this analysis, the three points shown in Fig. 4 were subjected to a transverse sinusoidal force of 5
N applied with varying frequency (within the mentioned frequency range) along X-axis. The obtained
frequency response function (FRF) curves are shown in Fig. 5.
Fig. 4. The points of application of the sinusoidal force.
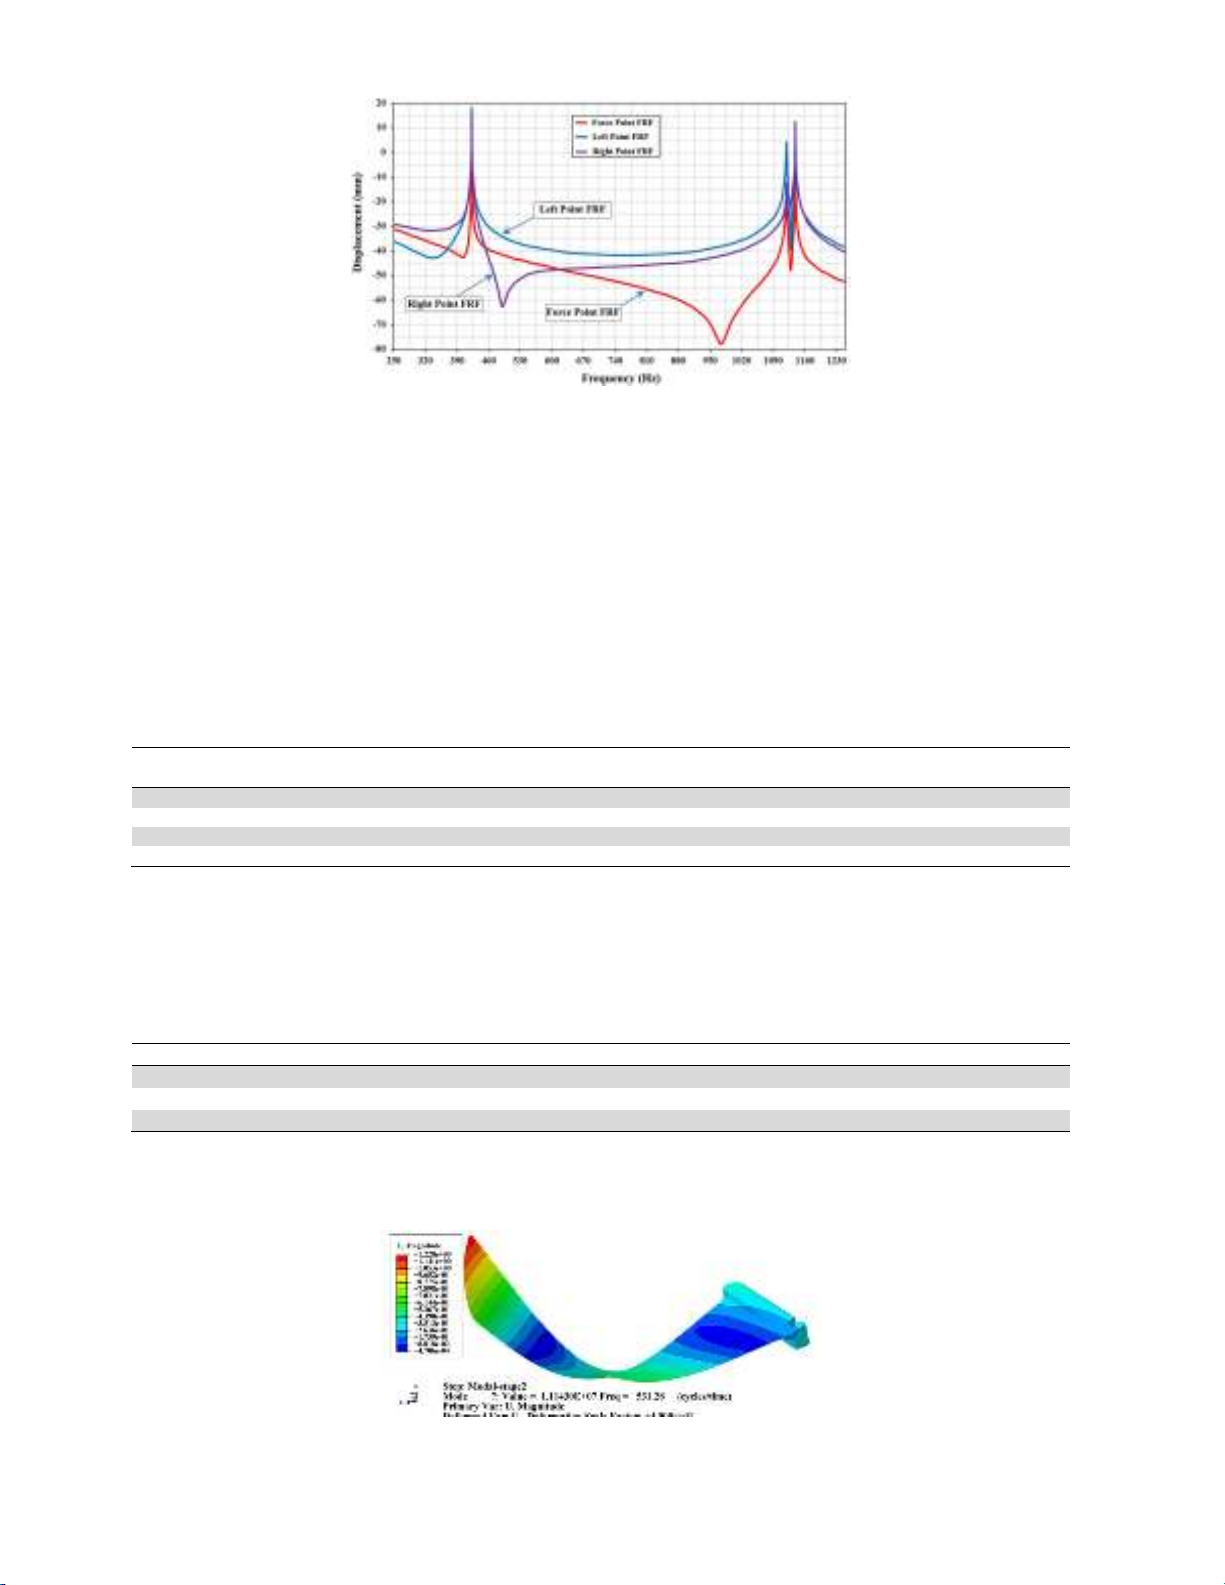
344
Fig. 5. The FRF curves of the three points defined on the first stage blade.
2.2. Model verification
To assess the sensitivity of the results to the type of the mesh element and verify the FEA model,
ABAQUS and COMSOL software were used to conduct a series of numerical modal analyses with
triangle meshes. The results of all numerical analyses are shown in Table 2. As Table 2 shows, the results
of the modal and harmonic analysis, both conducted with structural meshing on the first stage blade are
very close to each other and have an error of less than 0.1%, which points to the validity of these analyses.
Natural frequencies obtained by the modal analysis with structural meshing have 1 to 2% difference with
those obtained by free meshing. The difference between the results of the modal analyses conducted in
ABAQUS and COMSOL is less than 0.5%, reflecting the accuracy of the performed numerical analyses.
Table 2. Numerical results of the natural frequencies for the first stage blade
Type of analysis First natural
frequency (Hz)
Second natural
frequency (Hz)
Third natural
frequency (Hz)
Modal analysis with structural meshing (ABAQUS)
421.91
1119
1138.7
Modal analysis with free meshing
(ABAQUS)
429.25
1128.3
1143.1
Harmonic analysis with structural meshing (ABAQUS)
422
1118
1139
Modal analysis with free meshing (COMSOL)
429.32
1128.43
1143.34
All numerical modal analyses conducted on the model of the first stage blade were also repeated on
the geometric model developed for the second stage blades. Three different second stage blades were
used for analyses. These blades are named with the codes listed in Table 3 and will be hereafter referred
to by those names.
Table 3. The codes of the second stage blades were used for analyses
Blade number
Code of blade
1
ST#2
-
01
2
ST#2
-
02
3
ST#2
-
03
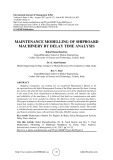
For example, the first mode shape of the blade ST#2-02 is shown in Fig. 6. As Fig. 6 shows, this mode
is transversal and its first natural frequency is 531.28 Hz.
Fig. 6. The first mode shape of blade ST# 2-02.
S. M. N. Ghoreishi et al.
/ Engineering Solid Mechanics 7 (2019)
345
3. Experimental modal analysis of the first and second stage compressor blades
The experimental modal analyses were performed to determine the modal characteristics of the
system. These analyses were used to extract and report the first three natural frequencies of the first stage
blade. Comparing the results of the modal test with those of numerical analyses can demonstrate the
accuracy of the numerical model and provide the necessary basis for investigating other operational
factors such as mechanical and thermal shock, heat transfer, forced vibrations and etc. Also, the modal
analysis method will be modified and validated according to FEM results. This procedure will be cost
effective and reduces fixture design and fabrication costs.
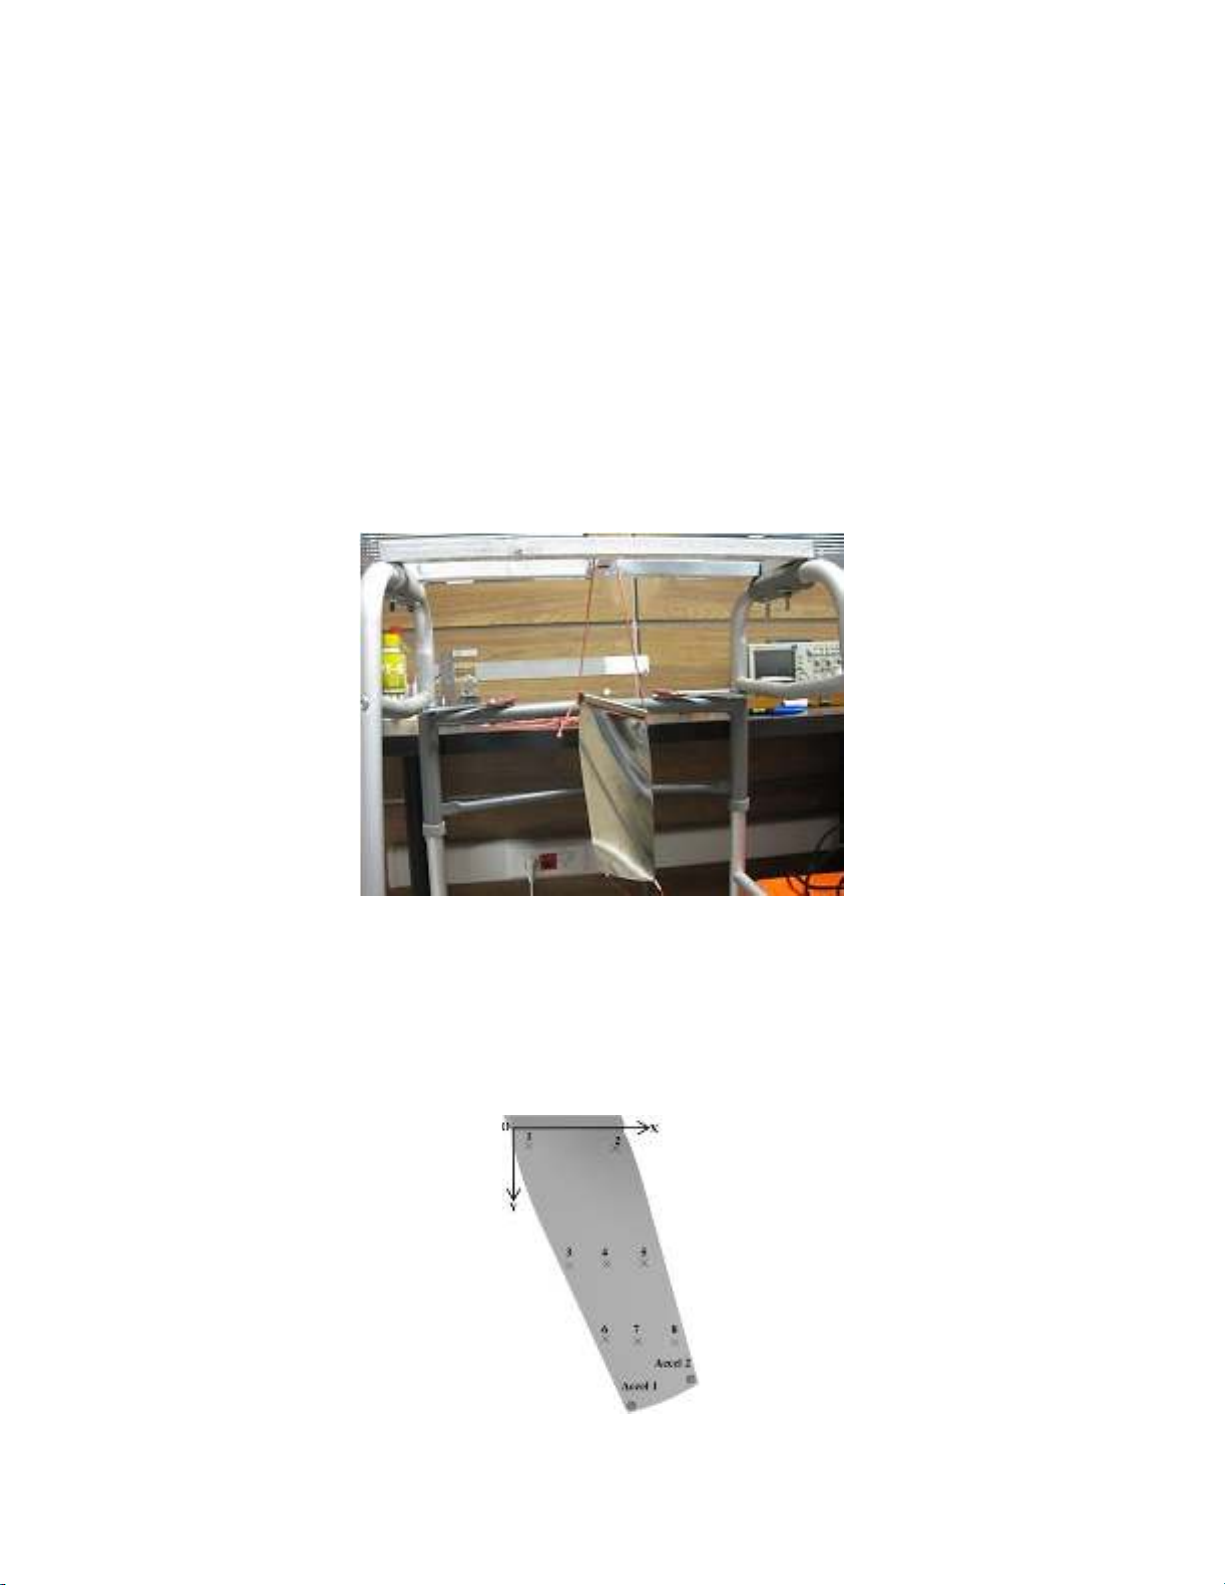
All tests to be described here were based on free-free boundary conditions. In all these tests, an impact
hammer was used to make an input and the resulting outputs were recorded by the accelerometers
mounted on the blade. The results of the modal tests were converted to frequency response function
(FRF) curves to facilitate the investigations. In the test performed on the first stage blade, the desired
inputs were applied by a B&K 8202 modal hammer on the blade that was suspended by an elastic string
to emulate free-free boundary condition (Fig. 7).
Fig. 7. The free-free boundary condition emulated by suspending the blade by an elastic string
The schematic pattern for the location of applied force and accelerometers mounted on the first stage
blade is shown in Fig. 8. As Fig. 8 shows, the force was applied to the points 1 to 8, and then two
miniature piezoelectric accelerometers Endevco® model 2222C were used to record the outputs at the
points Accel 1 and Accel 2 that located at the tip of the blade. The process of applying force on each
point was repeated 10 times and the recorded responses were averaged to obtain the final output. In these
tests, the module Endevco® model 133 was used as a vibrating signal conditioner and the module NI-
4431 was used for dynamic signal acquisition.
Fig. 8. The schematic pattern for location of the applied force and accelerometers mounted on the first stage blade


![Tài liệu học tập Hệ thống điều khiển điện - khí nén và thủy lực [mới nhất]](https://cdn.tailieu.vn/images/document/thumbnail/2021/20211005/conbongungoc09/135x160/811633401135.jpg)
![Tính chọn lắp ghép tiêu chuẩn giữa áo trục và trục chân vịt tàu thủy [chuẩn nhất]](https://cdn.tailieu.vn/images/document/thumbnail/2021/20210219/caygaocaolon10/135x160/5291613732560.jpg)


![Bài giảng Vi điều khiển Nguyễn Huy Hoàng: Tổng hợp kiến thức [Chuẩn nhất]](https://cdn.tailieu.vn/images/document/thumbnail/2026/20260316/hoatrami2026/135x160/72211773806757.jpg)


![Bài giảng Tự động hoá thiết bị điện [chuẩn nhất]](https://cdn.tailieu.vn/images/document/thumbnail/2026/20260312/hoabattu2026/135x160/61691773631881.jpg)
