Tuyển tập Hội nghị Khoa học thường niên năm 2015. ISBN: 978-604-82-1710-5
338
A NUMERICAL STUDY ON FLOOD INUNDATION IN A COASTAL
URBAN AREA: APPLICATION TO CHANGWON CITY, KOREA
Woochang Jeong1
1Associate Professor, Department of Civil Engineering, Kyungnam University, Changwon
1. INTRODUCTION
In this study, the simulation and analysis
for the inundation in a coastal urban area
according to the storm surge height are
carried out using a two-dimensional finite
volume model with a well-balanced and
HLLC schemes (Jeong, 2015). The target
coastal urban area considered in this study is
a part of the new town of Changwon city,
Gyungnam province, Korea and this area was
extremely damaged due to the storm surge
generated during the period of the typhoon
"Maemi" in September 2003. For the purpose
of the verification of the numerical model
applied in this study, the simulated results are
compared and analyzed with the temporal
storm surge heights observed at the tide
station in Masan bay and inundation traces in
an urban areas. Moreover, in order to
investigate the influence of super typhoons
possible in the future, the results simulated
with the storm surge heights increased 1.25
and 1.5 times greater than those observed
during the period of the typhoon "Maemi" are
compared and analyzed.
2. SIMULATION RESULTS
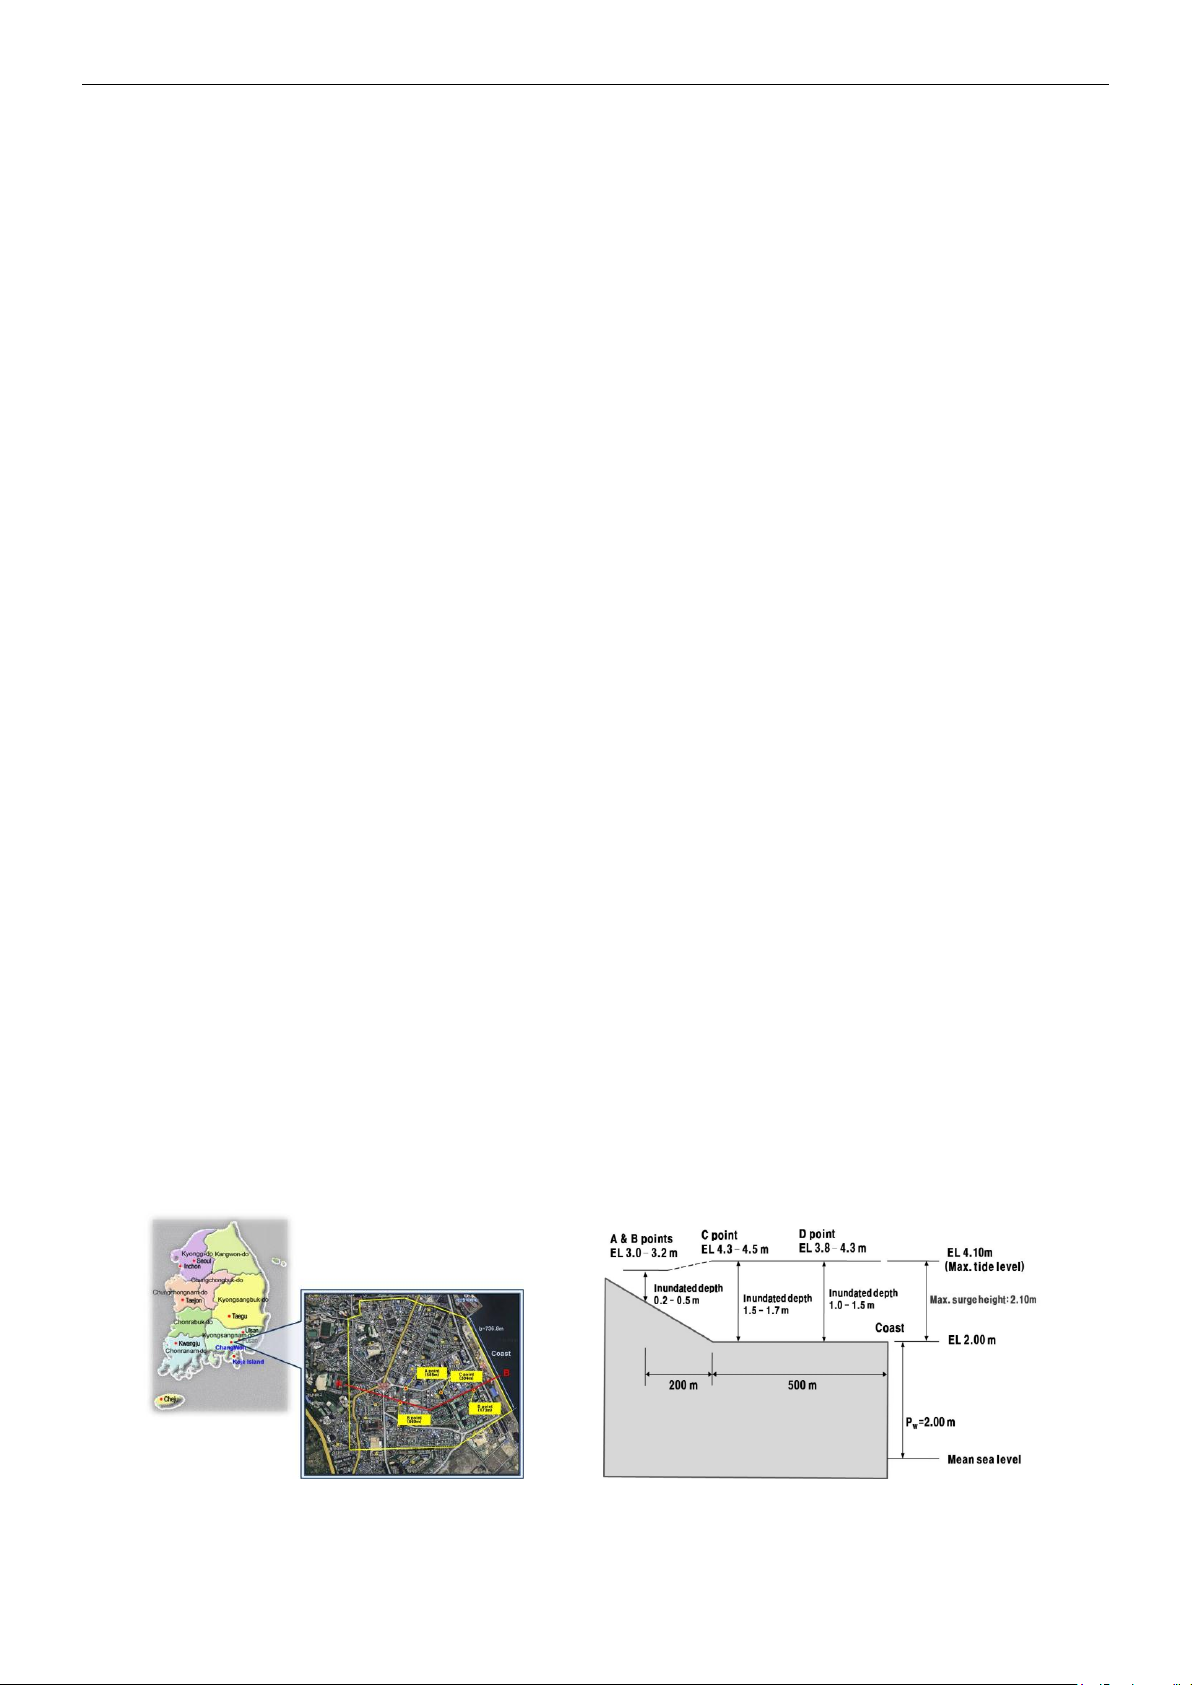
The target coastal urban area is a part of
new town of Changwon city which is located
on the southern coast of the Korea and Masan
Bay (Figure 1(a)). This town was extremely
damaged by high tides and storm surge
during the typhoon "Maemi" from September
12 to 13 in 2003. The major points with
records of inundation traces are A, B, C, and
D, which are located at 660, 569, 394, and
173 m, respectively, from the coast. Figure
1(b) shows the cross-sectional diagram of the
area along A-B line in Figure 1(a), and the
range of inundated water depth surveyed at
each point. Point D, which is the closet to the
coast, was recorded to be inundated
approximately 1.0~1.5 m, point C was
inundated 1.5~1.7 m, and points A and B
were inundated 0.2~0.5 m.
a) b)
Figure 1. Target coastal urban area (a) and schematic cross-section along A-B line (b).
Tuyển tập Hội nghị Khoa học thường niên năm 2015. ISBN: 978-604-82-1710-5
339
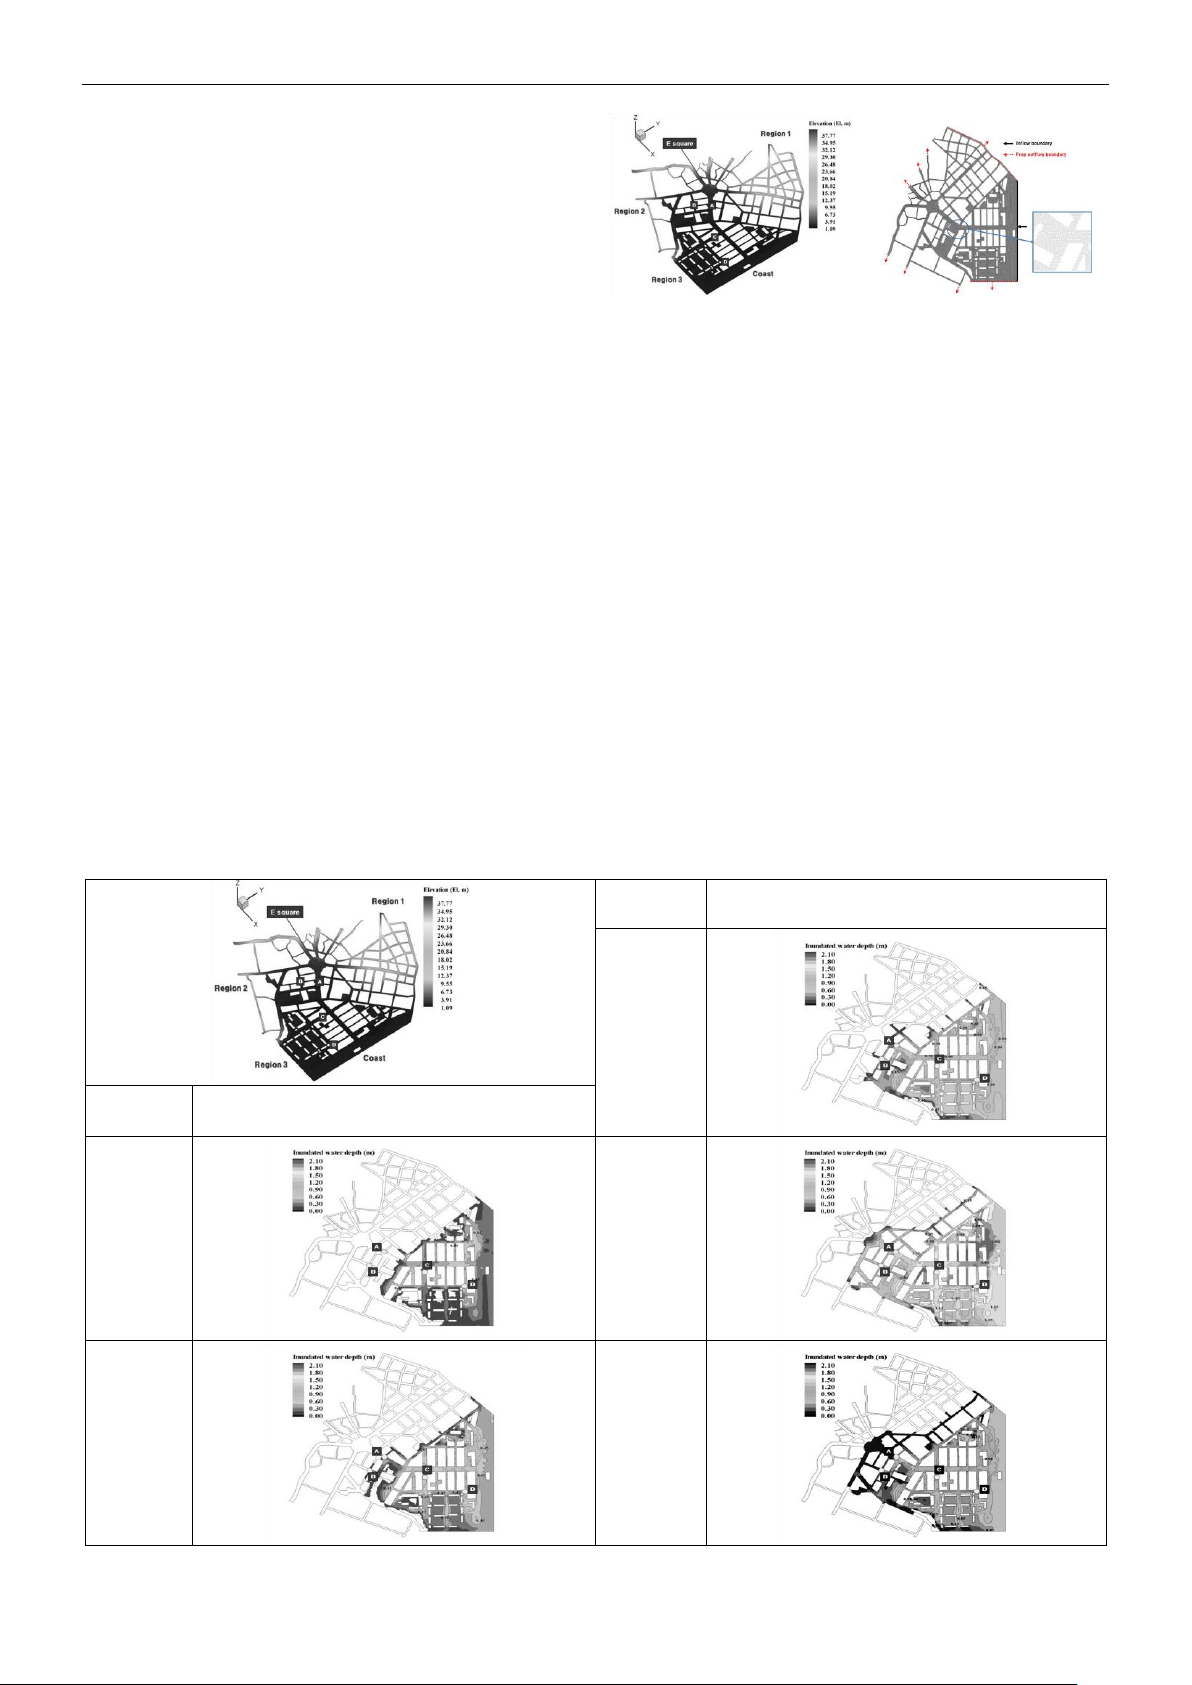
Figure 2(a) represents the elevation
distribution of the target area. The elevation
along the coastal line varies from EL. 1.90 to
EL. 2.10 m and the mean elevation is EL.
2.00 m. The elevation range of the urban
area is between EL. 2.00 and EL. 39.90 m.
The region from the coast to point C
represents an almost flat terrain, but regions 1
and 2 become steeper with a mean slope of
approximately 0.09. The elevation of point A
is EL. 2.01 m, point B EL. 2.08 m, point C
EL. 1.40 m, and point D EL. 1.24 m. Figure
2(b) shows the grid system of the target
coastal urban area and boundary conditions.
The grid system consists of 57,503 non-
structural triangular cells and 32,885 nodes,
and buildings are considered to be
impermeable. Hence, the flow occurs only
along the roads between buildings. The
coastal line is considered as an inflow
boundary condition, and the road exits
connected with the boundary of the target
coastal urban area are considered as free
outflow boundary conditions.
a) b)
Figure 2. Elevation distribution (a) and grid
system with boundary conditions (b).
Figure 3 shows the spatial distributions of
inundation depths with time for Typhoon
“Maemi” case. The storm surge starts to
inflow in from the coast, moves along the
roads between buildings, stops moving
around E square because of high slope, and
then moves along other roads with relatively
small slopes. With the first half of the
buildings placed close and parallel to the
coast, rapid increases in the water depth
occurs, which means that buildings may
become barriers that delay the movement of
the storm surges flowing in from the coast.
Since the beginning of the simulation, the
Time
(sec)
Inundated water depth(m)
15,000
(4h 10m)
Time
(sec)
Inundated water depth(m)
5,000
(1h 23m)
21,000
(5h 50m)
Max
10,000
(2h 47m)
25,000
(6h 57m)
Figure 3. Spatial distribution of inundation depths with time for Typhoon “Maemi” case.
Tuyển tập Hội nghị Khoa học thường niên năm 2015. ISBN: 978-604-82-1710-5
340
inundation depth with time increases from
0.84 m after 5,000 seconds (1 hr 23 min), to
1.07 m after 10,000 seconds (2 hr 47 min), to
1.4 m after 15,000 seconds (4 hr 10 min),
and up to 2.09 m after 21,000 seconds (5 hr
50 min), and then starts to decrease. After
25,000 seconds (6 hr 57 min), the inundation
depth decreases down to 1.25 m.
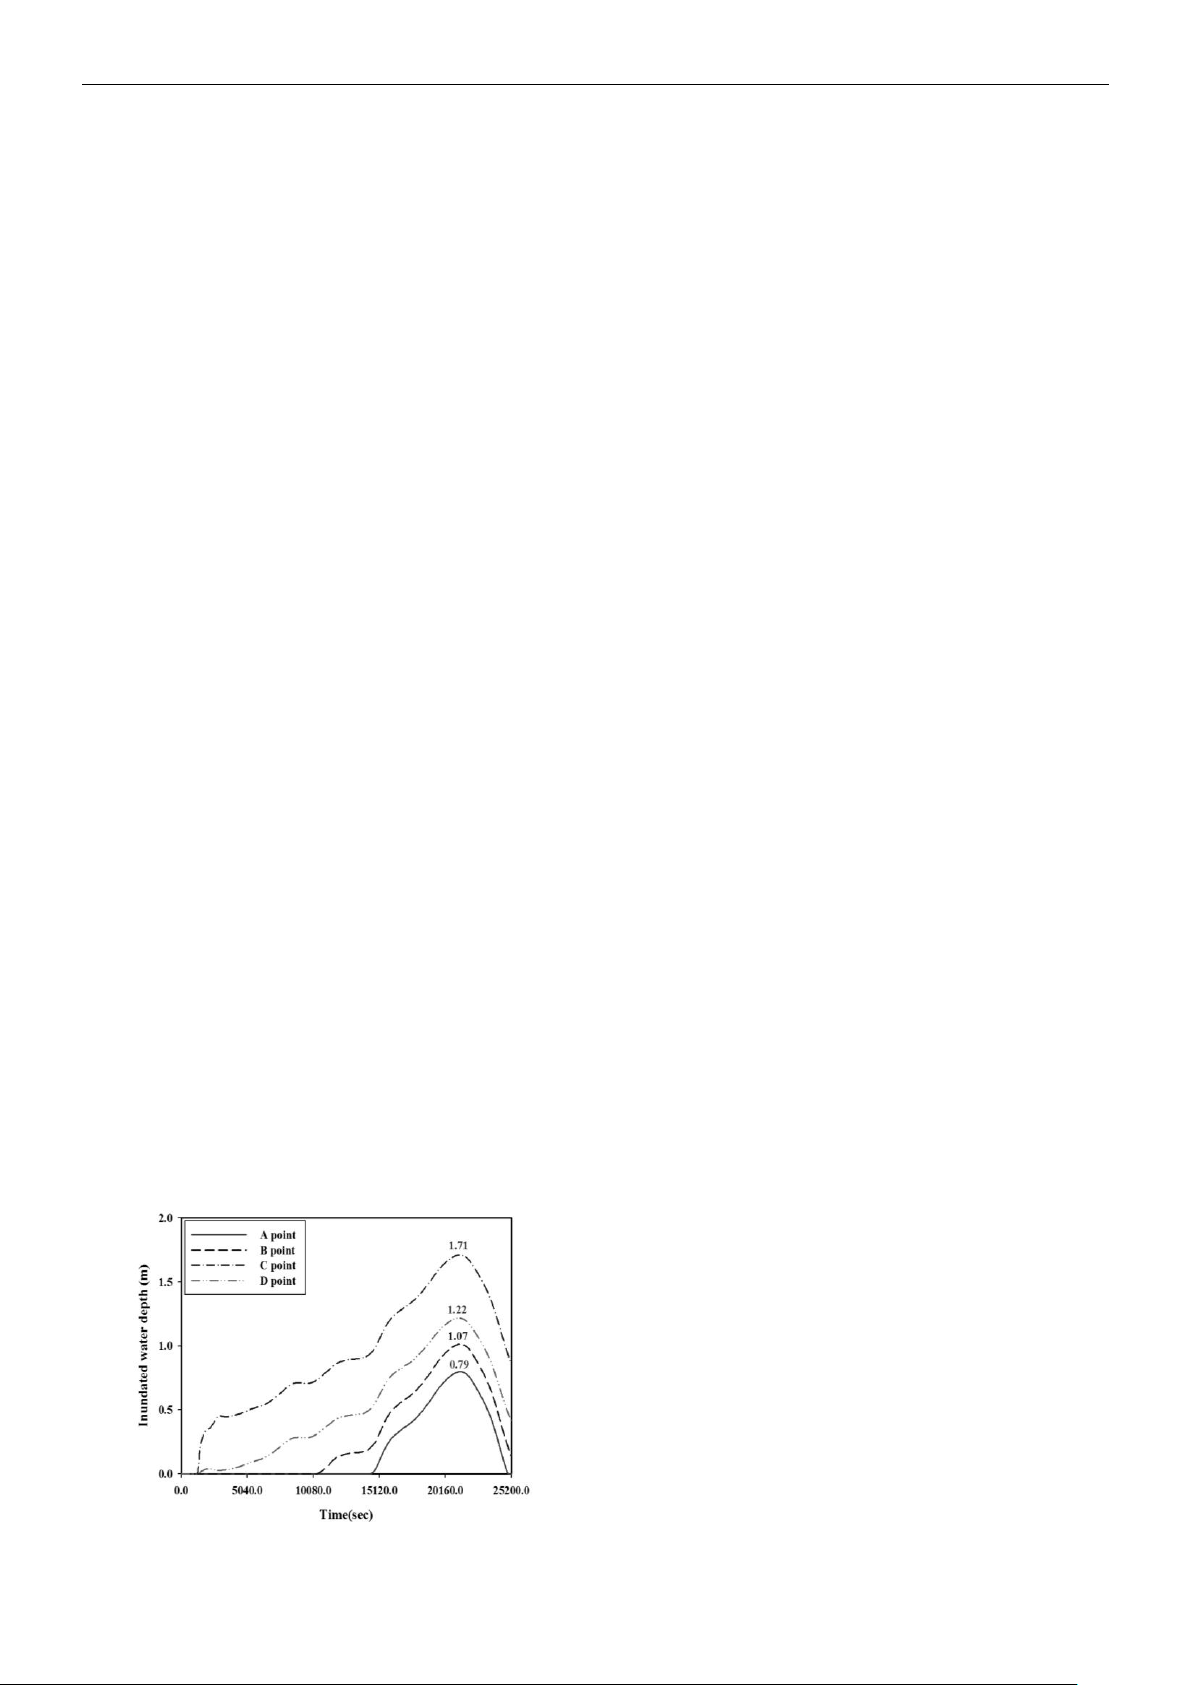
Figure 4 shows the temporal variations of
inundation depth for four points. In the case
of point D, the maximum inundation depth is
1.22 m and occurs after 21, 204 seconds
(corresponding to September 12, 21 hr 53
min) from the beginning of the simulation,
which is 204 seconds (nearly 3 min) after
21,000 seconds when the maximum storm
surge height occurred. In the case of point C,
the maximum inundation depth is 1.71 m
after 21,265 seconds (corresponding to 21 hr
54 min), which is estimated to have occurred
approximately 60 seconds after the maximum
storm surge height at point D occurred. For
points A and B, the maximum inundation
depths are 1.07 m and 0.79 m, respectively,
and they occur after 21,308 and 21, 317
seconds, respectively, almost simultaneously
since the beginning of the simulation. In the
case of points C and D estimated in this study,
the maximum inundation depth represents
values within the range of, or considerably
close to, the inundation traces shown in Figure
10(b), but in the case of point A and B, the
maximum inundation depths are
overestimated by approximately 0.5 m.
Considering the uncertainty of the inundation
Figure 4. Temporal variation of inundation
depths at four points for Typhoon “Maemi” case.
traces, however, the simulated results are
comparatively appropriate. In the case of point
D and C, the inundation starts after
approximately 1,189 seconds (corresponding to
16 hr 19 min) and 1,254 seconds
(corresponding to 16 hr 21 min), respectively.
For points A and B, the inundation starts after
9,027 seconds (corresponding to 18 hr 30 min)
and 14,328 seconds (corresponding to 19 hr 58
min), respectively.
3. CONCLUSIONS
Using the 2-dimensional numerical model
and the data of storm surge heights observed
from the tide station of Masan bay, we simulated
and analyzed inundations caused by storm
surges in a part of new town in Changwon city,
Kyungnam Province, Korea. The main
conclusions drawn in this study are as follows:
1. The maximum inundation depths for points
D, C, A, and B in the target coastal urban
areas are 1.22, 1.71, 1.07, and 0.79 m,
respectively, and in the case of points D and
C, the calculated values are considerably
close to those from the surveyed inundation
traces, whereas in the case of points A and
B, the maximum inundation depths are
overestimated by approximately 0.5 m.
Considering the uncertainty of the
inundation traces, however, the maximum
inundation depth estimated in this research
is appropriate in principle.
2. The storm surge starts to flow in from the
coast, moves along the roads between the
buildings in the urban area, stops moving
around E square because of roads with
high slope, and then moves along other
roads with relatively small slopes. With
the first half of the buildings placed close
and parallel to the coast, rapid increases in
the water depth occur, and the buildings
in the urban area probably become
barriers that delay the movement of the
surges flowing in from the coast.
4. REFERENCE
[1] Jeong, W.C. (2015) "A study on simulation
of flood inundation in a coastal urban area
using two-dimensional well-balanced finite
volume model", Natural Hazards, Vol. 77,
No. 1, pp. 337-354.

Tuyển tập Hội nghị Khoa học thường niên năm 2015. ISBN: 978-604-82-1710-5
341