44

Kieu Xuan Tuyen

FLOOD MAPPING WITH IMPACTS OF THE FLOOD RELEASES AND DAM FAILURE OF LARGE RESERVOIRS IN THE VU GIA - THU BON RIVER BASIN

Kieu Xuan Tuyen* Central Vietnam Institute for Water Resources - Vietnam Academy for Water Resources, Vietnam

*Corresponding author: kxtuyen@gmail.com

(Received: September 13, 2024; Revised: October 09, 2024; Accepted: October 10, 2024) DOI: 10.31130/ud-jst.2024.555E

findings will significantly contribute releases and dam failures, as part of the state-level independent project coded ĐTĐL.CN-84/21: "Research on building emergency response plans for the possibility of major floods and dam breaks on the Vu Gia - Thu Bon River basin". These

to establishing essential scientific arguments for formulating proactive disaster response strategies in the event of emergency flood releases or dam failures from large reservoirs within the Vu Gia - Thu Bon River basin, thereby aiding in guiding development planning and stabilizing socio-economic conditions in Quang Nam Province and Da Nang City.

Abstract - Natural hazards are unusual natural phenomena that can cause damage to people, property, the environment, living conditions, and socio-economic activities. Currently, across the country, efforts are being made to prevent and control natural disasters. However, the damage caused by these natural disasters and floods tends to increase, and unusual phenomena become more and more extreme due to the following factors: global climate change, deforestation, and economic development that accelerates urbanization, industrialization, and the conversion of forest land into farmland. Floods and dam safety in river basins have been and are issues of social concern. Practical requirements in disaster reduction toward proactively responding to adverse situations that may occur in cases of flood discharge or dam failure and developing emergency response plans for floods in river basins to minimize the flood risks.

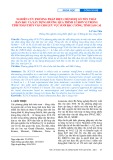
2. Research area overview

Key words - Vu Gia-Thu Bon; flood map; GIS; flood discharge; dam failure.

1. Introduction

in infrastructure systems

The Vu Gia - Thu Bon River System is a major river system located in the Central Coast region of Vietnam, with a river basin area of 10,350 km². Within this area, 301.7 km² is located in Kon Tum Province, while the majority lies in Quang Nam Province and Da Nang City. This river basin serves as the most important water source for meeting the socio-economic development needs of both Quang Nam Province and Da Nang City.

In this basin, there are approximately 1,275 water reservoirs, of which 1,202 are located in Quang Nam Province and 73 in Da Nang City (as reported in the Quang Nam and Da Nang Province Planning Report for the 2021-2030 period, with a vision towards 2050) [2, 3]. Due to the predominantly mountainous terrain of the Vu Gia - Thu Bon basin, it presents significant potential for hydropower development. The total regulation capacity of reservoirs within this basin is approximately over 4 billion m³.

Vietnam has one of the largest irrigations and the world. hydropower According to the report on the irrigation and hydropower reservoirs from the Ministry of Agriculture and Rural Development in 9/2024 [1], there are 6,842 water reservoirs across the country. Among these, there are 62 reservoirs with a capacity of over 100 million m3, 131 reservoirs ranging from 10 million to 100 million m3, 92 reservoirs with capacities between 5 million and 10 million m3, 100 reservoirs holding between 3 million and 5 million m3, and 471 reservoirs containing between 1 million and 3 million m3, the majority of the reservoirs having capacities less than 1 million cubic meters, with most being earthen dams. In recent years, rainfall and flooding patterns have become increasingly complex and unpredictable, coupled with the construction of numerous hydropower and irrigation projects aimed at economic development, which has led to a rise in emergency flood releases and dam failures, causing significant losses in human life and property. Therefore, modeling flood scenarios downstream of reservoirs due to emergency releases or dam failures is critical for effective disaster preparedness and response planning. The study results for developing scientific basis will provide a recommendations evacuating for strategies and populations in downstream areas, thereby ensuring safety for both individuals and property during unforeseen events.

This paper presents findings focused on constructing flood maps corresponding to various scenarios of flood

Figure 1. Map of the Vu Gia - Thu Bon River Basin, scaled 1:810,000

ISSN 1859-1531 - THE UNIVERSITY OF DANANG - JOURNAL OF SCIENCE AND TECHNOLOGY, VOL. 22, NO. 11C, 2024

45

3. Flood mapping impacted by flood releases and dam failure of large reservoirs in the Vu Gia – Thu Bon River basin 3.1. Research Methodology these

characteristics (velocity and depth, the rate of water rises, and the time elapsed from rainfall to flooding) as well as the interaction of flooding with the terrain. Understanding the different levels of hazard, and the underlying causes is crucial, as factors may necessitate distinct management approaches. Flood risk assessments can provide valuable information for flood risk management and emergency preparedness for current communities, as well as future development strategies.

In this study, the authors used the Mike modeling suite for research purposes. Mike Nam for calculating inflow forecasts, Mike 11 for one-dimensional hydraulic modeling and dam failure simulation, and Mike Flood was utilized to integrate one-dimensional and two-dimensional hydraulic modeling for calculating downstream flooding [4, 5].

d. Flood hazard map: Highlighting the potential risks that communities may face in a flood scenario. The consequences include social, economic, environmental, and cultural aspects.

Results from the flooding calculations using Mike Flood were extracted and analyzed with ArcGIS to assess flood levels and flood mapping [6, 7]. 3.2. Scientific basis for flood map construction 3.2.1. Overview e. Flood awareness map: The media maps provide a narrative alongside the flood risk/ hazard map, showcasing historical flooding in the community and projecting future flood possibilities and associated risks.

Flood maps are essential tools used to help prepare for floods and mitigate their impacts. They identify potential flood hazards and assist decision-makers in several areas, including flood preparedness and mitigation, land use planning, emergency management, and raising public awareness of flood risks. 3.2.2. Types of flood map

In this paper, we present the results of flood mapping for the Vu Gia - Thu Bon River basin under scenarios of flood discharge and dam breach risks. This aims to support response planning and provide documentation for land-use planning in the study area. 3.3. Methodology for calculating and developing flood data The methods commonly applied to calculate flood data

include the following: 3.3.1. Statistical methods for investigating flood traces

Flood maps identify areas that may be inundated during actual or potential flood events. They can determine the likelihood of flooding and its impacts on infrastructure, people, and property. Below are the different types of flood maps commonly used: illustrates a. Flood map: This map

infrastructure, transportation,

According to this method, flood data is constructed based on surveys conducted across the entire flooded area, examining the marks left by significant past floods. Typically, this involves interviewing residents in the flooded regions to document the flood marks visible on buildings and structures. Therefore, the data collected about past flooding events plays a critical role in delineating flood zones. The steps involved are: - Conduct field surveys and investigations; - Collect and process relevant meteorological and hydrological data;

flooding information from past events or projected scenarios. The primary information included in a flood map comprises details about inundated areas at various depths, along with administrative, and population data, which help assess the impacts of flooding. According to Article 27 of Decree 114/2018/ND-CP on dam and water reservoir safety management, flood map is defined as a map that shows the extent and depth of flooding in the downstream area when a reservoir discharges water during normal operations, emergency releases, or dam failures.

The purpose of the flood map is to inform current and future authorities and residents about flood risks to their lives and properties, supporting emergency preparedness plans for communities in flood-prone areas, and enhancing resilience. - Analyze terrain data results; - Compile and create maps. The data collection includes: Rainfall data: rainfall records are selected for appropriate periods, covering the time from when rainfall begins to when flooding ceases, at monitoring stations throughout the watershed and nearby areas.

b. Flood extend/ emergency map: This type of map shows the distribution or extent of flooding during real-time events. It aids in emergency preparedness and response for communities located within flood-prone areas.

c. Flood risk map: Display areas susceptible to flooding under various scenarios based on hydrological and hydraulic studies. These technical maps are commonly used to develop response plans or land use strategies aimed at flood mitigation. Flood risk varies with flood severity (i.e., in the same location, rarer floods pose a greater risk) and the position within the flood zone during a specific flood event. This variability is influenced by flood Water level and flow data: Data on water levels and flow rates are gathered from regularly monitored stations on the main river; flood marks along the riverbed and inundated areas are aligned with the elevation data of the topographic maps, the reliability of recorded water levels and flow measurements must be verified at necessary monitoring stations and locations within the flooded areas. Flood data: Information on the extent of the flooded area, flood depth, duration of flooding, flow velocity, and flow direction. Data from previous flood events is also gathered to understand the overall flooding situation and recurrence frequency.

46

Kieu Xuan Tuyen

provide essential information for delineating flood risk zones. During the topographical and geomorphological survey, the micro-topographical forms are classified in detail and interpreted through flood risk analysis by experienced field experts. Most flood data are collected from field surveys of flood traces and information gathered from residents living in flooded areas. Damage from floods data may be available from local agencies such as provincial, district, and commune Disaster Prevention Committees, insurance companies, the Red Cross… Limitations of using topographic and Limitations of the statistical method and flood trace geomorphological maps: surveys of actual flood events:

- Often descriptive, as it does not consider the hydrological and hydraulic characteristics of the study area. - Dependent on the accuracy of the topographic data relative to the flooding situation. - The analyses are primarily qualitative, serving only to assess flood vulnerability during regional planning. - It does not predict flood levels for different frequencies.

Therefore, this method is less accurate due to the lack of continuous updates regarding changes in buffer conditions, topography, and other factors in the basin. 3.3.3. Satellite imagery method

- The flood maps constructed using the method of investigating significant past floods primarily reflect the current state of flooding and do not provide predictive capabilities based on established flood scenarios. However, they hold great significance in flood control efforts and serve as a foundation for evaluating and comparing subsequent studies. Nonetheless, this method is time-consuming and labor-intensive, and there are aspects that researchers may not be able to measure or data they cannot collect. The construction of downstream flood maps based on field survey data is relatively accurate if the density of flood marks is sufficient. In reality, in sparsely populated areas, the information gathered may be limited and not comprehensive, leading to challenges in accurately delineating flood boundaries and reducing precision.

the spectral - The accuracy of the method depends on the subjective recall of residents living in flood-prone areas, as well as the number of flood marks remaining on buildings and structures (those that are not damaged and have persisted since the flood).

- It does not provide calculations to forecast flood maps for events with varying frequencies, nor does it account for the correct recurrence cycles of past floods.

Currently, in Vietnam, there are commonly used satellite data types that can be utilized for flood mapping, such as LANDSAT MSS, LANDSAT TM, SPOT HRV, MOS-1 MESSR, and aerial photography at various scales... rely entirely on the spectral reflectance characteristics of natural objects, with a particular focus on waterlogged and water- retaining areas. Based on reflectance characteristics of key elements in land cover, it is possible to develop a technological process to differentiate between water-containing (flooded) and non-water-containing areas. The method of using satellite imagery for flood mapping is comprehensive and allows for clear observation of flooded areas with high detail.

Limitations of the satellite imagery method: - The acquisition of satellite images is heavily dependent on weather conditions and the positions of the satellites (whether they can cover the study area); additionally, or preparation issues for image acquisition often result in the inability to capture images at critical times;

- In areas prone to frequent flooding, satellite imagery cannot distinguish between fully inundated areas and partially flooded areas;

in

- While satellite images can capture the flooding situation during specific flood events, they primarily serve to verify the results of flood maps generated by other methods;

Therefore, this method is rarely used in isolation; it is often combined with other methods (satellite data, modeling, and geomorphological analysis) to enhance accuracy. 3.3.2. Method utilizing topographic and geomorphological maps Using topographic and geomorphological maps to analyze and identify flood-prone areas through contour lines, elevation points, origins, and formation conditions. The topographic and geomorphological characteristics of river basins are classified into different forms based on topographic, geomorphological units. Floodplains are one such form, which includes natural levees, mounds, and alluvial plains formed by suspended sediments transported from upstream and deposited low-lying areas. Consequently, flooding has occurred in these floodplains to estimate areas at risk of inundation. Overall, floodplains are classified into 2 types of terrain: - Former river channels and swamp areas that are - It does not provide forecasts for flood maps for events with varying frequencies or cycles that have not yet occurred. relatively low and prone to flooding, alluvial plains;

Consequently, this method is typically used to generate important reference data that supports other methods for flood mapping. 3.3.4. Mathematical modeling method

With the advancement of technology, the development of software and the use of simulation and modeling tools through hydrological and hydraulic models are essential - Relatively high sandy areas, such as natural mounds. The micro-topographical types within the floodplain are investigated and surveyed in detail to predict the flood risk of the area. The relationship between soil origin and is relatively clear. Therefore, flooding phenomena investigating topography and geomorphology can illuminate natural areas vulnerable to flooding and

ISSN 1859-1531 - THE UNIVERSITY OF DANANG - JOURNAL OF SCIENCE AND TECHNOLOGY, VOL. 22, NO. 11C, 2024

47

the advantages of

and much more effective. This modern approach is increasingly being used worldwide and in Vietnam. It combines traditional methods. Moreover, with the growth of computers and information systems, there are more and more applications developed based on Geographic Information Systems (GIS), with flood mapping being one of the key applications that provide significant practical benefits for flood control and disaster risk reduction. GIS applications that illustrate flood events. With the continuous advancement of geographic information technology, the data represented on these maps serves as a database for GIS tools to perform calculations, analyses, and extract necessary datasets, which can be managed and accessed via computers or smart mobile devices. This mapping system can be preserved and accessed online through Webgis technology, facilitating convenient usage and exploitation anytime, anywhere. The method using mathematical modeling is conducted as follows:

To meet the increasing demands for accuracy and reliability, a wide range of mapping software has been implemented, including MapInfo Professional, ArcGIS, NOVA, MicroStation, AutoCAD, Global Mapper, etc.,

- Using a one-dimensional flow model: The model determines the maximum water level at each cross-section of the river. The flood boundary is defined as the line connecting the maximum water levels at each cross-section of the river. Each software type has its own advantages and disadvantages. Therefore, the selection of software for flood mapping should be based on general principles that meet technical requirements as well as user-friendliness:

- Using a two-dimensional flow model: The flood risk delineation map is determined by using rectangular grid cells calculated from the flood level. The boundaries of the flooded areas are drawn based on the existing grid cells. - Database structure requirements: Logical, ensuring connectivity among components within the database; Flexible, capable of updating spatial and attribute information; Compact and adaptable; User-friendly.

- Data format requirements: Must meet international standards: Be a widely applicable data format of commercial software within the GIS software ecosystem; Allow for easy conversion between different GIS software; Ensure a solid mathematical foundation for the data. the analysis of Based on - The parameters of the river hydraulic model are established based on theory and validated against the results of past flood events. These parameters are then used to simulate other floods corresponding to different frequencies and scenarios to aid in forecasting flood conditions. The this method necessitate for requirements comprehensive data collection: - Topographic data for the study area (digital elevation the advantages and disadvantages of each software, this paper utilizes ArcGIS to develop the downstream flood map. 3.5. Flood release and dam failure scenarios models DEM, detailed river cross-section surveys...);

- Reliable data from several significant flood events across the inundated region to validate river hydraulic parameters; - Current operational data concerning existing infrastructure that may influence flooding in the area;

- Meteorological and hydrological data related to the study, such as maximum daily rainfall, rainfall event processes, flood flow rates, river water levels, tidal processes at estuary, etc., in the areas corresponding to the investigated flood events.

The simulation method utilized for flood mapping offers significant advantages in modeling flow within river networks and overland flow. Despite certain limitations in flood simulation, it generally meets diverse requirements for flood assessment and forecasting under various scenarios.

Based on the analysis of the aforementioned methods, simulation approach using

this paper applies a mathematical modeling to develop flood maps. 3.4. Selection of software for flood mapping

The results of flood data obtained from hydrological and hydraulic simulation processes provide only a snapshot of inundated areas, velocity fields, and flood depths in the form of numerical images. To effectively utilize this raw data, it is necessary to overlay it with additional layers of useful information to produce printed maps or to develop Based on the approved research task, a total of 24 scenarios have been calculated: S1 - Controlled flood release from reservoirs on the Vu Gia River branch, with a 1% flood release from the Thu Bon River; S2 - Controlled flood release from the Song Tranh 2 reservoir (Thu Bon branch), combined with a 1% flood release from reservoirs on the Vu Gia River branch; S3: All reservoirs in the basin release design flood levels; S4: Simultaneous release from branches on the Vu Gia and Thu Bon Rivers with a flow rate of Qvh = 3,000 m³/s; S5: Simultaneous release from branches on the Vu Gia and Thu Bon Rivers at a flow rate of Qvh = 5,000 m³/s; S6: Simultaneous release from branches on the Vu Gia and Thu Bon Rivers at a flow rate of Qvh = 7,000 m³/s; S7: Simultaneous release from branches on the Vu Gia and Thu Bon Rivers at a flow rate of Qvh = 10,000 m³/s; S8: Flood release scenario where the A Vuong dam’s gate is malfunctioning; S9 - Flood release scenario for the Song Bung 4 reservoir with a malfunctioning gate; S10: Flood release scenario for the Dak Mi 4 reservoir with a malfunctioning gate; S11 - Flood release scenario for the Song Tranh 2 reservoir with a malfunctioning gate; S12: Flood release scenario for the Con 2 reservoir with a malfunctioning gate; S13 - Simultaneous failure scenario for the A Vuong dam and the Song Bung 4 dam; S14: Simultaneous failure scenario for the A Vuong dam and the Dak Mi 4 dam; S15: Simultaneous failure scenario for the Song Bung 4 dam and the Dak Mi 4 dam; S16: Failure

48

Kieu Xuan Tuyen

based on the established flood release and dam failure scenarios.

Implementing adjustments and corrections according to the established standards for color tables, symbols, line types … across the following data layers: vegetation (polygon, line, point, text), hydrology (polygon, line, point, text), topography (line), transportation (line, text), demographics and infrastructure (polygon, point, text), and provincial, district, and municipal boundaries (polygon, line, text).

for constructing - Guidelines

Perform the editing of the flood depth file according to the standard color scale that represents the extent of flooding on the flood map, in accordance with the Technical Standard: TCKT 03:2015/TCTL for irrigation flood maps works downstream of water reservoirs in emergency flood release and dam failure situations, issued by the Ministry of Agriculture and Rural Development.

Complete the map by adding a frame, map scale, map title, scale bar, directional symbol (arrow indicating North), and annotation labels.

scenario for Song Tranh 2 dam and one reservoir on the Vu Gia River branch; S17: All reservoirs on a Vu Gia River branch release design flood levels, while the Song Tranh 2 reservoir releases at 1% under climate change conditions without downstream rainfall; S18: The Song Tranh 2 reservoir releases design flood levels, while the reservoirs on the Vu Gia River branch release at 1% under climate change conditions without downstream rainfall; S19: All reservoirs in the basin release design flood levels without downstream rainfall under climate change conditions; S20: Failure of the A Vuong dam, while other reservoirs operate according to established protocols under climate change conditions; S21: Failure of the Song Bung 4 dam, while other reservoirs operate according to established protocols under climate change conditions; S22: Failure of the Song Bung 4 dam, while other reservoirs operate according to established protocols under climate change conditions; S23: Failure of the Song Tranh 2 dam, while other reservoirs operate according to established protocols under climate change conditions; S24: Failure of the Con 2 dam, while other reservoirs operate according to established protocols under climate change conditions. 3.6. Steps for flood mapping 3.6.1. Editing and developing basemap Extract the maps according to the requirements of the assigned task: This map system can be stored and accessed online through Webgis technology or printed on paper for convenient use and exploitation. 3.7. Results of flood mapping

The basemap is the foundational data layer for flood mapping. It includes layers of data related to topography, geomorphology, planimetric features, rivers and streams, data on population, infrastructure.

The results include the preparation of 24 flood maps and a summary table of corresponding flood depths detailed down to the commune level. In this paper, we present the results of several representative scenarios and the summary table of flood depths at the district level, including emergency flood release group S3; operational flood release group S7; dam failure group S16.

To create the basemap for this study, the team utilized two digital basemaps at scales of 1:50.000 and 1:10.000, which were provided and updated by the Ministry of Natural Resources and Environment. These digital maps are classified by province, district, and commune levels within the Vu Gia - Thu Bon River basin in Quang Nam Province and Da Nang City. 3.6.2. Developing the flood data layer

The hydraulic calculation results from the Mike Flood model were extracted as a Raster file *.acs and imported into ArcMap via Arc Toolbox to extract the data in polygon format.

Figure 2. Flood map for scenario 3, scaled 1/150,000

Once the flood depth data file was created, the flood layer was overlaid onto the previously established basemap, and the team began editing and extracting the final map. 3.6.3. Editing and extracting flood map

Map editing is the final step in creating the flood map for the lower Vu Gia - Thu Bon basin. This involves overlaying the previously figured basemap layers and flood depth data onto a single layer. Additionally, infrastructure data fields such as irrigation structures, hydrological stations, meteorological stations, canals, the locations of provincial, district, and commune People's Committees, etc. are incorporated.

Set layout view, create a map frame, map scale, map title, scale bar, legend, direction symbols (arrow indicating North), and annotation labels. Map editing concludes with the extraction of maps

Figure 3. Flood map for scenario 7, scaled 1/150,000

ISSN 1859-1531 - THE UNIVERSITY OF DANANG - JOURNAL OF SCIENCE AND TECHNOLOGY, VOL. 22, NO. 11C, 2024

49

94.07

82.36

70.87

111.89

127.24

174.53

192.24

200.71 1,053.90

0.28 22.45

3.67 22.89

1.72 26.82

52.29 542.49

- 401.06

11.18 22.47 620.16

6.79 18.43 25.60 15.76 311.22 866.94 1,231.48 1,409.85 1,622.86 7,114.15 13,279.61 948.55 1,474.55 2,074.63 3,045.07 3,456.87 2,411.22 2,479.70 16,492.95

1.31

0.81

127.29

1.47

Quang Nam

0.20 486.92 75.68 251.16 10.37 47.31

Ngu Hanh Son 10.21 Son Tra 5.44 Bac Tra My 102.95 Dai Loc 602.35 Dien Ban 0.67 132.93 1.17 Dong Giang 0.03 901.65 1,636.85 1,959.14 1,647.40 1,129.88 1,581.70 9,572.71 Duy Xuyen 229.17 151.21 1,462.35 2,290.88 154.50 126.36 154.95 147.51 18.32 Hiep Duc 29.79 210.42 699.04 1,133.40 669.03 3,100.65 0.28 107.54 Hoi An 955.56 790.73 39.63 37.69 30.15 26.73 18.40 1.86 Nam Giang 206.07 1,878.32 2,762.93 196.09 Nong Son 184.48 143.63 97.53 9.51 7,315.27 1.52 3.37 54.61 Nui Thanh 2,866.30 1,751.89 1,176.67 1,036.20 424.70 744.10 - 0.03 0.97 50.38 Phu Ninh 55.19 1.65 1.49 1.48 Phuoc Son 63.24 50.20 2,066.58 241.00 444.07 441.11 Que Son 3,592.52 9.17 9.36 400.85 697.21 Tam Ky 3,857.48 - 1.63 124.77 580.04 530.28 429.55 18.98 20.45 19.13

236.28 0.12 161.57 425.92 Thang Binh 768.50 2.21 Tien Phuoc

198.97 0.17 252.44 722.81 901.81 7.04

120.54 1.70 226.35 774.64 817.43 14.18

136.93 1.44 249.83 552.56 663.30 18.74

4. Conclusion

Figure 4. Flood map for scenario 16, scaled 1/150,000 Table 1. Statistical analysis of the flooded area for scenario 3

District/ City

Province/ city

Total

> 3,5 (m) 101.31 -

0-0,5 (m) 30.10 83.92 186.28

0,5 -1 (m) 66.12 64.72 430.79

1-1,5 (m) 58.93 38.13 596.50

Flooded area (ha) 2-2,5 (m) 24.56 1.76 743.71

2,5-3 (m) 27.80 - 785.08

1,5-2 (m) 38.89 13.33 669.35

3-3,5 (m) 34.26 - 482.45

381.97 201.86 382.75 4,276.90

Da Nang

78.48

79.74

73.12

25.31

83.97

115.71

102.59

164.58

723.49

- 23.25

7.94 12.84

- 24.96

0.78 22.73

4.81 17.44

- 148.55

47.49 260.49

0.53

80.72

2.84

1.37

Quang Nam

21.09 252.16 4.93 6.85

Cam le Hai Chau Hoa Vang Ngu Hanh Son Son Tra Bac Tra My Dai Loc Dien Ban Dong Giang 2.79 Duy Xuyen 447.60 1,647.67 2,204.15 1,560.87 1,108.19 486.14 148.74 134.23 84.96 139.86 Hiep Duc 707.05 1,133.71 447.03 23.15 Hoi An 46.08 42.33 33.57 18.13 Nam Giang 153.04 119.58 Nong Son 84.01 40.20 - - Nui Thanh 2,945.96 1,295.87 109.80 - - 1.24 Phu Ninh 2.68 2.44 2.63 Phuoc Son 26.54 324.67 480.38 Que Son - - 13.01 Tam Ky 1.83 136.49 672.15 27.69 16.65 11.13

12.31 21.65 8.30 2.43 867.02 1,109.64 1,442.72 1,499.81 1,536.07 1,222.13 4,695.59 12,652.09 279.11 857.38 15,154.61 685.12 1,419.32 2,643.23 3,248.91 3,368.88 2,095.36 836.41 67.68 2.70 2.78 0.03 278.31 572.81 8,305.74 133.95 1,196.35 2,005.77 2,686.67 - 3.96 46.09 655.56 418.26 137.99 1,479.94 2,160.69 4,351.63 - 103.08 - 36.50 22.44 1,462.04 0.51 1,039.89 - 2,192.43 - 386.76 276.20

78.61 0.70 132.63 655.55 Thang Binh 630.90 0.75 Tien Phuoc

146.57 119.61 46.17 139.08 - - 1.97 109.52 - 2.34 22.94

23.23 1.43 383.23 371.32 748.18 5.25

- - 2.23 4.57 - 0.54 26.15

The research results demonstrate the scope and impact of flood releases and dam failures from large reservoirs in the Vu Gia - Thu Bon River basin under potential extreme scenarios. This serves as a scientific basis for developing emergency response solutions, enabling local authorities to proactively manage and operate during adverse incidents related to disaster prevention and mitigation.

Acknowledgments: This article is prepared within the framework of the project “Research on developing emergency response plans for the possibility of major floods and dam failures in the Vu Gia - Thu Bon River Basin.” The independent state-level project code ĐTĐL.CN-84/21. The authors would like to express sincere gratitude to the Ministry of Science and Technology for financing the project, providing feedback, and supporting the research team throughout the study process.

Table 2. Statistical analysis of the flooded area for scenario 7

REFERENCES

District/ City

Province/ city

Total

[1] Water resources database, thuyloivietnam.vn [Online]. Available:

Flooded area (ha) 2-2,5 (m) 23.98 -

1,5-2 (m) 19.39 -

3-3,5 (m) 44.02 -

> 3,5 (m) 27.08 -

206.29 43.57

http://thuyloivietnam.vn [Accessed September 5, 2024].

Cam le Hai Chau Hoa Vang

Da Nang

41.07 -

0,5 -1 0-0,5 (m) (m) 23.08 8.29 35.75 6.32 260.73 554.20 67.07 10.98 16.06

2,5-3 1-1,5 (m) (m) 33.57 26.87 1.49 - 615.92 673.29 744.08 487.44 197.84 152.88 3,686.38 660.00 83.76 22.17 3.33 245.67 387.07 21.04

- 25.05

36.24 - 26.29

[2] Viet Nam Government, Quang Nam province planning for the period 2021-2030 and vision to 2050, No.72/QĐ-TTg, January 17, 2024.

[3] Viet Nam Government, Da Nang city planning for the period 2021-

0.99

0.48

0.14

1.18

39.85

34.29

1.61

91.11

-

2.96 24.16

20.13

Quang Nam

7.25 51.04

2030 and vision to 2050, No. 1287/QĐ-TTg, November 2, 2023. [4] K. X. Tuyen and N. D. Giap, "Research on developing 2-way hydraulic models and 1-way-2-way connections", State-level independent project code DTĐL.CN-84/21, Ministry of Science and Technology, 2024.

83.09 -

[5] DHI Softwave MIKE11, MIKE21, MIKE FLOOD, User Manuals,

2014.

- - 1.79 0.05 - -

123.65 167.77 104.52 Ngu Hanh Son 35.92 - 0.24 7.63 3.49 25.15 24.33 517.93 1,124.63 1,368.59 1,480.69 1,577.56 1,433.46 1,204.21 3,595.25 12,302.31 962.37 2,208.92 3,084.27 3,407.97 2,699.21 1,109.27 476.76 648.38 14,597.15 0.05 1.10 531.15 1,860.69 2,088.86 1,540.03 967.22 421.51 256.48 524.03 8,189.98 154.53 160.94 167.30 162.45 155.26 1,361.92 2,277.25 23.75 2,626.63 16.92 280.63 774.84 1,025.95 425.30 100.03 14.75 1.37 151.78 271.93 27.12 25.37 102.65 137.75 161.48 175.03 171.65 1,667.72 2,478.38 11.07 4,332.93 - 106.02 - 3.39 0.46 1,429.43 16.34 1,046.26 - 2,154.80 1.57 332.28 412.69 17.61

Son Tra Bac Tra My Dai Loc Dien Ban Dong Giang Duy Xuyen Hiep Duc Hoi An Nam Giang Nong Son - Nui Thanh 2,920.44 1,303.87 108.62 - 1.18 Phu Ninh 0.07 Phuoc Son 0.17 493.26 241.46 Que Son 13.01 Tam Ky 596.10 Thang Binh 8.94 Tien Phuoc

21.75 0.05 182.38 408.75 654.87 378.38 663.73 798.81 4.07 1.08

- - 0.56 2.40 - 0.26 19.43

- - 0.29 84.78 - 2.49 16.09

- 91.83 13.20

[6] K. X. Tuyen and N. M. Dang, "Building flood maps according to independent project code

Table 3. Statistical analysis of the flooded area for scenario 16

District/ City

Province/ city

Total

> 3,5 (m) 118.32 -

developed scenarios", State-level DTĐL.CN-84/21, Ministry of Science and Technology, 2024. [7] Ministry of Agriculture and Rural Development, Irrigation system - Guidelines for building flood maps in the reservoirs downstream in emergency flood discharge and dam breaks, TCKT 03:2015, 2015.

Da Nang

0-0,5 (m) 240.14 52.16 336.25

0,5 -1 (m) 122.02 54.37 555.83

1-1,5 (m) 35.67 29.39 500.96

Cam le Hai Chau Hoa Vang

Flooded area (ha) 2-2,5 (m) 37.08 11.84 500.49

2,5-3 (m) 30.23 1.62 633.14

1,5-2 (m) 36.39 17.60 503.23

3-3,5 (m) 29.37 - 669.70

649.21 166.97 983.13 4,682.73