
VNU Journal of Science: Earth and Environmental Sciences, Vol. 41, No. 1 (2025) 47-53
47
Original Article
Application of Google Earth Engine to Estimate the Water
Capacity of Saigon–Dongnai Basin in the Period of
2005–2023 Using MODIS and CHIRPS Satellite Data
Le Trong Dieu Hien1,*, Do Xuan Hong2
1University of Thu Dau Mot, 6 Tran Van On, Thu Dau Mot City, Binh Duong, Vietnam
2Nong Lam University - Ho Chi Minh City, Linh Trung, Thu Duc, Ho Chi Minh City, Vietnam
Received 26th August 2024
Revised 18th October 2024; Accepted 6th February 2025
Abstract: This study used the Google Earth Engine (GEE) platform to calculate the water capacity
of the Saigon-Dongnai basin using remote sensing-derived products related to evapotranspiration
(ET) and precipitation (P). The GEE was used to retrieve two important inputs: MODIS
evapotranspiration spanning the drainage basin and CHIRPS satellite precipitation. We found that
there was a net decrease in the water capacity from January to April every year as a result of greater
evaporation and less precipitation. Due to the increase of precipitation from May to October
following the decrease of solar radiation, and the drop in temperature, the rainy season imposed the
highest values of the change in water capacity. Rainfall and evapotranspiration show a positive
association, as does the relationship between water capacity and inputting water.
Keywords: Water capacity, evapotranspiration, Google Earth Engine, CHIRPS, MODIS.
1. Introduction*
In river basins, water is essential for
industrial processes, power generation, food
security, and human survival. Water is essential
to both terrestrial and aquatic ecosystems in
order to deliver important ecosystem services for
present and future generations. Managing the
________
* Corresponding author.
E-mail address: hienltd@tdmu.edu.vn
https://doi.org/10.25073/2588-1094/vnuees.5215
complex water flow paths to and from these
various water-use industries necessitates a
quantitative grasp of hydrological processes. To
support water-use management more effectively
through retention, withdrawals, and changes in
water use, quantitative insights, background data
are required.

L. T. D. Hien, D. X. Hong / VNU Journal of Science: Earth and Environmental Sciences, Vol. 41, No. 1 (2025) 47-53
48
The water capacity is the relationship
between its input and outflow of water [1]. The
capacity between input water by precipitation
(P) and outgoing water from evapotranspiration
(ET) denoting the sum of evaporation from the
land surface plus transpiration from plants,
groundwater recharge and soil storage (ΔS) [2],
and streamflow (Q) is referred to as the
watersheds overall water capacity [3]. In its
simplest form, the water capacity can be defined
as Eq. (1). Due to urbanization, socioeconomic
development, and population growth, there is
some cases of a greater demand for water than
there is supply among municipal, industrial, and
agricultural interests.
P= Q +ET+ ΔS (1)
Many studies have demonstrated how
susceptible the water resources of river basins
are to climate change. For examples, during the
years 1965–2012 and 1981–2010, respectively,
López-Moreno et al., [4] and Hunziker et al., [5]
reported temperature increases in the Altiplano
of about 0.20 °C decade−1. The effects of long-
term temperature increases on the water
resources in the northern Altiplano were
calculated by Hoffmann and Requena, who
concluded that there would be a significant
decrease in the amount of water in lakes, rivers,
glaciers, and wetlands, particularly during the
dry season. Nigatu et al., (2013) [6] examined
the components of water capacity, such as
surface water intake, over-lake rainfall, and
variance in evaporation patterns, and how these
factors affected Tana Lake's water capacity in
Ethiopia. This analysis was based on three
distinct climate change scenarios for future time
horizons: the 2020s (2010–2039), the 2050s
(2040–2069), and the 2080s (2070–2099). The
over-lake evaporation was measured using
Hardgrave's approach; the over-lake rainfall was
calculated using the inverse distance weighing
(IDW) method; and the surface inflows were
simulated using the HBV model.
Cloud computing services have been used
recently by the Google Earth Engine Platform
(GEE) to enable online analysis of satellite data
[7]. The Application Programming Interface
(API) is used to handle geospatial datasets and
enables the development of programs to access
datasets containing publicly accessible remotely
sensed imagery and other data. Its capacity to
quickly evaluate global, regional, and local data
makes it a valuable tool for data visualization as
a remote sensing platform [8]. Numerous
environmental science and earth science-related
sectors have applied GEE [7]. Applications of
GEE include land studies [9, 10]; agriculture,
forestry [11], urbanization [12], wetlands
monitoring [13], and disaster analysis [14, 15].
Additionally, GEE has aided in the creation of
fresh techniques for mapping and tracking land
use/cover, carbon emissions, and other
environmental indicators, providing critical
insights for sustainable development planning
and policy-making.
In this study, we applied GEE to assess
the water capacity of Saigon-Dongnai basin
in the period of 2005-2023 using Modis
evapotranspiration and precipitation Chirps.
We're using a simplified study approach to make
things more accessible. To calculate water
capacity, evapotranspiration outflow will be
subtracted from precipitation inflow. We aim to
quantify water capacity over time and space by
utilizing satellite-based observations of
evapotranspiration and precipitation to confirm
whether or not there is a difference in water
storage capacity over time and space.
2. Data and Methods
2.1. Study Area
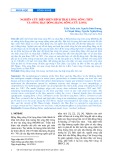
Sai Gon - Dong Nai river basin and its
surroundings cover an area of approximately
49643.53 km2 including 11 provinces: Dac
Nong, Lam Dong, Binh Phuoc, Binh Duong,
Dong Nai, Tay Ninh, Ho Chi Minh City, Long
An, Ninh Thuan, Binh Thuan, and Ba Ria Vung
Tau (Figure 1) [16]. The impacts of climate
change are highly vulnerable to the downstream
area of the river basin, including the subbasins of

L. T. D. Hien, D.X. Hong / VNU Journal of Science: Earth and Environmental Sciences, Vol. 41, No. 1 (2025) 47-53
49
Go Dau Ha, Ben Luc, Nha Be, Dong Nai, Sai
Gon, Ha Dau Tieng and Tay Ninh. Recent river
tides have severely impacted the socioeconomic
growth of numerous communities downstream
of the basin, most in Ho Chi Minh City.
Figure 1. Boundaries of Saigon-Dongnai basin is shared resources among provinces.
2.2. Data
The Saigon-Dongnai basin shapefile data
was extracted from Hydrosheds [17].
The Terra Moderate Resolution Imaging
Spectroradiometer (MODIS) MOD16A2GF
Version 6.1 from NASA; a year-end gap-filled
8-day composite dataset generated at 500m pixel
resolution, is the source of the
evapotranspiration product (2005–2023) in this
study. The MOD16 algorithm is grounded in the
logic of the Penman-Monteith equation, which
takes as inputs eight-day remotely sensed
vegetation property dynamics from MODIS and
daily meteorological reanalysis data.
The precipitation used in this study was
taken from the quasi-global rainfall dataset, The
Climate Hazards Group InfraRed Precipitation
with Station (CHIRPS from Climate Hazards
Center) data, which spans more than 35 years.
Precipitation data at a spatial resolution of 0.5°
(~ 5 km) is provided by CHIRPS. The dataset
uses satellite data along with information from
weather observation stations to estimate
precipitation. In hydrology research, CHIRPS
data can be quite helpful since it offers a lengthy
and reliable time series with precipitation
estimates at a relatively high spatial resolution.
The data is accessible at intervals ranging from
daily to annual.
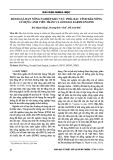
Figure 2. Study approach process.
We calculated the portion of Q and ΔS on a
pixel level and aggregated that information to the
Saigon – Dongnai basin: P − ET = Q + ΔS where

L. T. D. Hien, D. X. Hong / VNU Journal of Science: Earth and Environmental Sciences, Vol. 41, No. 1 (2025) 47-53
50
P is monthly precipitation (mm), ET is monthly
evapotranspiration (mm), Q is streamflow (m/s),
and ΔS is groundwater recharge and soil storage.
Figure 2 described the study approach process. All
calculations and graphics were performed in GEE.
3. Results and Discussion
3.1. Monthly Precipitation in Period of 2005 – 2023
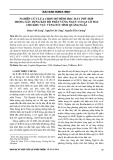
Mean monthly precipitation ranged from
114.4 mm to 253.6 mm in the period of 2005 –
2023 that concentrated in Dong Nai, Binh
Duong, Binh Phuoc, and Lam Dong provinces
(Figure.3a). Figure 3b showed the distribution
of the monthly total of precipitation. The Saigon-
Dongnai basin experiences unequal yearly and
monthly rainfall; 85% of the total annual rainfall
occurs during the rainy season, which runs from
May to October each year [18]. In the period of
study, the precipitation was highest in October
2016, July 2023, and October 2010 with
approximately 450 mm, 420 mm, and 415 mm
respectively. The annual total quantity of
precipitation was high in 2007, 2012, 2021, and
2022, reaching 2400 mm.
a.
b.
Figure 3. Mean precipitation in the Saigon-Dongnai basin (a) and the monthly average precipitation (b)
in the period of 2005 – 2023.
a.
b.
Figure 4. Mean evapotranspiration in the Saigon-Dongnai basin (a) and the monthly average
evapotranspiration (b) in the period of 2005 – 2023.

L. T. D. Hien, D.X. Hong / VNU Journal of Science: Earth and Environmental Sciences, Vol. 41, No. 1 (2025) 47-53
51
3.2. Monthly Evapotranspiration in Period of
2005 – 2023
The annual average evapotranspiration rate
is around 1,191.06 mm, with a maximum
evapotranspiration of above 100 mm in June to
September. The evapotranspiration process has
its highest value in June to September due to a
rise in soil temperature and a decrease in relative
humidity, which leads to increased evaporation.
Most of the studied years were marked by a rise
in the evaporation, the maximum value was
1,216 mm in 2018 (Figure 4b). The annual total
quantity of evapotranspiration was high in 2017,
2018, 2019, and 2021 that reached
approximately 1,200 mm/year. The increase
tendency of annual evapotranspiration was
observed (Figure 4b) in the period of 2005 –
2023. Mean monthly evapotranspiration ranged
from 57.75 mm to 128.15 mm that concentrated
in Binh Duong, Binh Phuoc, and Lam Dong
provinces (Figure. 4a).
3.3. Monthly Water Capacity in Period of
2005 – 2023
The mean monthly water capacity (Q+AS) in
the Saigon – Dongnai basin in the period of 2005
– 2023 concentrated from 80 to 110 mm in Tay
Ninh, Binh Duong, Binh Phuoc, Dong Nai
province and Ho Chi Minh city (Figure 4a). A
negative tendency in water capacity was
observed in months of January, February, and
March whereas an opposite trend can be seen in the
rest of months in the period of study (Figure 4b).
Water loss and incoming water in the river
must be controlled in order to control the process
of water capacity, which is crucial for
managingwater resources. Equation 1 is used to
limit these water losses in order to reach water
capacity and determine the amount of storage
change with respect to the river (Q). In order to
manage the water surplus and the benefits of
water for agriculture, the economy, and society,
reservoirs must be established to the
preservation of all water needs for the years. This
will guarantee that all future water needs will be
met. There was an equivalent amount of water
deficit during the sunny season due to excessive
evaporation in the majority of the years, which
decreased water capacity and caused a water
deficit. It is vital to address the issues that lead to
water deficit in most years, such as reducing the
rate of evaporation, temperatures, wind speed,
and relative humidity, in order to reduce this
phenomenon, achieve the water capacity, and
manage and control the water.
a.
b.
Figure 5. Mean water capacity in the Saigon – Dongnai basin (a) and the monthly average water capacity (b).
![Atlas tài nguyên nước Việt Nam: Tài liệu [Mô tả/Hướng dẫn/Chi tiết]](https://cdn.tailieu.vn/images/document/thumbnail/2025/20250715/vijiraiya/135x160/348_tai-lieu-atlas-tai-nguyen-nuoc-viet-nam.jpg)


![Đề cương bài giảng Bản đồ đại cương [mới nhất]](https://cdn.tailieu.vn/images/document/thumbnail/2026/20260323/hoatudang2026/135x160/81191774414215.jpg)
![Tài liệu giảng dạy Bản đồ và Hệ thống thông tin địa lý [chuẩn nhất]](https://cdn.tailieu.vn/images/document/thumbnail/2026/20260323/hoatudang2026/135x160/61501774414218.jpg)


