
Journal of Science and Transport Technology Vol. 4 No. 1, 23-41
Journal of Science and Transport Technology
Journal homepage: https://jstt.vn/index.php/en
JSTT 2024, 4 (1), 23-41
Published online 30/03/2024
Article info
Type of article:
Original research paper
DOI:
https://doi.org/10.58845/jstt.utt.2
024.en.4.1.23-41
*Corresponding author:
E-mail address:
damnd@utt.edu.vn
Received: 27/02/2024
Revised: 28/03/2024
Accepted: 29/03/2024
Landslide Susceptibility Zoning: Integrating
Multiple Intelligent Models with SHAP
Analysis
Indra Prakash1, Dam Duc Nguyen2*, Nguyen Thanh Tuan2, Tran Van Phong3,
Le Van Hiep2
1DDG(R) Geological Survey of India, Gandhinagar, Gujarat, 382010, India
2Department of Geotechnical Engineering, University of Transport Technology,
54 Trieu Khuc, Thanh Xuan, Ha Noi, Viet Nam
3Institute of Geological Sciences, Vietnam Academy of Science and
Technology, 84 Chua Lang Street, Dong Da, Ha Noi, 100000, Viet Nam
Abstract: In this study, we aim to delineate landslide susceptibility zones within
Dien Bien province, Vietnam, leveraging the capabilities of various machine
learning models including Light Gradient Boosting Machine (LGBM), K-Nearest
Neighbors (KNN), and Gradient Boosting (GB). Harnessing a dataset
comprising 665 data points and encompassing 14 influential factors such as
slope, aspect, curvature, elevation, geological composition, Normalized
Difference Vegetation Index (NDVI), and proximity to geological features like
faults, rivers, and roads, a comprehensive database for landslide modeling was
constructed. The analysis entailed rigorous evaluation and comparison of
model accuracy employing established statistical metrics, notably Receiver
Operating Characteristic (ROC) curves and Area Under the Curve (AUC).
The findings underscore the efficacy of the Light Gradient Boosting Machine
model, exhibiting superior performance with an AUC score of 0.85, surpassing
both the Gradient Boosting model (AUC = 0.81) and the K-Nearest Neighbors
model (AUC = 0.79). Notably, the Light Gradient Boosting Machine model
emerges as a promising tool for precise landslide prediction within the study
area, offering significant potential for the creation of a robust landslide
susceptibility map. The resulting spatial forecast map for Dien Bien province
holds considerable utility for informing land use planning initiatives aimed at
mitigating the impact of landslide disasters in the region.
Moreover, the application of SHAP (Shapley Additive explanation) values to
quantify the contribution of each factor to landslide susceptibility prediction,
offering novel insights into model interpretation and feature importance. The
resulting spatial forecast map holds significant implications for land use
planning and disaster mitigation efforts in Dien Bien province, showcasing the
potential of advanced machine learning techniques in enhancing landslide risk
management strategies.
Key words: LGBM, GB, KNN; GIS; Landslide; Dien Bien, Viet Nam.
1. Introduction
Landslides pose significant threats as natural
disasters, particularly in mountainous regions [1],
where their occurrence can result in substantial
damage to both natural landscapes and built
environments, often leading to loss of life and

JSTT 2024, 4 (1), 23-41
Prakash et al
24
substantial economic repercussions [1]-[3].
Consequently, identifying areas prone to landslides
becomes paramount for effective disaster
prevention and management. Landslide
susceptibility mapping (LSM) offers a means to
gauge the likelihood of landslide occurrence within
a given area under specific geo-environmental
conditions [4], thereby furnishing decision-makers
with valuable insights to preempt and mitigate
landslide events.
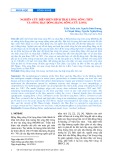
Fig 1. Flow chart of different stages of the present study
Advancements in geographic information
systems (GIS) and remote sensing have ushered
in a plethora of methodologies for LSM [5], broadly
categorized into qualitative and quantitative
approaches. Qualitative methods rely heavily on
expert knowledge and historical data, such as
analytic hierarchy processes and weighted linear
combinations [6],[7]. While straightforward to
implement, qualitative methods are susceptible to
subjective biases. In contrast, quantitative
methods, encompassing deterministic and data-
driven models, play a pivotal role in LSM.
Deterministic models, rooted in physical principles,
offer precise estimations but demand extensive
geotechnical and hydrogeological data, often
impractical for large-scale applications [8]-[10].
In recent years, statistical models leveraging
machine learning have gained prominence [10],
offering robust solutions to landslide hazard
mapping. Traditional statistical techniques,
including weight of evidence and logistic
regression, while simple, struggle to capture
intricate relationships between landslide dynamics
and influencing factors [11]. Machine learning
algorithms, renowned for their adeptness in
handling nonlinear relationships, have emerged as

JSTT 2024, 4 (1), 23-41
Prakash et al
25
formidable tools for LSM [12],[13], spawning a
myriad of approaches such as support vector
machines, k-nearest neighbors, gradient boosting,
decision trees, and deep learning neural networks
[14],[15].
This study aims to elucidate and compare the
performance of various models employed in
landslide susceptibility mapping. Specifically, the
efficacy of three models—LGBM, GB, and KNN—
is explored through empirical research conducted
in Dien Bien province, Vietnam, to generate
accurate LSM maps. Leveraging techniques like
ROC curve analysis and quantitative evaluation
metrics, assessment and comparison of
forecasting accuracy are conducted. Validation and
comparison of model performance are based on
relative operating characteristics, sensitivity,
specificity, and overall accuracy metrics.
2. Materials and methods
In this study, to forecast landslide zoning in
Dien Biên Province, Vietnam, the following four
main steps were employed:
(i) Collecting landslide-sensitive points of the
study area that have occurred in the past and
identification and preparation of layers of effective
factors on the occurrence of landslides in the study
area,
(ii) Landslide sensitive zoning using machine
learning algorithms.
(iii) Evaluating and selecting the most reliable
landslide susceptibility map using evaluation
criteria such as AUC/ROC and statistical indexes.
(iv) Select the most reliable landslide
susceptibility map based on the model’s study.
3. Methods used
3.1. LGBM Classifier
In this study, the light gradient boosting
machine (LGBM) algorithm was used to build a
landslide susceptibility model. LGBM is a machine
learning algorithm based on gradient boosting
decision trees (GBDT). LGBM's scalability and
parallel computing enable it to process large-scale
data sets with a relatively small memory footprint
[16]. This feature makes LGBM particularly suitable
for landslide susceptibility studies, as studies often
involve large amounts of remote sensing data and
environmental variables. Compared to algorithms
such as: RF, SVM and GBDT, LGBM uses a graph-
based decision tree algorithm instead of the
traditional binary decision tree, which reduces the
possibility of overfitting the model. Additionally,
LGBM supports L1 and L2 regularization and
adopts a leaf growth strategy, which can limit model
complexity and reduce the risk of overfitting while
maintaining accuracy of the model [17]. The
equation of LGBM aims to minimize the loss
function, which is usually expressed by the
following Equation 1:
(y,F)=∑l(yi, F(xi))+∑Ω(ft)
(1)
where l(yi,F(xi)) represents the loss function,
measuring the discrepancy between the predicted
value F(xi) and the actual value yi. Ω(ft) denotes
the regularization term used to restrict model
complexity and prevent overfitting. The summation
symbol (∑) indicates the summation of all data
samples or base learners.
3.2. Gradient Boosting
Gradient boosting (GB) is one of the typical
artificial intelligence methods used to develop
classification and regression models to optimize
the model learning process to solve non-linear
problems [18]. GB is more widely known as
decision trees or regression trees. The GB is
trained and built by adding new learners in a
gradual sequential manner thereby grouping weak
prediction models, i.e., decision trees, through the
nodes and leaves of the decision tree, and the final
prediction result is determined based on the
decision nodes [19]. Individual decision trees are
weak models, but when viewed as a set (GB), their
accuracy is much improved [20]. Therefore, the
populations are built gradually in an incremental
manner such that every population corrects errors
in the previous population, thereby improving the
accuracy during model training.
3.3. Kneighbors Classifier

JSTT 2024, 4 (1), 23-41
Prakash et al
26
The K-nearest neighbor (KNN) algorithm is a
supervised learning algorithm utilized for
classification and expectation. It works based on
the nearness guideline , which recommends that
information focuses with comparative highlights
are near to each other [21]. The KNN calculation
allots a course to a point based on the closest
neighbors in its classification setup. It calculates
the separate between the target point and its
closest neighbors to decide the course task
utilizing remove measurements such as the
Euclidean or Manhattan remove. By considering
the chosen number of neighbors (K), it chooses the
lesson with the most elevated number of votes
from these neighbors. The KNN calculation utilizes
a subordinate thickness approach and a decision
run the show to gather comparative pixels within
the include space [22]. This implies that pixels
located nearby in this space are considered part of
the same class. This model finds applications in
different areas such as design acknowledgment,
picture preparing, and information investigation. It
empowers the classification or expectation of
information focuses based on the characteristics of
their closest neighbors, leveraging the concepts of
nearness and closeness [23].
3.4. Validation methods
3.4.1. Receiver operating characteristic curve
(ROC)
The receiver operating characteristic curve
(ROC) is a common method used to evaluate the
performance of binary classification models [24].
The ROC bend visualizes the classifier s
expectation comes about by plotting the genuine
positive rate TP on the vertical pivot and the untrue
positive rate FP on the flat pivot. When assessing
the execution of avalanche vulnerability
expectation, the ROC bend can be utilized to
survey the classification capacity of the
demonstrate for avalanche and non landslide tests
[25]. Using landslide samples as positive examples
and non-landslide samples as negative examples,
the TP and FP values are calculated at different
thresholds based on the model's predictions, and
the ROC curve is then constructed. The closer the
ROC's distance to the top left corner, the more
effective the model is at predicting. The quality of
the model can be determined by measuring the
area under the ROC curve (AUC), which has a
range of [0, 1]. The closer the AUC value is to 1,
the more accurate the model's predictions are.
When the AUC value is greater than 0.8, it
suggests that the model has a superior capacity to
differentiate between landslide and non-landslide
samples, and it can accurately predict and
categorize the susceptibility of landslides [26]. The
calculation is as the following Equation 2:
AUC= (∑TP+ ∑TN )
(P+N)
(2)
where, TP is the number of landslides that is
correctly classified, TN is the number of incorrectly
classified landslides, P is the total number of
landslides and N is the total number of non-
landslides.
3.4.2. Statistical Indexes
In this study, we employed a variety of
metrics to assess the performance of models
during both the training and validation phases.
These metrics encompassed true positives (TP),
true negatives (TN), false positives (FP), false
negatives (FN), positive predictive value (PPV),
negative predictive value (NPV), sensitivity or true
positive rate (SST), specificity or true negative rate
(SPF), accuracy (ACC), Kappa, root mean square
error (RMSE). Below, we will briefly explain each
metric.
Positive Predictive Value (PPV): Also known
as precision, it is the percentage of positive
predictions that are actually positive.
Negative Predictive Value (NPV): It is the
percentage of negative predictions that are actually
negative.
Sensitivity (SST): Also known as recall or true
positive rate, it is the percentage of actual positive
instances that are correctly predicted.
Specificity (SPF): Also known as true

JSTT 2024, 4 (1), 23-41
Prakash et al
27
negative rate, it is the percentage of actual
negative instances that are correctly predicted.
Accuracy (ACC): It is the percentage of total
instances that are correctly predicted. It is
calculated as:
PPV= TP
TP+FP
(3)
NPV= TN
TN+FN
(4)
SST= TP
TP+FN
(5)
SPF= TN
TN+FP
(6)
ACC= TP+TN
TP+TN+FP+FN
(7)
Where TP (True Positive) and TN (True
Negative) are the numbers of correctly classified
landslides, FP (false positive) and FN (False
negative) are the numbers of landslides incorrectly
classified.
Kappa (K): It is a statistical measure that
calculates the agreement of prediction with the
actual outcomes, taking into account the possibility
of agreement occurring by chance.
Kappa= Po-Pe
1-Pe
(8)
where Po is the relative observed agreement
among raters (identical to accuracy), and Pe is the
hypothetical probability of chance agreement.
A set of quantitative analysis including mean
absolute error (MAE), root mean square error
(RMSE), were estimated to measure the accuracy
of the landslide susceptibility models. The following
formulas are accepted for these statistical
measures [27]:
RMSE=√1
n ∑(Xpred-Xact)²
n
i=1
(9)
MAE= 1
n∑|Xpred-Xact|
n
i=1
(10)
where Xpred is the observed value, Xact is
the predicted value, and n is the number of
observations.
3.4.3. SHAP
The core idea of SHAP (Shapley Additive
exPlanation) is derived from the cooperative game
theory, which was proposed by Lundberg and Lee
[28], in order to quantify the contribution of players
to collaborative games in the early stage [29]. The
framework SHAP combines multiple existing
approaches in order to create a theoretically sound
and intuitive way to interpreting the predictions of
any machine learning model. It has been a
significant advancement in the field of machine
learning model interpretation. The SHAP value
determines the magnitude and orientation (positive
or negative) of the influence of features on the
prediction.
This study uses SHAP values to quantify the
contribution of each factor to landslide
susceptibility prediction results. SHAP interprets
the Shapley value as an additive method of feature
mapping, interpreting the model's predicted value
as the sum of the attribute values of each input
feature [28]:
g(x´)= ɸ₀+ ∑ɸᵢ
i=1
m
(11)
where g(x’) is the value of the model, and ϕ0 is the
constant that explains the model, that is, the
predicted mean of all training samples.
Φi is the value of each attribute (Shapley value) as
sociated with it.
4. Data used
4.1. Study area
Dien Bien is a mountainous border province
in the Northwest region of the country, with
geographical coordinates 20o54' - 22o33' North
latitude and 102o10' - 103o36' East longitude.
Located 504 km west of Hanoi capital, the east and
northeast borders Son La province, the north
borders Lai Chau province, the northwest borders
Yunnan province (China), the west and southwest
borders Lao. The area, tectonically active and
dissected by shears and geological faults, exhibits
a complex terrain in Dien Bien City, dominated by
![Atlas tài nguyên nước Việt Nam: Tài liệu [Mô tả/Hướng dẫn/Chi tiết]](https://cdn.tailieu.vn/images/document/thumbnail/2025/20250715/vijiraiya/135x160/348_tai-lieu-atlas-tai-nguyen-nuoc-viet-nam.jpg)


![Đề cương bài giảng Bản đồ đại cương [mới nhất]](https://cdn.tailieu.vn/images/document/thumbnail/2026/20260323/hoatudang2026/135x160/81191774414215.jpg)
![Tài liệu giảng dạy Bản đồ và Hệ thống thông tin địa lý [chuẩn nhất]](https://cdn.tailieu.vn/images/document/thumbnail/2026/20260323/hoatudang2026/135x160/61501774414218.jpg)


