
RESEARC H Open Access
MicroRNAs involved in neoplastic transformation
of liver cancer stem cells
Ren Li
1†
, Niansong Qian
2†
, Kaishan Tao
1†
, Nan You
1†
, Xinchuan Wang
1
, Kefeng Dou
1*
Abstract
Background: The existence of cancer stem cells in hepatocellular carcinoma (HCC) has been verified by
characterizing side population (SP) cells based on efflux of Hoechst 33342 dye from stem cells. Recent advances in
microRNA (miRNA) biology have revealed that miRNAs play an important role in embryonic development and
tumorigenesis. However, it is still unclear which miRNAs participate in the neoplastic transformation of liver cancer
stem cells (LCSCs) during hepatocarcinogenesis.
Methods: To identify the unique set of miRNAs differentially regulated in LCSCs, we applied SP sorting to primary
cultures of F344 rat HCC cancer cells treated with diethylnitrosamine (DEN) and normal syngenic fetal liver cells,
and the stem-like characteristics of SP cells were verified through detecting expression of CD90.1, AFP and CK-7.
Global miRNA expression profiles of two groups of SP cells were screened through microarray platform.
Results: A total of 68 miRNAs, including miR-10b, miR-21, miR-470*, miR-34c-3p, and let-7i*, were identified as
overexpressed in SP of HCC cells compared to fetal liver cells. Ten miRNAs were underexpressed, including miR-
200a* and miR-148b*. These miRNAs were validated using stem-loop real-time reverse transcriptase polymerase
chain reaction (RT-PCR).
Conclusions: Our results suggest that LCSCs may have a distinct miRNA expression fingerprint during
hepatocarcinogenesis. Dissecting these relationships will provide a new understanding of the function of miRNA in
the process of neoplastic transformation of LCSCs.
Background
Cancer stem cells (CSCs) have been identified in hema-
topoietic malignancies and in solid tumors, including
hepatocellular carcinoma (HCC) [1,2]. The isolation and
characterization of CSCs are usually based on the pre-
sence of known stem cell markers, i.e., CD133 in glioma
[3] and CD44 and CD24 in breast cancer [4]. However,
for many tissues, specific molecular markers of somatic
stem cells are still unclear. Therefore, attempts have
been made to identify CSCs in solid tumors through iso-
lation of side population (SP) cells based on the efflux of
Hoechst 33342 dye; such efflux is a specific property of
stem cells [5]. The ability to isolate SP cells by cell sort-
ing makes it possible to efficiently enrich both normal
somatic stem cells and CSCs in vitro without the use of
stem cell markers.
HCC is one of the most malignant tumors in exis-
tence. By using SP sorting, the existence of liver cancer
stem cells in many established HCC cell lines has been
verified [6-8]. However, few studies have focused on the
isolation and characterization of SP cells isolated from
primitive HCC cells. We conjectured that if normal
hepatic stem cells (HSCs) and liver cancer stem cells
(LCSCs) could be enriched through SP isolation, an in
vitro model to determine whether HCC arises through
the maturational arrest of HSCs could be developed.
MicroRNAs (miRNAs) are noncoding RNAs of 19 to
25 nucleotides in length that regulate gene expression
by inducing translational inhibition and cleavage of their
target mRNAs through base-pairing to partially or fully
complementary sites [9]. Studies using the Dicer gene
knockout mouse model have demonstrated that miR-
NAs may be critical regulators of the organogenesis of
embryonic stem cells (ESC) [10,11]. Moreover, accumu-
lated data suggest that dysregulation of miRNA occurs
frequently in a variety of carcinomas, including those of
* Correspondence: xjdoukef@yahoo.com.cn
†Contributed equally
1
Hepato-Biliary Surgery Department, Xijing Hospital, the Forth Military
Medical University, Western Changle Road, Xi’an, 710032, China
Li et al.Journal of Experimental & Clinical Cancer Research 2010, 29:169
http://www.jeccr.com/content/29/1/169
© 2010 Li et al; licensee BioMed Central Ltd. This is an Open Access article distributed under the terms of the Creative Commons
Attribution License (http://creativecommons.org/licenses/by/2.0), which permits unrestricted use, distribution, and reproduction in
any medium, provided the original work is properly cited.

the lung, colon, stomach, pancreas and liver [12]. The
dual effects of miRNAs in both carcinogenesis and dif-
ferentiation of normal stem cells strongly suggest that
miRNA may be involved in the transformation of nor-
mal stem cells into cancer stem cells. Therefore, screen-
ing for differences in miRNA expression between
normal HSCs and LCSCs should help to elucidate the
complex molecular mechanism of hepatocarcinogenesis.
In this study, we applied SP analysis and sorting to
F344 rat HCC cells induced with DEN and to syngenic
rat day 14 embryonic fetal liver cells. After isolation of
total RNA, microarray analysis of miRNA expression
was performed in order to detect possible differences in
expression levels of specific miRNAs in the two side
populations. We found that 68 miRNAs were over-
expressed in the side population of cancer cells com-
pared to that obtained from fetal liver cells, while 10
miRNAs were relatively under-expressed. Partially dysre-
gulated miRNAs were validated by real-time PCR analy-
sis. Our results reveal that miRNAs may play an
important function during the transformation of normal
HSCs into LCSCs.
Methods
Animals and Chemical Carcinogenesis
Pregnant F344 rats and normal male F344 rats were
purchased from the national rodent laboratory animal
resources, Shanghai branch, China. All animals were
housed in an air-conditioned room under specific patho-
gen-free (SPF) conditions at 22 ± 2°C and 55 ± 5%
humidity with a 12 hour light/dark cycle. Food and tap
water were available ad libitum. All operations were car-
ried out under approval of Fourth Military Medical Uni-
versity Animal Ethics Committee. Primary HCCs were
induced with DEN (80 mg/L in drinking water, Sigma,
St. Louis, MO) for 6 weeks; animals were then provided
with normal water until the appearance of typical tumor
nodules in the liver, which usually occurred 10 to 12
weeks after treatment. After the rats were sacrificed
under ether anesthesia, liver tissues were fixed with 4%
paraformaldehyde, routinely processed and stained with
hematoxylin and eosin (H&E) for histological examina-
tion by two pathologists, blinded to the results of the
study, in order to verify the formation of HCC.
Cell isolation and primary culture
Fetal liver cells were obtained from embryonic day 14
rat fetuses by the procedure of Nierhoff et al. [13]. The
dissociated cells were inoculated onto culture plates
with William’s E medium (Sigma, St. Louis, MO) sup-
plemented with 10% fetal calf serum (FCS) (Invitrogen),
100 U/mL penicillin G, 0.2 mg/mL streptomycin, and
500 ng/mL insulin. HCC cells were isolated from DEN-
induced rat liver carcinomas. Briefly, tumor nodules in
the liver were minced into pieces and digested by 0.5%
collagenase type IV (Sigma,St.Louis,MO)at37°Cfor
15 minutes. After filtration through 70 μmmesh,the
dispersed cancer cells were collected by centrifugation
and finally cultured in medium of the same composition
as that used for fetal liver cells. The culture media were
changed routinely every 3 days.
Flow cytometry
To identify and isolate SP fractions, fetal liver cells and
HCC cells were dissociated from culture plates with
trypsin and EDTA, and pelleted by centrifugation. The
cells were resuspended at 1 × 10⁶/mL in pre-warmed
HBSS with 2% bovine serum albumin (BSA) and
10 mmol/L HEPES. Hoechst 33342 dye was added to a
final concentration of 5 mg/mL in the presence or
absence of 50 μM verapamil (Sigma, USA), and cells
were then incubated at 37°C for 90 minutes. After incu-
bation, the cells were washed with ice-cold HBSS three
times, and were further stained with FITC-conjugated
anti-rat CD90.1 monoclonal antibody (Biolegend Co.,
USA). When staining was finished, propidium iodide
(PI; final concentration 1 μg/ml) was added to identify
viable cells. The cells were filtered through 80 μm mesh
(Becton Dickinson Co., USA) to obtain a single cell sus-
pension before analysis and sorting. Analysis and sorting
were performed on a FACSVantage II (Becton Dickin-
son Co., USA). The Hoechst 33342 dye was excited at
355 nm and its fluorescence was dual-wavelength ana-
lyzed with emission for Hoechst blue at 445 nm, and
Hoechst red at 650 nm.
RNA isolation and miRNA microarray
Total RNA from two groups of SP cells was isolated
using TRIZOL reagent (Invitrogen) according to the
instructions of the supplier and was further purified
using an RNeasy mini kit (Qiagen, Valencia, CA USA).
The miRCURY Hy3/Hy5 labeling kit (Exiqon) was used
to label purified miRNA with Hy3TM fluorescent dye.
Labeled samples were hybridized on the miRCURY LNA
(locked nucleic acid) Array (v.11.0, Exiqon, Denmark).
Each sample was run in quadruplicate. Labeling effi-
ciency was evaluated by analyzing signals from control
spike-in capture probes. LNA-modified capture probes
corresponding to human, mouse, and rat mature sense
miRNA sequences based on Sanger’smiRBASEversion
13.0 were spotted onto the slides. The hybridization was
carried out according to the manufacturer’s instructions;
a 635 nm laser was used to scan the slide using the Agi-
lent G2505B. Data were analyzed using Genepix Pro 6.0.
Statistical analysis
Signal intensities for each spot were calculated by sub-
tracting local background (based on the median intensity
Li et al.Journal of Experimental & Clinical Cancer Research 2010, 29:169
http://www.jeccr.com/content/29/1/169
Page 2 of 10

of the area surrounding each spot) from total intensities.
An average value of the three spot replicates of each
miRNA was generated after data transformation (to con-
vert any negative value to 0.01). Normalization was per-
formed using a per-chip 50th percentile method that
normalizes each chip on its median, allowing comparison
among chips. In two class comparisons (embryonic hepa-
tocytes SP vs. HCC SP), differentially expressed miRNAs
were identified using the adjusted t-test procedure within
the Significance Analysis of Microarrays (SAM). The SAM
Excel plug-in used here calculated a score for each gene
on the basis of the observed change in its expression rela-
tive to the standard deviation of all measurements.
Because this was a multiple test, permutations were per-
formed to calculate the false discovery rate (FDR) or q
value. miRNAs with fold-changes greater than 2 or less
than 0.5 were considered for further analysis. Hierarchical
clustering was generated for both up-regulated and down-
regulated genes and conditions using standard correlation
as a measure of similarity.
Real-time polymerase chain reaction (real-time RT-PCR)
analysis
To compare the expression of AFP and CK-7 between
SP and non-SP and validate the differential expression
of miRNAs in SP fractions, we applied real-time RT-
PCR analysis to sorted cells. Specially, stem-loop pri-
mers were used for reverse transcription reaction of
miRNAs [14]. The complementary DNA (cDNA) under-
went 40 rounds of amplification (Bio-Rad IQ5) as fol-
lows: 40 cycles of a 2-step PCR (95°C for 15 seconds,
60°C for 60 seconds) after initial denaturation (95°C for
10 minutes) with 2 μlofcDNAsolution,1×TaqMan
SYBR Green Universal Mix PCR reaction buffer. The
sequence of primers used for amplification is listed in
Table 1. mRNA or miRNA levels were normalized using
GAPDH or U6 RNA as a internal reference gene and
compared with non-SP cells. The relative amount of
each miRNA to U6 RNA was described using the 2
-∆∆Ct
method [15].
Western blotting analysis
Cells sorted by FACS were washed twice with ice-cold
PBS and then incubated with ice-cold cell lysis
buffer (1% Nonidet P-40, 50 mmol/L HEPES, pH7.4,
150 mmol/L NaCl, 2 mmol/L ethylenediaminetetraacetic
acid, 2 mmol/L phenylmethylsulfonyl fluoride,
1 mmol/L sodium vanadate, 1 mmol/L sodium fluor-
ide, and 1× protease inhibitor mixture) to extract pro-
tein. The protein concentrations of the lysates were
measured using a Bradford protein assay kit (Bio-Rad).
All samples were separated in 12% SDS polyacrylamide
gels. Signal were revealed by primary antibodies and
IRDye700-labeled secondary antibody. The signal
intensity was determined by Odyssey Infrared Imaging
System (LI-COR Bioscience, Lincoln, NE).
Results
SP cells are present in rat HCC cancer cell
and fetal liver cells
TheexistenceoftheSPfraction in primary fetal liver
cells and in HCC cells was confirmed by staining with
Hoechst 33342 dye to generate a Hoechst blue-red pro-
file. A small fraction of low-fluorescing cells in the
lower-left region of each profile was gated as SP. The
appearance of this fraction was blocked by verapamil, an
inhibitor of transport via multidrug resistance proteins
(Figure 1A-D). Both fetal liver cells and HCC cells
Table 1 Reverse transcription and stem-loop primers for real-time RT-PCR
Gene name Reverse transcription primer (5’-3’) PCR primers (5’-3’)
F: forward primer
R: reverse primer
miR-21 GTCGTATCCAGTGCAGGGTCCGAGGTATTCGCACTGGATACGACTCAACA F: CGCGCTAGCTTATCAGACTGA
R: GTGCAGGGTCCGAGGT
miR-10b GTCGTATCCAGTGCAGGGTCCGAGGTATTCGCACTGGATACGACCACAAA F: CGTCGTACCCTGTAGAACCGA
R: GTGCAGGGTCCGAGGT
miR-470* GTCGTATCCAGTGCAGGGTCCGAGGTATTCGCACTGGATACGACTCTTCT F: GTGCGAACCAGTACCTTTCTG
R: GTGCAGGGTCCGAGGT
miR-34c-3p GTCGTATCCAGTGCAGGGTCCGAGGTATTCGCACTGGATACGACCCTGGC F:GGTGGAATCACTAACCACACG
R: GTGCAGGGTCCGAGGT
let-7i* GTCGTATCCAGTGCAGGGTCCGAGGTATTCGCACTGGATACGACAGCAAG F: TAGTACTGCGCAAGCTACTGC
R: GTGCAGGGTCCGAGGT
miR-200a* GTCGTATCCAGTGCAGGGTCCGAGGTATTCGCACTGGATACGACTCCAGC F: GAGTGCATCTTACCGGACAGT
R: GTGCAGGGTCCGAGGT
miR-148b* GTCGTATCCAGTGCAGGGTCCGAGGTATTCGCACTGGATACGACGCCTGA F: GGCGCAAGTTCTGTTATACAC
R: GTGCAGGGTCCGAGGT
U6 CGCTTCACGAATTTGCGTGTCAT F: GCTTCGGCAGCACATATACTAAAAT
R: CGCTTCACGAATTTGCGTGTCAT
Li et al.Journal of Experimental & Clinical Cancer Research 2010, 29:169
http://www.jeccr.com/content/29/1/169
Page 3 of 10
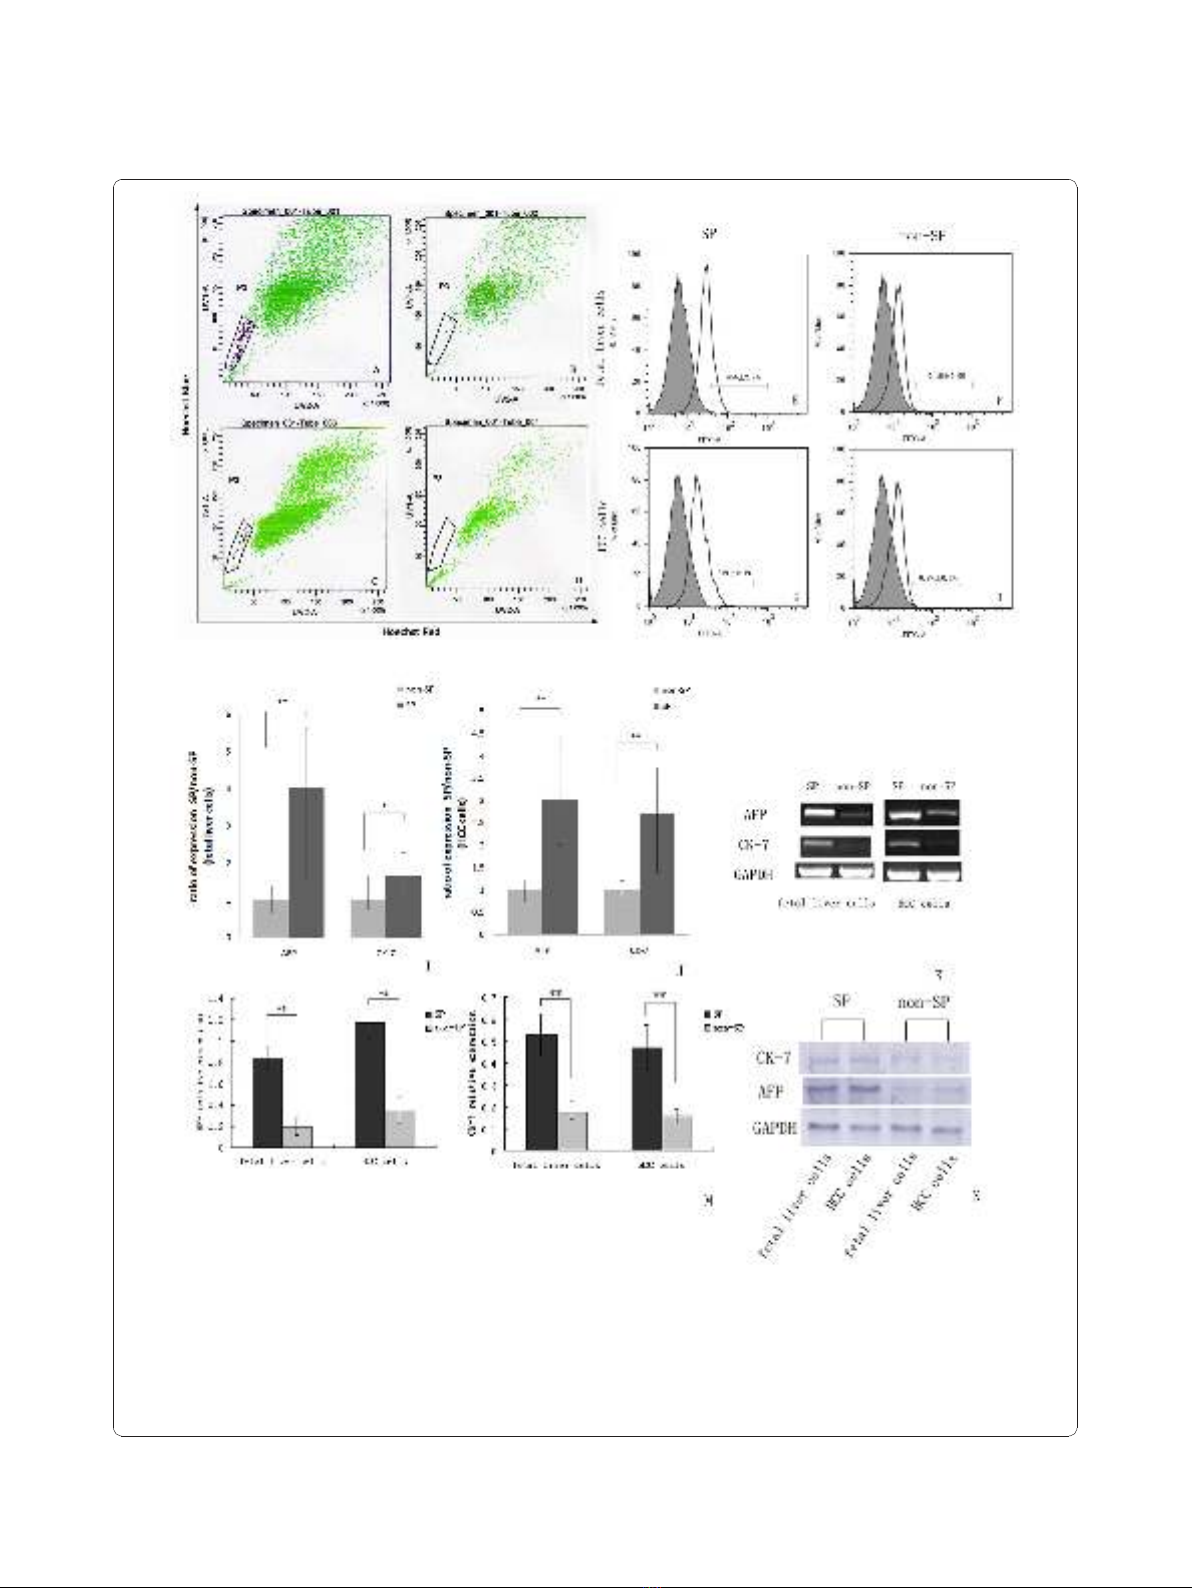
Figure 1 SP cell and non-SP cells analysis. (A and C) Representative side populations (SP) were identified in the P3 gate on the flow
cytometry profile after the cells were stained with Hoechst 33342, (B and D): The SP cells in both HCC cells and fetal liver cells disappeared
(0.0%) when cells are treated with 50 μM verapamil. (E-H) Analysis of stem cell marker expression on the surfaces of SP and non-SP cells. The
number within each histogram represents the percentage of CD90.1 positive cells. (I-K) Quantitative analysis of AFP and CK-7 genes expression
applied to sorted SP cells and non-SP cells by using Real-time RT-PCR. Data were normalized by using GAPDH housekeeping gene as
endogenous control. (* P < 0.05, ** P < 0.01). (L-M) Western-blotting analysis of AFP and CK-7 protein expression in SP cells and non-SP cells.
The relative expressions of protein were calculated through comparing with GAPDH protein.
Li et al.Journal of Experimental & Clinical Cancer Research 2010, 29:169
http://www.jeccr.com/content/29/1/169
Page 4 of 10

contained a distinct fraction of SP cells. The SP of fetal
liver cells was calculated to be 0.15% ± 0.02% (mean ±
SEM), and that of HCC cells was calculated to be 0.20%
± 0.08%. Once identified, the cells in the SP gate were
sorted into a centrifuge pipe by FACS.
SP cells are enriched for markers of HSCs
To examine whether SP cells are enriched for character-
istics of stem cells compared to the non-SP cells, we
further characterized the SP cells from the fetal liver
cells and HCC cells by analyzing the presence of mar-
kers known to be expressed commonly on the surface of
HSCs. FACS analysis showed that CD90.1 positive cells
made up 45% ± 2.7% of total SP from fetal liver cells,
and 37% ± 2.1% of total SP from HCC cells. In contrast,
only 0.1% ± 0.0% (fetal liver cells) and 0.8% ± 0.1%
(HCC cells) were CD90.1 positive cells in non-SP frac-
tions (Figure 1E-H). We next quantitatively compared
the expression of AFP and CK-7 genes between sorted
SP cells and non-SP cells. Real-time RT-PCR analysis
revealed that AFP and CK-7 mRNA level in SP from the
fetal liver cells were increased 4.3-fold and 1.9-fold,
respectively compared to non-SP (Figure 1I). Similarly,
in SP from the HCC cells, they were increased 3.6-fold
and 2.7-fold, respectively (Figure 1J). Furthermore, the
differentially gene expressing profile of AFP and CK-7
in sorted SP cells and non-SP cells also confirmed by
using western-blotting analysis. As shown in Figure, the
relative expression of AFP and CK-7 were 0.84 ± 0.10,
0.53 ± 0.01 in SP from the fetal liver cells. While they
were only 0.20 ± 0.08 and 0.18 ± 0.05 in non-SP cells
(Figure 1L). Similar results also could be seen in HCC
cells group (SP: 1.17 ± 0.0.14, 0.47 ± 0.10; non-SP: 0.35
± 0.12, 0.16 ± 0.04) (Figure 1M). These results indicate
that the SP fraction appeared to be enriched with HSCs
or LCSCs.
miRNAs are differentially expressed in
SP of fetal liver cells and HCC cells
To identify specific miRNAs that might function in neo-
plastic transformation of liver cancer stem cells, we ana-
lyzed global miRNA expression using miRCURY LNA
Array that covered all microRNAs in miRBase. Slides
were scanned using an Agilent G2565BA Microarray
Scanner System and image analysis was carried out with
ImaGene 7.0 software (BioDiscovery). The array data
was further analyzed using SAM. Based on the fold-
changes observed, 68 up-regulated miRNAs and 10
down-regulated miRNAs were identified in the SP of
HCC cells compared to the fetal liver cells. A compre-
hensive list is shown in Table 2. The SAM analysis plot
image is shown in Figure 2, and a hierarchical clustering
image is shown in Figure 3.
Validation of the differentially expressed
miRNAs by qRT-PCR
Using a stringent cut-off of P < 0.05, we found signifi-
cantly altered expression of only 7 of all rat miRNAs
analyzed in SP of HCC cells. In detail, five miRNAs
were significantly up-regulated (miR-21, miR-34c-3p,
miR-470*, miR-10b, let-7i*) and two miRNAs signifi-
cantly down-regulated in SP of HCC cells (miR-200a*,
miR-148b*). miRNA-specific qRT-PCR was used to vali-
date the significantly altered miRNAs from the miRNA
microarray results. As shown in Figure 4A, the results
showed that the expression levels of miR-21, miR-34c-
3p, miR-16, miR-10b, and let-7i* in SP of HCC cells
compared to SP of fetal liver cells were increased 3.5 ±
0.84, 2.1 ± 0.52, 2.2 ± 0.46, 3.9 ± 0.61, and 2.8 ± 0.25
-fold respectively, which were consistent with miRNA
microarray results (P < 0.05). of the down-regulated
miR-200a*, and miR-148b* in SP of HCC cells had the
Table 2 Partial list of miRNAs with significantly different
levels detected in SP of HCC cells compared to fetal liver
cells
microRNA SAM
score
Fold
change
False discovery rate
(FDR) %
hsa-miR-935 0.66 4.32 0.51
mmu-miR-10b 1.00 3.88 0.07
mmu-miR-21 0.80 2.96 0.00
mmu-miR-470* 0.69 2.81 0.00
hsa-miR-34c-3p 0.78 2.79 0.00
hsa-miR-650 0.76 2.71 0.00
hsa-miR-92b* 0.69 2.65 0.03
hsa-miR-193b 0.71 2.59 0.00
hsa-miR-374a* 0.68 2.58 0.24
hsa-miR-548c-3p 0.70 2.54 0.00
hsa-miR-33b 0.66 2.53 0.57
mmu-miR-199a-3p 0.71 2.52 0.00
hsa-miR-330-3p 0.71 2.51 0.00
mmu-miR-376a 0.69 2.48 0.13
mmu-miR-100 0.68 2.44 0.16
mmu-miR-717 0.66 2.36 0.62
mmu-miR-125b-5p 0.66 2.35 0.45
mmu-miR-449a 0.64 2.35 1.09
hsa-miR-21* 0.63 2.31 1.29
mmu-miR-883b-3p 0.63 2.29 1.20
mmu-miR-31 0.59 2.25 2.45
mmu-miR-34b-3p 0.57 2.14 3.43
mmu-let-7i* 0.55 2.02 4.66
hsa-miR-549 -0.70 0.05 2.84
mmu-miR-207 -0.86 0.23 6.02
mmu-miR-200a* -0.94 0.29 1.22
mmu-miR-207 -0.86 0.23 0.60
hsa-miR-148b* -0.76 0.36 2.72
mmu-miR-135a* -0.69 0.38 2.92
Li et al.Journal of Experimental & Clinical Cancer Research 2010, 29:169
http://www.jeccr.com/content/29/1/169
Page 5 of 10


![PET/CT trong ung thư phổi: Báo cáo [Năm]](https://cdn.tailieu.vn/images/document/thumbnail/2024/20240705/sanhobien01/135x160/8121720150427.jpg)


%20--%3e%3cdefs%3e%3cstyle%3e%20.st0%20{%20fill:%20%23fff;%20}%20.st1%20{%20fill:%20%237800fa;%20}%20%3c/style%3e%3c/defs%3e%3cpath%20class='st1'%20d='M117.78,12.18H43.11c2.9,3.47,4.65,7.94,4.65,12.82,0,5.6-2.3,10.66-6.01,14.29h76.02l7.22-13.56-7.22-13.56Z'/%3e%3cg%3e%3cpath%20class='st0'%20d='M53.58,26.17h-.59v-1.46h.59v-4.96h2.83c1.78,0,2.67.94,2.67,2.82v5.76c0,1.87-.89,2.81-2.67,2.81h-2.83v-4.96ZM55.36,21.37v3.34h1.1v1.46h-1.1v3.34h1.01c.61,0,.91-.37.91-1.1v-5.93c0-.74-.3-1.1-.91-1.1h-1.01Z'/%3e%3cpath%20class='st0'%20d='M65.99,31.14h-1.8l-.31-2.07h-2.19l-.31,2.07h-1.64l1.82-11.39h2.62l1.82,11.39ZM65.28,18.04c-.25.46-.51.77-.75.94-.21.15-.47.22-.79.22-.26,0-.57-.07-.92-.22l-.38-.15c-.14-.05-.26-.07-.37-.07-.3,0-.53.18-.71.54l-.91-.68c.25-.46.51-.77.75-.94.21-.14.48-.21.79-.21.26,0,.57.07.92.21l.38.15c.14.05.26.07.37.07.3,0,.53-.18.71-.54l.91.68ZM61.91,27.52h1.73l-.87-5.76-.87,5.76Z'/%3e%3cpath%20class='st0'%20d='M74.53,26.89v1.52c0,1.91-.89,2.86-2.67,2.86s-2.67-.95-2.67-2.86v-5.93c0-1.91.89-2.86,2.67-2.86s2.67.95,2.67,2.86v1.11h-1.69v-1.22c0-.75-.31-1.12-.93-1.12s-.93.37-.93,1.12v6.15c0,.74.31,1.11.93,1.11s.93-.37.93-1.11v-1.63h1.69Z'/%3e%3cpath%20class='st0'%20d='M81.4,31.14h-1.8l-.31-2.07h-2.19l-.31,2.07h-1.64l1.82-11.39h2.62l1.82,11.39ZM75.9,19.2l1.52-1.91h1.71l1.51,1.91h-1.61l-.76-.95-.75.95h-1.61ZM77.32,27.52h1.73l-.87-5.76-.87,5.76ZM83.1,15.99l-1.76,1.91h-1.26l1.17-1.91h1.86Z'/%3e%3cpath%20class='st0'%20d='M84.86,19.75c1.78,0,2.67.94,2.67,2.82v1.48c0,1.87-.89,2.81-2.67,2.81h-.85v4.28h-1.79v-11.39h2.64ZM84.01,21.37v3.86h.85c.58,0,.87-.36.87-1.08v-1.71c0-.71-.29-1.07-.87-1.07h-.85Z'/%3e%3cpath%20class='st0'%20d='M93.51,19.75c1.78,0,2.67.94,2.67,2.82v1.48c0,1.87-.89,2.81-2.67,2.81h-.85v4.28h-1.79v-11.39h2.64ZM92.66,21.37v3.86h.85c.58,0,.87-.36.87-1.08v-1.71c0-.71-.29-1.07-.87-1.07h-.85Z'/%3e%3cpath%20class='st0'%20d='M98.8,31.14h-1.79v-11.39h1.79v4.88h2.03v-4.88h1.83v11.39h-1.83v-4.88h-2.03v4.88Z'/%3e%3cpath%20class='st0'%20d='M105.36,24.55h2.46v1.62h-2.46v3.34h3.09v1.63h-4.88v-11.39h4.88v1.63h-3.09v3.18ZM108.17,17.29l-1.76,1.91h-1.26l1.17-1.91h1.86Z'/%3e%3cpath%20class='st0'%20d='M112.2,19.75c1.78,0,2.67.94,2.67,2.82v1.48c0,1.87-.89,2.81-2.67,2.81h-.85v4.28h-1.79v-11.39h2.64ZM111.35,21.37v3.86h.85c.58,0,.87-.36.87-1.08v-1.71c0-.71-.29-1.07-.87-1.07h-.85Z'/%3e%3c/g%3e%3ccircle%20class='st1'%20cx='25'%20cy='25'%20r='20'/%3e%3cpath%20class='st0'%20d='M32.78,19.27c2.92,0,4.43,2.55,5.28,5.33l.71,2.17c.14.38-.33.75-.71.75h-5.61c.19-.33.24-.71.09-1.08l-.75-2.45c-.43-1.32-.99-2.64-1.79-3.77.75-.57,1.65-.94,2.78-.94h0ZM25,18.38c3.25,0,4.9,2.78,5.89,5.89l.76,2.45c.14.42-.33.8-.8.8h-11.69c-.42,0-.94-.38-.8-.8l.75-2.45c.99-3.11,2.64-5.89,5.89-5.89h0ZM25,11.35c1.74,0,3.11,1.37,3.11,3.11s-1.37,3.11-3.11,3.11-3.11-1.41-3.11-3.11,1.41-3.11,3.11-3.11h0ZM17.27,19.27c1.08,0,1.98.38,2.73.94-.8,1.13-1.37,2.45-1.74,3.77l-.8,2.45c-.14.38-.05.75.09,1.08h-5.56c-.42,0-.9-.38-.75-.75l.71-2.17c.9-2.78,2.41-5.33,5.33-5.33h0ZM17.27,12.91c1.51,0,2.78,1.27,2.78,2.83s-1.27,2.83-2.78,2.83-2.83-1.27-2.83-2.83,1.27-2.83,2.83-2.83h0ZM32.78,12.91c1.56,0,2.78,1.27,2.78,2.83s-1.23,2.83-2.78,2.83-2.83-1.27-2.83-2.83,1.27-2.83,2.83-2.83h0ZM27.07,28.56v.09c0,.57-.24,1.08-.61,1.46h0v.05c-.38.33-.9.57-1.46.57s-1.08-.24-1.46-.61h0c-.38-.38-.61-.9-.61-1.46v-.09h1.41v.09c0,.19.05.38.19.47v.05c.09.09.28.19.47.19s.38-.09.47-.19v-.05c.14-.09.24-.28.24-.47t-.05-.09h1.41ZM30.99,28.56v.09c0,1.65-.66,3.16-1.74,4.24-1.08,1.08-2.59,1.79-4.24,1.79s-3.16-.71-4.24-1.79l-.05-.05c-1.04-1.08-1.7-2.55-1.7-4.2v-.09h1.41v.09c0,1.27.47,2.4,1.27,3.25h.05c.85.85,1.98,1.37,3.25,1.37s2.4-.52,3.25-1.37c.85-.8,1.37-1.98,1.37-3.25v-.09h1.37ZM34.99,28.56v.09c0,2.78-1.13,5.28-2.92,7.07-1.79,1.79-4.29,2.92-7.07,2.92s-5.23-1.13-7.07-2.92c-1.79-1.79-2.92-4.29-2.92-7.07v-.09h1.41v.09c0,2.4.94,4.53,2.5,6.08,1.56,1.56,3.72,2.5,6.08,2.5s4.52-.94,6.08-2.5c1.56-1.56,2.5-3.68,2.5-6.08v-.09h1.41Z'/%3e%3c/svg%3e)