
* Corresponding author.
E-mail addresses: aaa_elhady@yahoo.com (A. A. Abd-Elhady)
© 2013 Growing Science Ltd. All rights reserved.
doi: 10.5267/j.esm.2013.10.001
Engineering Solid Mechanics 1 (2013) 119-128
Contents lists available at GrowingScience
Engineering Solid Mechanics
homepage: www.GrowingScience.com/esm
Mixed mode I/II stress intensity factors through the thickness of disc type specimens
Amr A. Abd-Elhady*
Mechanical Design Department, Faculty of Engineering, Helwan University, Cairo 11718, Egypt
A R T I C L E I N F O A B S T R A C T
Article history:
Received March 20, 2013
Received in Revised form
September, 14, 2013
Accepted 22 September 2013
Available online
23 October 2013
Mode I and mode II stress intensity factors (SIFs) through the thickness of edge crack in semi
circular bend (SCB) and center cracked circular disc (CCCD) specimens have been analyzed
using three dimensional finite element analysis. The effect of the CCCD and SCB specimen
thickness on the through-thickness variations of SIFs has been studied. For all mode of mixity,
the peak value of mode I SIF is found at mid plane of SCB specimen and for thin CCCD
specimen, while, this location is shifted to be near the free surface plane in thick CCCD
specimen. The variation of mode II SIF in CCCD and SCB specimens have a similar trend.
© 201
3
Growing Science Ltd. All rights reserved.
Keywords:
Stress intensity factor
Mixed mode I/II
SCB specimen
CCCD specimen
Three dimensional finite element
1. Introduction
Cracks experience a combination of two major modes of loading: mode I and mode II due to arbitrary
orientation of flaws relative to the overall applied loads. Two frequently employed disc type
specimens are the center cracked circular disc (CCCD), subjected to diametral compression, often
called the Brazilian disc, and the edge cracked semi circular bend (SCB) specimen subjected to three-
point bend loading. The major advantages in using these two specimens are that specimens can be
easily extracted from the cores of rocks materials, they have a simple geometry and simple loading
configuration. In addition, the test procedure is straightforward, there are few machining operations
and different mode of mixities may be introduced from pure mode I to pure mode II. Hence these test
specimens have been used frequently to investigate mixed mode crack growth of rock materials,
concrete, biomaterials, and other material (e.g. Chen et al. 1998; Ouinas et al. 2009; Aliha &
Ayatollahi, 2009, 2013; Sallam & Abd-Elhady, 2012; AL-Maghrabi & Abd-Elhady, 2013; Aliha et
al., 2010, 2012a,b; Saghafi et al., 2010). Ayatollahi and Aliha (2007) depicted that the normalized
120
mode I and mode II stress intensity factor are functions of the crack length ratio a/R and crack angle
only for CCCD specimen and crack length ratio a/R, crack angle
and S/R for SCB specimen as
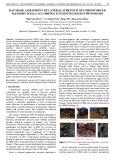
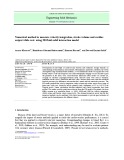
shown in Fig. 1.
Fig. 1. Geometry and loading conditions of CCCD and SCB specimens subjected to mixed mode I/II loading
The stress state near an actual crack tip is always three-dimensional and can significantly influence
crack growth. Hutar et al. (2010) show that, the stress singularity exponent is not constant along the
crack front and the stress field around the crack tip are usually based on stress intensity factors.
Garcia-Manrique et al. (2013) used Al 2024-T35 compact tension specimen under mode I nominal
loading to evaluate the SIFs distribution along the thickness. They concluded that, a smaller SIFs
value is present near the surface than in the interior causing a smaller plastic zone than the expected
value with plane stress condition. Kwon and Sun (2000) concluded that, except for plates with very
large thicknesses, the 2-D SIFs is quite different from the 3-D SIFs at the mid-plane. Furthermore,
the profile of stress intensity along the thickness direction is still in question. Kown and Sun (2000)
stated that, SIFs should drop to zero at the plate free surface due to the weaker singularity than square
root, but this is difficult to obtain by the finite element method
Accurate stress analyses of these through-cracks components are needed for reliable prediction of
their crack-growth and fracture strengths. However, because of the complexities of such problems,
exact solutions are not available. To the best knowledge of the author, SIFs through the thickness of
edge crack in SCB and CCCD specimens is still not fully studied. Among the very few research
studies in this field, Aliha and Saghafi (2013) performed recently several three-dimensional
numerical analyses to study the effect of thickness and Poisson’s ratio on mixed mode fracture
parameters of the SCB specimen. Therefore, this paper concentrated on computation the SIFs through
the thickness of CCCD and of SCB specimens for different specimen thicknesses and mode of
mixities using 3D FEA.
2. Finite element analysis
Fig. 1 shows the geometry and loading condition of the CCCD and SCB specimens used for mixed
mode I/II fracture tests. In the CCCD specimen, the orientation of the center crack of length 2a
relative to the applied load P is defined by the angle
and varies the state of crack deformation,

A. A. Abd-Elhady / Engineering So lid Mechanics 1 (2013)
121
giving different combinations of modes I and II. Similarly for the SCB specimen, by changing the
inclination angle
of the edge crack of length a with respect to the applied load P, various mode of
mixities can be achieved. For both specimen shapes,
= 0o corresponds to pure mode I (opening
mode) loading. By increasing the loading angle
from zero, mode II is introduced.
To study the effect of mode of mixity and the effect of specimen thickness, B, on through-thickness
stress intensity factor, several CCCD and SCB specimens with different crack angles were simulated.
The geometry and dimensions of the CCCD and SCB specimens are listed in Table 1. For the sake of
comparison, the basic dimensions of CCCD and SCB specimens R (specimen radius), 2t or B
(specimen thickness), and a were considered to be the same for each two corresponding specimen
sizes (see Table 1). SCB specimen is placed on two bottom supports of distance 2S. Thus, the ratio of
a/R was equal to 0.3 and the ratio of S/R was 0.43 in the SCB specimens. Mixity parameter, Me, is
defined as (Aliha et al., 2010):
II
I
e
K
K
Marctan
2
,
(1)
where KI and KII are mode I and mode II stress intensity factors, respectively. In the present analysis,
the values of Me varied through 1 (pure mode I), 0.75, 0.5, 0.25 and 0 for pure mode II.
The general-purpose finite element program ABAQUS (2002) was used. A three-dimensional finite
element model has been developed to account for geometric and material behavior of isotropic
material. In the present work, the domain integral method used to extract stress intensity factors
(SIFs). The domain integral method has proven useful for both two and three-dimensional crack
problems. In the domain integral method, a crack-tip contour integral is expressed as an equivalent
domain/volume integral over a finite domain surrounding the crack tip. A domain integral method
commonly used to extract stress intensity factors (SIFs) (Nakamura & Parks, 1989; Nakamura, 1991;
Gosz et al., 1998; Gosz & Moran 2002). The finite element meshes constructed with hexagonal
structural mesh, C3D8 (8-node linear brick) elements, are used under Standard/static analysis.
Around from 32 planar layers are divided through the thickness of the specimen varying with the
plate thickness. Within each layer, the size of element decreases gradually with distance from the
crack tip decreasing. The finite element meshes in the neighborhood of the crack tip are much denser.
The values of mode I and II stress intensity factor were traced over the crack front of the specimen
from the mid plane of specimen where z = 0 to the specimen surface where z = t. In the present
analysis, the mode I and mode II normalized stress intensity factors are denoted as YI and YII,
respectively, and it can be deduced from Lim et al. (1993) and Hutar et al. (2010). The general
formula for normalized stress intensity factor Yi, which is defined as:
aP
RtK
Yi
i
4
i = I, II for SCB specimen (1)
aP
RtK
Yi
i
2
i = I, II for CCCD specimen
(2)
where:
KI = mode I stress intensity factor
KII = mode II stress intensity factor
t = B/2 half specimen thickness
P = applied load
R = radius of specimen
a = crack length
122
The normalized mode I and mode II stress intensity factors at the midpoint of the specimen (at z = 0)
are YImp and YIImp, respectively, and at surface point of specimen (at z = t) are YIsurf and YIIsurf.
Table 1
Specimen geometries and crack inclination angles in the tested CCCD and SCB specimen
R (mm) 2t (mm) a (mm)
(
o
)
= B M
e
= 1 M
e
= 0.75 M
e
= 0.5 M
e
= 0.25 M
e
= 0
CCCD
75
15
22.5
0
5
10.5
18
27
75
30
22.5
0
5
10.5
18
27
75 45 22.5 0 5 10.5 18 27
75 60 22.5 0 5 10.5 18 27
SCB
75
15
22.5
0
18.5
33
42.5
50
75 30 22.5 0 18.5 33 42.5 50
75 45 22.5 0 18.5 33 42.5 50
75
60
22.5
0
18.5
33
42.5
50
3. Results and discussion
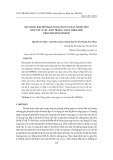
To verify the accuracy of the present result for SIFs evaluation, the values of various normalized
mode I and mode II stress intensity factors at the surface of CCCD and SCB specimens (Z = t), for R
= 75 mm, B = 7.5 mm, a/R = 0.3 and S/R = 0.43 are compared with the previous numerical results
using 2-D analysis found in the literature, R = 50 mm, B = 5 mm, a/R = 0.3 and S/R = 0.43
(Ayatollahi & Aliha 2007; Aliha et al., 2010), as shown in Figures 2 and 3. Figures 2 and 3 show a
good agreement between the present results for normalized mode I and mode II stress intensity
factors and those obtained by Ayatollahi and Aliha (2007,2008) and Aliha et al. 2010. The values of
normalized mode I and mode II stress intensity factors at the mid plane (at z = 0) and at free surface (z
= t) of CCCD and SCB specimens are tabulated in tables 2 and 3 respectively. The value of YImp of
CCCD specimen decreases by increasing B/R, while, YIsurf increases. The value of YIsurf of SCB
decreases by increasing B/R. YIsurf and YImp of CCCD and SCB specimens decrease by decreasing the
value of mixity parameter.
Fig. 2. Comparison between the present normalized YI at the free surface of the specimen
and those found in the literature using 2-D analysis (Aliha et al. 2010)
0
0.5
1
1.5
2
2.5
3
0 0.2 0.4 0.6 0.8 1
Y
Isurf
mixity parameter, M
e
CCCD present work
SCB present work
CCCD Ref. 8
SCB Ref. 8
SCB specimen
CCCD specimen
A. A. Abd-Elhady / Engineering So lid Mechanics 1 (2013)
123
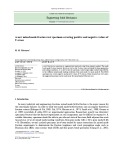
Fig. 3. Comparison between the present normalized YII at the free surface of the specimen
and those found in the literature using 2-D analysis (Aliha et al. 2010)
Table 2
The values of normalized mode I stress intensity factor YI at mid point (z/t = 0) and at surface (z/t = 1)
for the CCCD and SCB specimens for different values of Me and different specimen thickness ratios.
Specimen B/R M
e
= 1 M
e
= 0.75 M
e
= 0.5 M
e
= 0.25 M
e
= 0
CCCD
0.2
Y
Imp
1.17474
1.12806
0.97819
0.62394
0
Y
Isur
1.10662 1.05881 0.92223 0.58257 0
0.4 Y
Imp
1.15584 1.10799 0.96398 0.60951 0
Y
Isur
1.12696
1.07748
0.93850
0.58931
0
0.6 Y
Imp
1.13433 1.08638 0.95097 0.60126 0
Y
Isur
1.14119
1.09197
0.96065
0.60402
0
0.8 Y
Imp
1.10684 1.06073 0.92154 0.57824 0
Y
Isur
1.18888
1.13710
0.99391
0.63199
0
SCB
0.2 Y
Imp
2.09601 1.65985 0.85306 0.32454 0
Y
Isur
1.83337 1.42287 0.67280 0.17889 0
0.4
Y
Imp
2.10187
1.67603
0.87104
0.35329
0
Y
Isur
1.77569 1.36208 0.60562 0.12369 0
0.6
Y
Imp
2.10794
1.65012
0.86398
0.33354
0
Y
Isur
1.73930 1.29862 0.55021 0.07408 0
0.8 Y
Imp
2.07458 1.64056 0.82505 0.31634 0
Y
Isur
1.71102
1.28638
0.51505
0.05856
0
0
0.5
1
1.5
2
2.5
0 0.2 0.4 0.6 0.8 1
YIIsurf
mixity parameter, M
e
CCCD present work
SCB present work
CCCD Ref. 8
SCB Ref. 8
SCB specimen
CCCD specimen


![Bài tập tối ưu trong gia công cắt gọt [kèm lời giải chi tiết]](https://cdn.tailieu.vn/images/document/thumbnail/2025/20251129/dinhd8055/135x160/26351764558606.jpg)