76 Hoa Binh University Journal of Science and Technology - No 14 - 12.2024
MEDICINE
THE STATUS-QUO OF MYOPIA AMONG HIGH SCHOOL PUPILS AT
THANH OAI B HIGH SCHOOL, THANH OAI DISTRICT, HANOI, 2023
Prof. Dr. Nguyen Duc Trong1, Le Thi Tam2
Hoa Binh University1
1Lac Son District Medical Center
Corresponding Author: ndtrong@daihochoabinh.edu.vn
Received: 11/12/2024
Accepted: 20/12/2024
Published: 24/12/2024
Abstract
Objective: To describe the status-quo of school myopia among pupils at Thanh Oai B High
School, Thanh Oai District, Hanoi, in 2023.
Methods:
- Subjects: 425 students grades 10 to 12 at Thanh Oai B High School, Thanh Oai District,
Hanoi, during the 2022-2023 academic year.
- Study Design: A cross-sectional descriptive study.
Results: The proportion of myopia among students at Thanh Oai B High School during the
2022–2023 academic year accounted for 46.4%. The incidence was notably higher in female
students (53.4%) compared to male counterparts (34.4%). The distribution of myopia severity
included mild (66.5%), moderate (29.9%), and severe (3.6%) cases. Among students diagnosed with
myopia, 97.9% had undergone vision assessments and were provided with corrective lenses.
Conclusion: This study reveals a high incident rate of myopia (46.4%) among students at Thanh
Oai B High School, highlighting the need for targeted interventions and preventive measures.
Keywords: School myopia school, refractive error.
Thực trạng cận thị ở học sinh Trường Trung học phổ thông Thanh Oai B, huyện Thanh Oai,
Hà Nội năm 2023
GS.TS Nguyễn Đức Trọng1, Lê Thị Tâm2
Trường Đại học Hòa Bình
Trung tâm Y tế huyện Lạc Sơn
Tác giả liên hệ: ndtrong@daihochoabinh.edu.vn
Tóm tắt
Mục tiêu: Mô tả thực trạng cận thị học đường ở học sinh Trường Trung học phổ thông (THPT)
Thanh Oai B, huyện Thanh Oai, Hà Nội năm 2023.
Đối tượng và phương pháp:
- 425 học sinh từ khối 10 đến khối 12 của Trường THPT Thanh Oai B, huyện Thanh Oai, Hà
Nội năm học 2022-2023.
- Thiết kế nghiên cứu mô tả cắt ngang.
Kết quả: Tỷ lệ cận thị của học sinh tại Trường THPT Thanh Oai B, huyện Thanh Oai, Hà Nội
năm học 2022-2023 là 46,4%. Trong đó, học sinh nữ (53,4%), cao hơn nam (34,4%). Tỷ lệ cận thị
nhẹ chiếm 66,5%; trung bình 29,9% và nặng 3,6%. Trong số đối tượng cận thị, có 97,9% đã khám
và lựa chọn kính đeo phù hợp.
Kết luận: Nghiên cứu này cho thấy tỷ lệ cận thị của học sinh Trường THPT Thanh Oai B,
huyện Thanh Oai, Hà Nội năm học 2022-2023 khá cao, chiếm tới 46,4 %.
Từ khóa: Cận thị học đường, tật khúc xạ.
No 14 - 12.2024 - Hoa Binh University Journal of Science and Technology 77
MEDICINE
1. Introduction
Myopia is a common refractive error,
especially among school-aged children. It is
characterized by excessive focusing power
on relation to the axial length of the eye,
leading to light focusing in front of the retina
and resulting in blurred vision. The rising
prevalence of myopia can be attributed to
societal changes and lifestyle habits, such as
prolonged reading and extensive screen time
[1]. This condition adversely impacts quality
of life, particularly in children, and can hinder
both health and academic performance.
According to the WHO’s 2019 "World Report
on Vision," over 2.2 billion people worldwide
suffer from vision impairment, with over
1 billion cases being preventable [2]. The
incident rate of myopia varies by region, with
relatively low rates in Africa and significantly
higher rates observed in Asia
The increase in myopia can be attributed
to a combination of genetic, environmental and
behavioral factors. Notably, excessive exposure
to screens and working at close distances, which
significantly contribute to vision deterioration,
with studies indicating a potential 90% loss of
vision associated with screen use exceeding
three hours per day. Research indicates that the
high prevalence of refractive errors, particularly
myopia, among school children is attributed not
only to genetic factors but also to environmental
and nutritional influences [2]. Additionally,
environmental factors significantly contribute
to the rising prevalence of myopia in East
Asia. Vietnam, in particular, has a high rate of
myopia, which is rapidly increasing. Although
school myopia has been recognized since the
1960s, it remains prevalent and is on the rise
in both urban and rural areas. Research by Tran
Duc Nghia in primary schools in Dien Bien
City revealed a myopia rate of 17.2%, showing
a gradual increase from 10.3% in grade 1 to
26.7% in grade 5 [3]. In high school, a study
by Nghiem Thi Hoai Thanh found that the
prevalence of school myopia reached 51.6% [4].
Thanh Oai B High School, Thanh Oai District,
Hanoi with a total of 1,727 students in the 2022-
2023 academic year. To contribute to the care
and protection of students' health, we conducted
a research on the topic “The status-quo of
myopia in pupils at Thanh Oai B High School,
Thanh Oai District, Hanoi in 2023” with the
objective of describing the current status of
school myopia in students at Thanh Oai B High
School, Thanh Oai District, Hanoi in 2023.
2. Objects and research methods
2.1. Study Subjects
Pupils grades 10 to 12 at Thanh Oai B High
School, Thanh Oai District, Hanoi, in the 2022-
2023 academic year.
Inclusion criteria:
- Pupils in grades 10, 11, and 12 at the time
of the study.
- Pupils who voluntarily agreed to
participate in the study.
Exclusion criteria:
- Pupils who were absent due to illness,
leave, or other reasons during the study period.
- Pupils who did not voluntarily consent to
participate in the study.
2.2. Research Methods
2.2.1. Study Design
Cross-sectional descriptive study combined
with retrospective data on visual acuity
measurements of the subjects based on periodic
health check-up records.
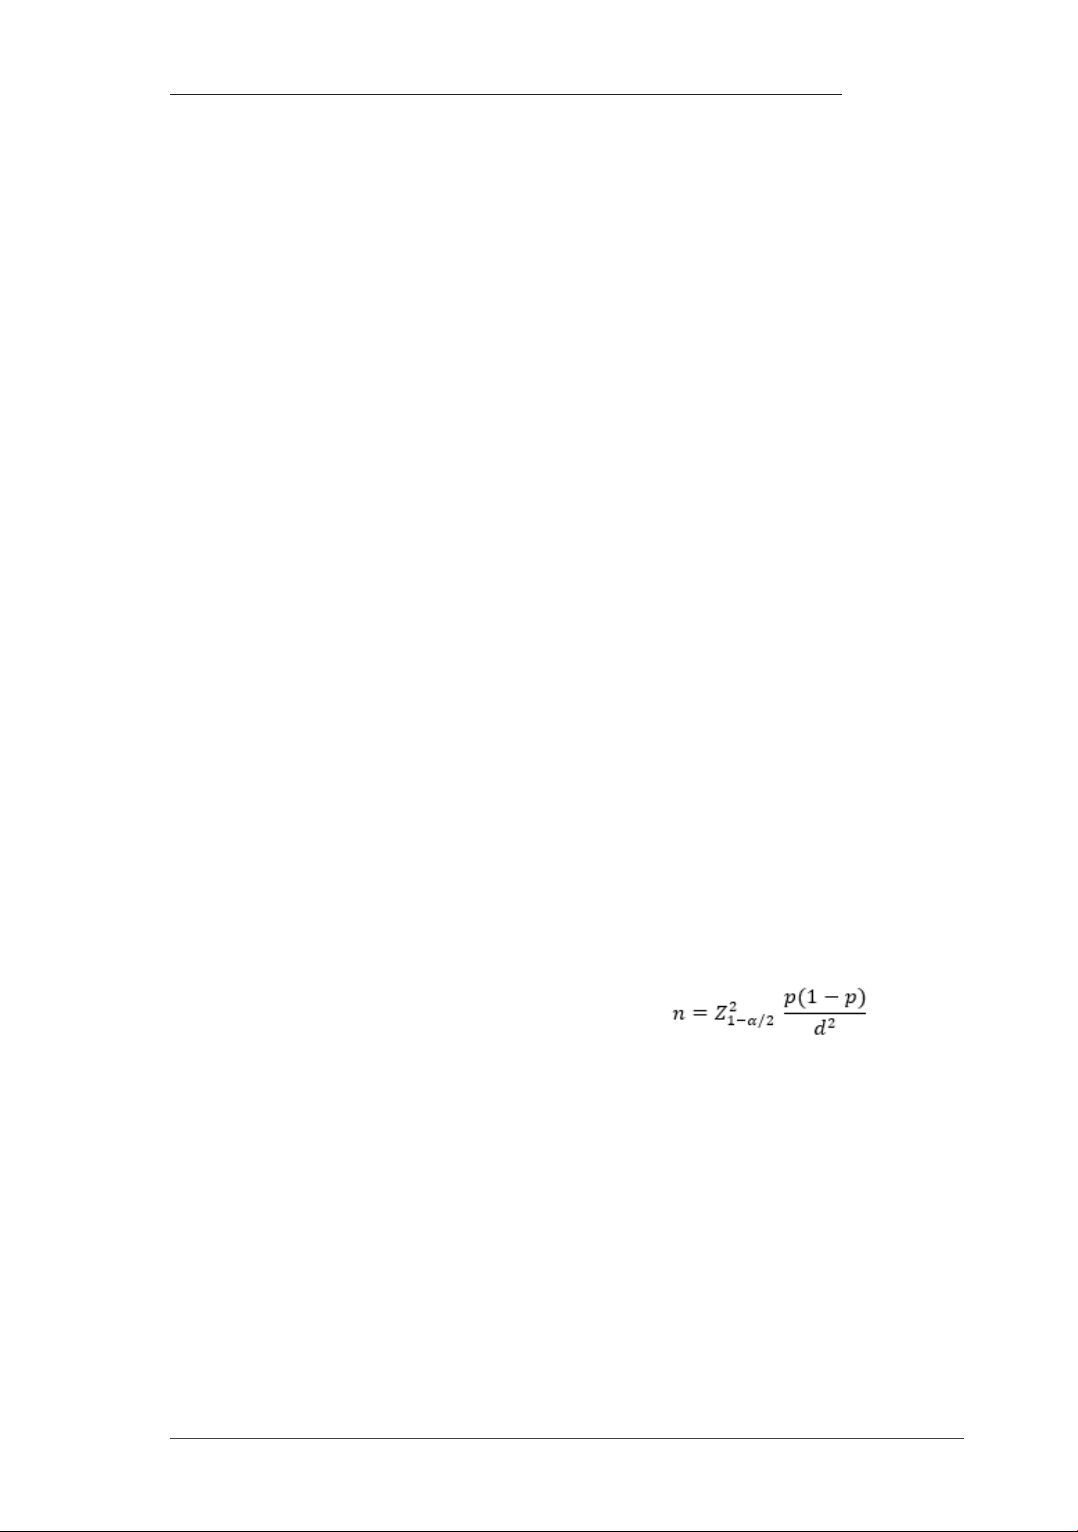
2.2.2. Sample Size and Sampling Method
Sample size: The sample size was
calculated using the formula for estimating a
proportion in a descriptive study:
Where:
- n is the minimum sample size required for the
study,
- Z(1−α/2) is the confidence coefficient. For a
95% confidence level (α=0.05, Z(1−α/2)=1.96
- p is the estimated proportion of subjects with
school myopia, taken as p=0.51 ([4]),
- d is the absolute margin of error, set at d=0.05.
Substituting these values into the formula, the
minimum sample size required for the study
was calculated to be n=385. An additional
10% contingency was added, bringing the total
required sample size to 425 students.
78 Hoa Binh University Journal of Science and Technology - No 14 - 12.2024
MEDICINE
Sampling Method: Given the significant
disparity in the number of students across the
different grade levels, a stratified sampling
method was employed to ensure the sample
adequately represents the population.
The sample size for each grade level was
determined using the following formula:
Table 2.1. Sample Size by Grade Level
The students were selected from each grade
using a systematic random sampling method.
- A complete list of all students enrolled
in grades 10, 11, and 12 at Thanh Oai B High
School was compiled.
- The sampling interval (k) was calculated
for each grade k = N/n = 1726/425= 4
- With k=4 for all three grades, we randomly
selected one student (i) from each grade's list,
and then selected every fourth student (i + k, i
+ 2k, i + 3k, etc.) until the required number of
participants for each grade level was reached.
2.2.3. Data Analysis and Processing
Data entry was performed using EpiData
3.1 software. After data entry and validation, the
dataset was transferred to SPSS for management
and statistical analysis. The following medical
statistical methods were employed:
- For quantitative variables: Mean, standard
deviation, minimum and maximum values.
- For categorical variables: Frequency and
percentage distribution. The data were presented
in tables and graphical charts for clarity. The
Chi-square test was used for testing associations
between categorical variables, with a significance
level of p<0.05.
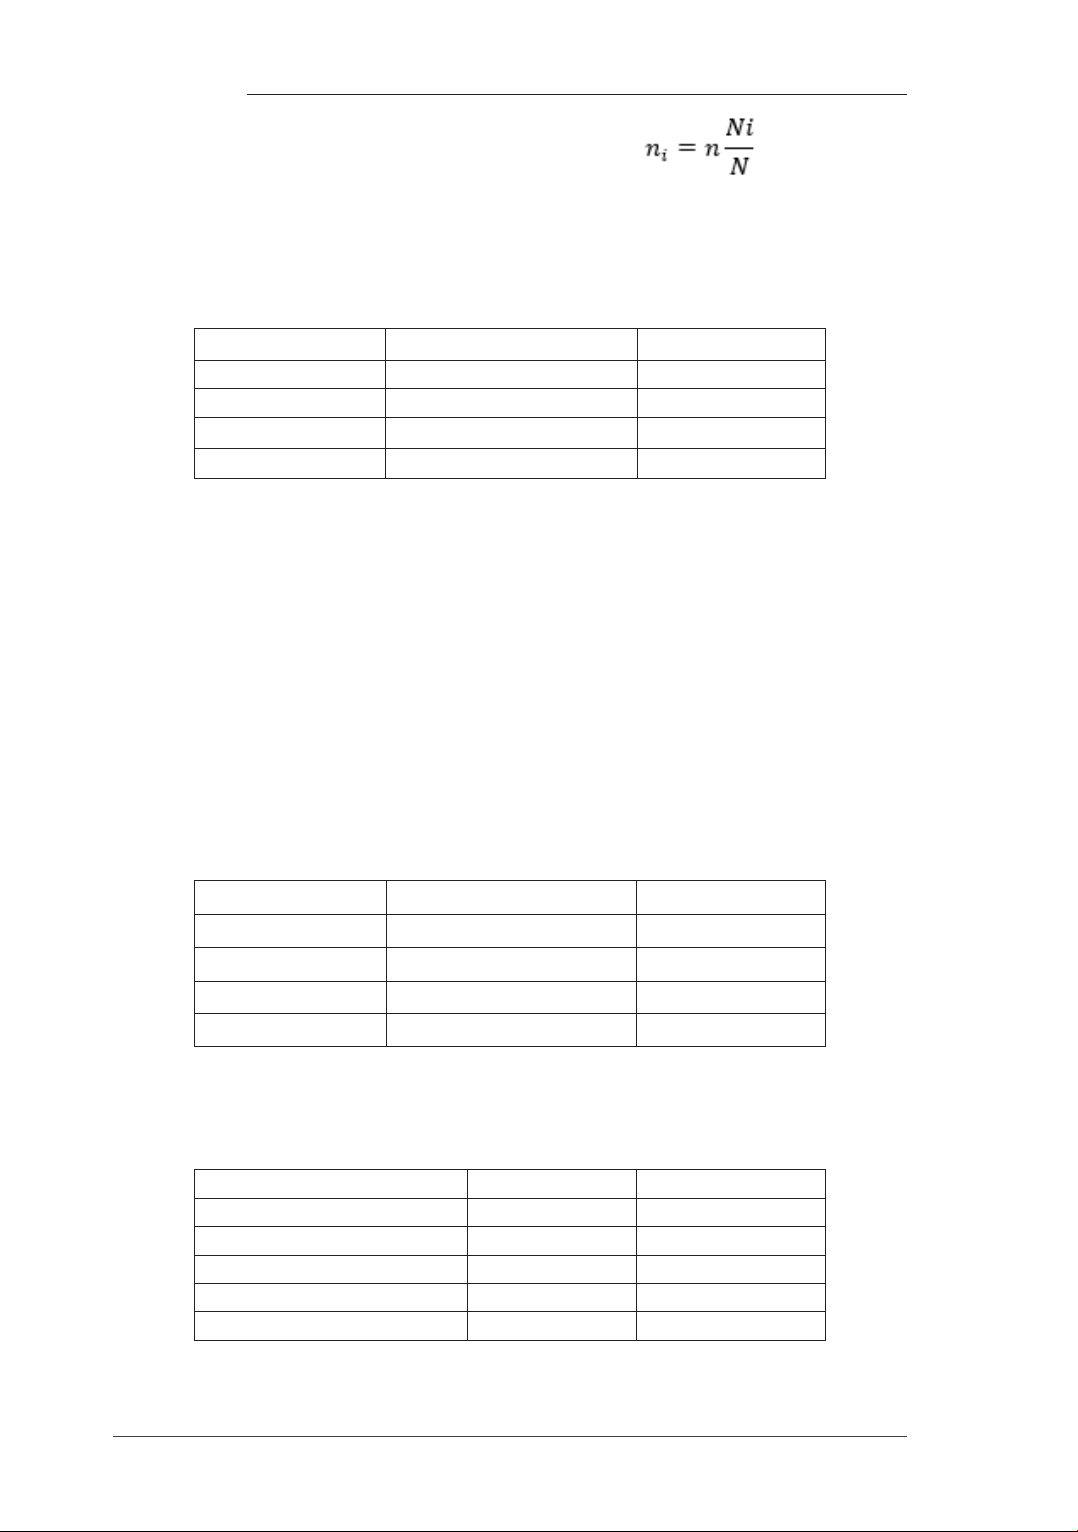
Table 3.1. Distribution of Study Subjects by Grade Level (n=425)
Highlights: Among the 425 study subjects, Grade 12 had the lowest proportion at 21.9%.
Grades 10 and 11 had nearly identical proportions, accounting for 38.8% and 39.3% of the total
sample, respectively.
Grade Level Total Number of Pupils Sample Size
Grade 10 670 165
Grade 11 678 167
Grade 12 378 93
Total 1726 425
Grade Level Number of Pupils Percentage (%)
Grade 10 165 38.8
Grade 11 167 39.3
Grade 12 93 21.9
Total 425 100
Where:
- ni is the sample size for each grade,
- Ni is the number of students in each grade,
- N is the total number of students in the school.
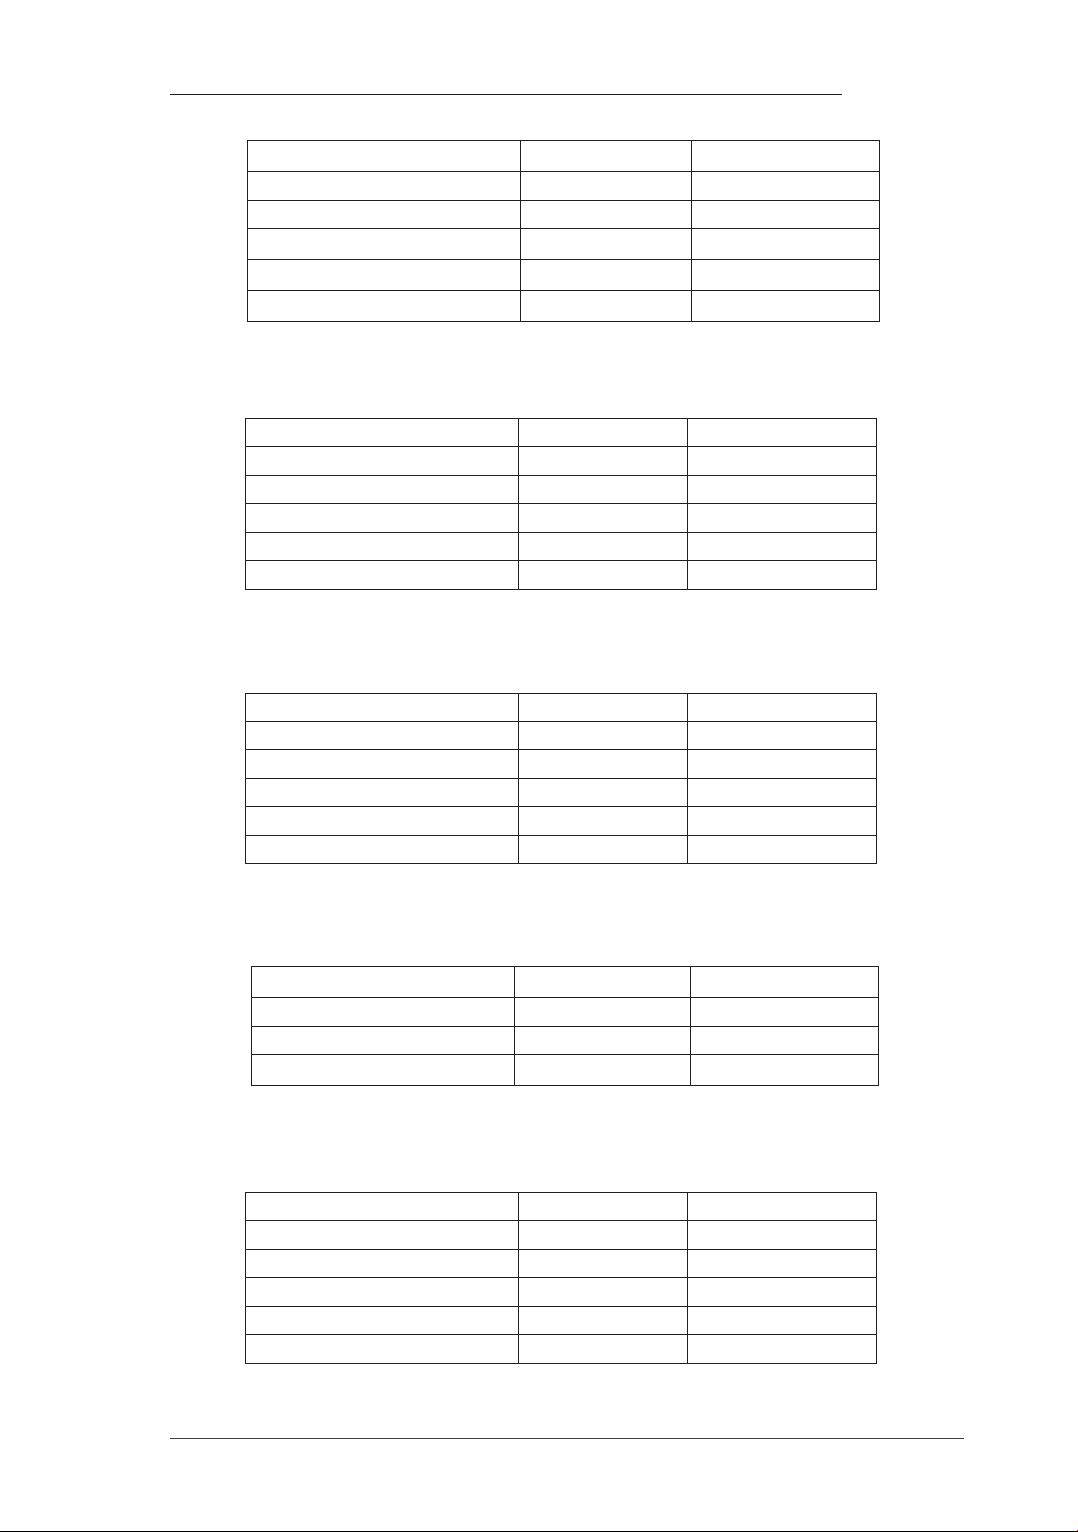
Highlights: The most common educational levels of fathers were high school (44.2%) and
secondary school (26.4%). The proportion of fathers with only a primary school education was the
lowest, at 3.5%.
Table 3.2. Educational Level of Fathers of Study Participants (n=425)
Educational Level Number Percentage (%)
Primary school 15 3.5
Secondary school (middle) 112 26.4
High school 188 44.2
Vocational/College 60 14.1
University/Postgraduate 50 11.8
No 14 - 12.2024 - Hoa Binh University Journal of Science and Technology 79
MEDICINE
Table 3.3. Occupation of Fathers of Study Participants (n=425)
Highlights: The majority of fathers were engaged in farming (42.1%), while civil servants/
employees accounted for the smallest proportion (7.3%).
Table 3.4. Educational Level of Mothers of Study Participants (n=425)
Highlights: The most common educational levels of mothers were high school (45.2%) and
secondary school (24.9%). Over 13% of mothers had vocational/college or university education.
Table 3.5. Occupation of Mothers of Study Participants (n=425)
Highlights: The majority of mothers were involved in farming (40.5%), while 24.7% of mothers had
a business occupation. The smallest proportion of mothers worked as civil servants/ employees (9.9%).
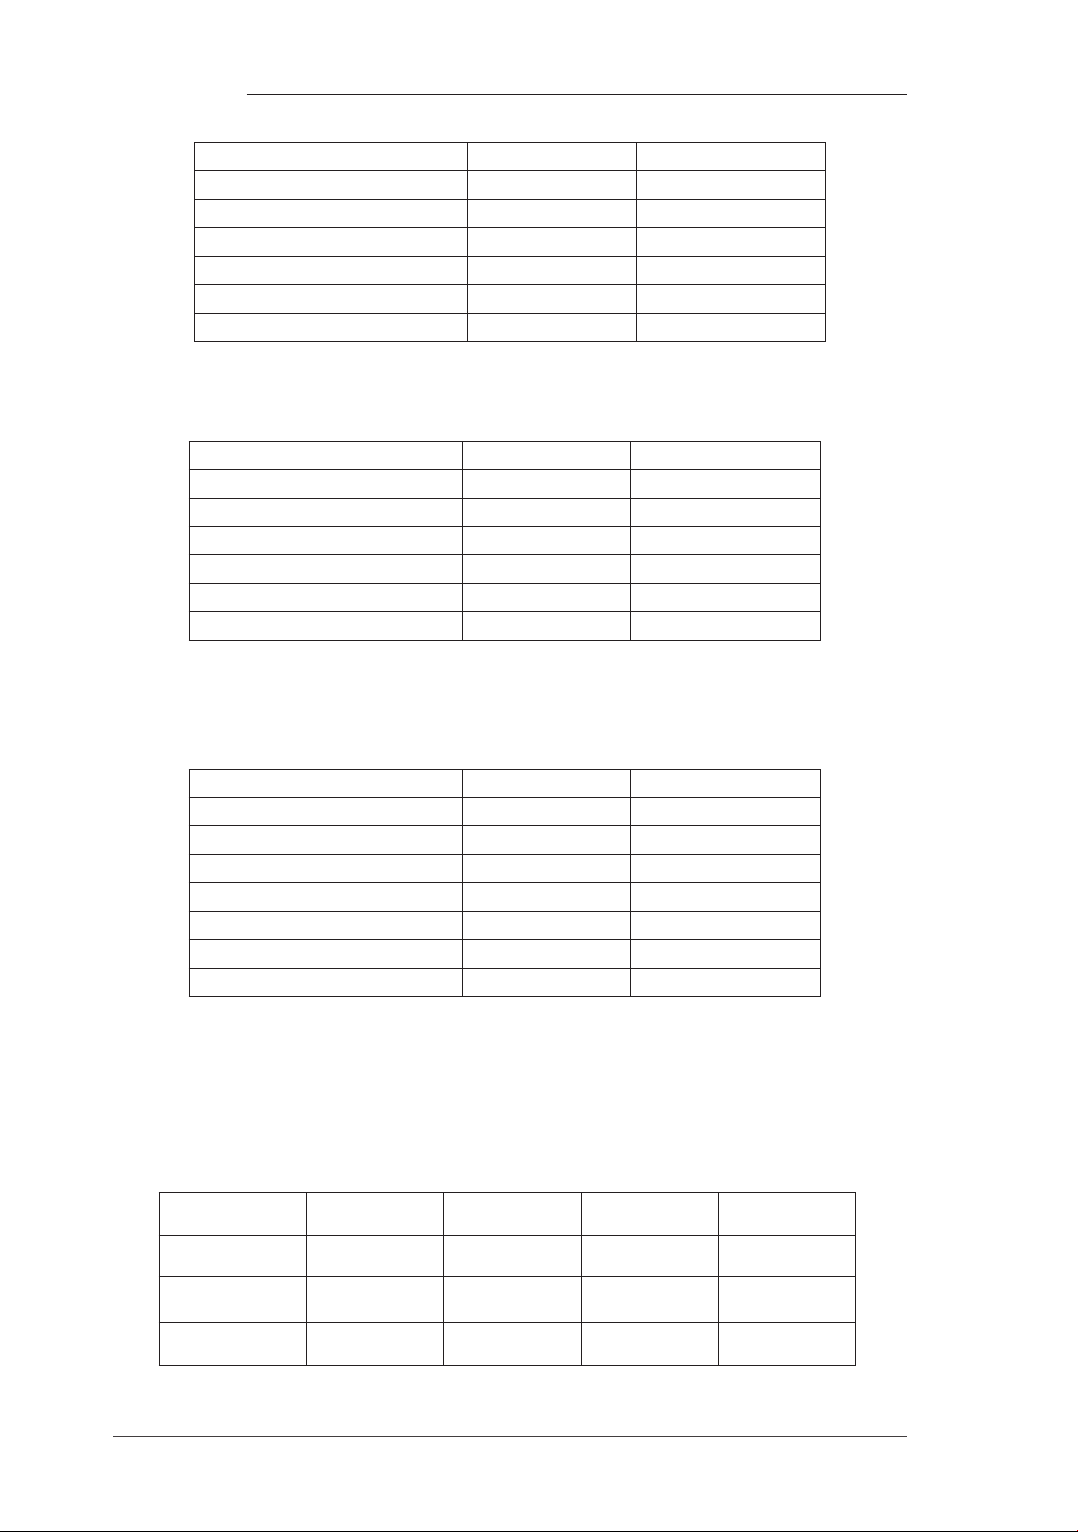
Table 3.6. Average Sleep Duration of Study Participants (n=425)
Sleep Duration Number Percentage (%)
≤ 6 hours 93 21.9
> 6 to < 8 hours 254 59.8
≥ 8 hours 78 18.3
Highlights: The majority of participants slept between 6 and 8 hours per day (59.8%), while
18.3% slept 8 hours or more daily.
Usage Status Number Percentage (%)
Time spent using device > 1 hour 371
≤ 1 hour 13
Do not use 41
Distance to the eye < 25 cm 167
> 25 cm 217
Table 3.7. Average Sleep Duration of Study Participants (n=425)
Highlights: The highest proportion of participants used their phones or computers for over 1
hour per day (87.3%). Only 9.6% of participants did not use a phone or computer.
Occupation Number Percentage (%)
Farming 179 42.1
Worker 84 19.8
Business 60 14.1
Civil servant/Employee 31 7.3
Other 71 16.7
Educational Level Number Percentage (%)
Primary school 12 2.8
Secondary school (middle) 106 24.9
High school 192 45.2
Vocational/College 57 13.5
University/Postgraduate 58 13.6
Occupation Number Percentage (%)
Farming 172 40.5
Worker 45 10.6
Business 105 24.7
Civil servant/Employee 42 9.9
Other 61 14.3
80 Hoa Binh University Journal of Science and Technology - No 14 - 12.2024
MEDICINE
Table 3.8. TV Viewing and Gaming Habits of Study Participants (n=425)
Highlights: The proportion of participants watching TV for more than 1 hour per day was
53.4%, while 26.1% did not watch TV.
Highlights: The majority of participants (78.4%) had a designated study area at home. Of those,
87.4% used white light in their study lamps, while 12.6% used yellow light. Additionally, 16.7%
studied in areas with insufficient lighting.
Highlights: 15.1% of participants reported inadequate lighting at their classroom seating. The
proportion of participants experiencing frequent glare from the board was 14.8%, while 47.8%
experienced occasional glare. Additionally, 25.6% of participants reported no regular changes in
their seating arrangement.
Table 3.11. Distribution of Myopia by Gender in Study Participants (n=425)
TV Viewing and Gaming Status Number Percentage (%)
Time spent watching TV > 1 hour 227
≤ 1 hour 87
Do not use 111
Time spent playing games > 1 hour 103
≤ 1 hour 160
Do not play 162
Table 3.9. Study Participants’ Study Area Conditions at Home (n=425)
Home Study Area Conditions Number Percentage (%)
Has a designated study area No 92
Yes 333
Lighting conditions at study area Poor 71
Adequate 354
Type of study light color White light 291
Yellow light 42
Table 3.10. Classroom Seating Conditions of Study Participants (n=425)
Classroom Seating Conditions Number Percentage (%)
Lighting conditions at seating Poor 64
Adequate 361
Glare from the board Often 63
Occasionally 203
None 159
Regular seat changes No 109
Yes 316
3.2. Current Status of Myopia in Study Participants
Gender Myopia (n) Myopia (%) No Myopia (n) No Myopia (%)
Male 54 34.4 103 65.6
Female 143 53.4 125 46.6
Total 197 46.4 228 53.6
Highlights: The prevalence of myopia was higher among females (53.4%) compared to
males (34.4%).