intTypePromotion=1
zunia.vn Tuyển sinh 2024 dành cho Gen-Z zunia.vn zunia.vn
ADSENSE

Smart grid islanding, fault detection and classification with distributed generation based on wavelet alienation current signals approach

Chia sẻ: Nguyễn Thảo | Ngày: | Loại File: PDF | Số trang:14

10
lượt xem
2
download
 
  Download Vui lòng tải xuống để xem tài liệu đầy đủ

The Distributed generation (DG) is gaining significant attention due to increase in the demand for electricity. Distributed generations are mostly used with the association of power distribution systems to energize local loads and network.

Chủ đề:
Lưu

Nội dung Text: Smart grid islanding, fault detection and classification with distributed generation based on wavelet alienation current signals approach

  1. International Journal of Mechanical Engineering and Technology (IJMET) Volume 10, Issue 03, March 2019, pp. 1792–1805, Article ID: IJMET_10_03_181 Available online at http://www.iaeme.com/ijmet/issues.asp?JType=IJMET&VType=10&IType=3 ISSN Print: 0976-6340 and ISSN Online: 0976-6359 © IAEME Publication Scopus Indexed SMART GRID ISLANDING, FAULT DETECTION AND CLASSIFICATION WITH DISTRIBUTED GENERATION BASED ON WAVELET ALIENATION CURRENT SIGNALS APPROACH Kamala Devi Kolavennu Department of Electrical and Electronics Engineering Bapatla Engineering College, Bapatla, Andhra Pradesh, India Abdul Gafoor Shaik Department of Electrical Engineering IIT- Jodhpur, Rajasthan, India ABSTRACT The Distributed generation (DG) is gaining significant attention due to increase in the demand for electricity. Distributed generations are mostly used with the association of power distribution systems to energize local loads and network. Islanding is technically an undesirable condition that demands necessary steps to reduce negative effects in maintaining stability of the system. In the present work, alienation technique has been applied to detect and differentiate islanding, faults and sudden load change and faults have been classified. A radial system with four Distributed Generations (DFIG wind generator) connected to the source through common coupling point (PCC) has been used for comprehensive study of this technique. Current signals were decomposed with Daubechies (db1) wavelet in order to get approximate coefficients at each bus. Coefficients of Alienation are computed by using the wavelet based approximations over a length of half cycle moving window . The alienation coefficients were used to compute Islanding index and fault index. The same indices were compared with threshold to differentiate Islanding, faults and sudden load change. The proposed algorithm has been tested for various incidence angles for both islanding condition and faults. This technique is established to be robust in detecting islanding condition, faults and impact of sudden load change. Key words: Distributed generation, Alienation coefficients, Distribution network, load change, Islanding index, Wavelet transform Cite this Article: Kamala Devi Kolavennu and Abdul Gafoor Shaik, Smart Grid Islanding, Fault Detection and Classification with Distributed Generation Based on Wavelet Alienation Current Signals Approach, International Journal of Mechanical Engineering and Technology 10(3), 2019, pp. 1792–1805. http://www.iaeme.com/IJMET/issues.asp?JType=IJMET&VType=10&IType=3 http://www.iaeme.com/IJMET/index.asp 1792 editor@iaeme.com
  2. Kamala Devi Kolavennu and Abdul Gafoor Shaik 1. INTRODUCTION Penetration of the distributed generation in power distribution networks increases rapidly in the present days. Distributed generation (DG) is also known as non-centralized power generation or dispersed generation which refers to the production of Electricity near the consumption place. The resources used in distributed generation are renewable energy sources and cogeneration i.e., production of heat and electricity simultaneously. DGs are having some advantageous characteristics like free location in the network area, relatively small generated power, increased reliability of the Grid, reduced transmission and distribution line losses, better voltage support and power quality improvement[1]. The standby generation, peak shaving, utility grid enhancement, load management are various applications of the distributed generation. However many technical issues and difficulties arise in the association of DG units with the Grid. Islanding condition is one of the most undesirable conditions intentionally or accidentally takes place in DGs. According to IEEE STD 1547-2003, in islanding condition, there is accidental or intentional disconnection of the grid from distribution network system and the distributed generation continuously feed the network and local loads[2]. Due to this Islanding condition, various operational problems arise related to power quality, safety hazard, voltage and frequency instability and damage to system equipment [3, 4]. The unsynchronized reclosing of the grid to distribution system may trigger damage to the power electronic conditioning equipment of the distributed generation. The standard of IEEE 929-2000 specifies particularly the disconnection of distributed generation once it is islanded [5] and this issue is addressed by IEEE STD 1547- 2003 [6].Islanding detection techniques are broadly classified into remote (central) and local techniques. A detailed review on islanding has been given by Khamis, Aziah [7]. Remote methods are associated with islanding detection methods on the utility side where as local methods are associated with detection of islanding on DG side. Remote methods are used to detect unintentional islanding by monitoring voltage and frequency parameters [8]. Remote or central methods are independent of number of inverters, generator type, and system size and penetration level. Local techniques for islanding detection are based on the measurement of the system parameters on DG side such as voltage, frequency, current and harmonic distortion [9]. Comparative analysis of anti islanding technique depends on application and cost and ability of occurrence of islanding on feeder has been presented by P. Deshbhratar, R. Somalwar and S. G. Kadwane [10]. Local Islanding detection techniques are further classified into passive and active technique methods, and hybrid technique methods [11, 12]. Anti-islanding technique method has been introduced by J. Yim, C.P.Diduch, L. Chang on the basis of proportional power spectral density as a formalised measure [13]. A new approach to islanding detection by extracting the negative sequence component of the current and voltage has been presented by S. R Samantha Ray and Trupti Mayee Pujhari[14]. K. Narayana presented a scheme on a priority based load shedding to detect islanding in case of multiple DG units [15].Ahmad G. AbdElkadar reported a new islanding technique for DFIG wind turbine by using artificial neural network [16]. R. K. Ray, N. Kishore [17] proposed a wavelet and S-transform based scheme by considering a negative sequence component of the voltage signal extracted at point of common coupling.J. A. Laghari [18] developed an islanding detection technique by using average rate of change of reactive power and load shift strategy. The effectiveness of different fault detection methods were studied by S. S. Gururajapathy H. Mokhilis like fuzzy logic, artificial intelligence, , Genetic algorithm etc, [19]. Transmission line protection scheme based on Wavelets are proposed by Abdul Gafoor and Ramanarao [20]. Rathore and Shaik has proposed the protection schemes for transmission line from faults with the use of wavelet based alienation technique [21, 22].A protection scheme has been introduced by Masoud and Mahfouz for transmission lines based on alienation coefficients [23]. http://www.iaeme.com/IJMET/index.asp 1793 editor@iaeme.com
  3. Smart Grid Islanding, Fault Detection and Classification with Distributed Generation Based on Wavelet Alienation Current Signals Approach In deed there is a need to investigate a protective scheme which requires fast detection with less computational complex. In this present work the proposed algorithm can detect islanding and faults within quarter cycle. 2. THE ALIENATION ALGORITHM BASED ON WAVELETS 2.1. The Wavelet Transform There is effective use of Wavelet transform to analyse transients of current and voltage signals in frequency as well as time-band. To decompose the signal in high and low frequency bands a set of basic functions called Wavelets, are used, which are acquired from a mother wavelet by dilation and translation. Therefore, the incidence of each frequency and amplitude can be found precisely. The Wavelet Transform is explained as a series of a function {h (n)} (high pass filter) and {g (n)} (low pass filter). The scaling and wavelet functions can be described in equations as follows. ∅(𝑡) = √2 ∑ ℎ(𝑛)𝜑(2𝑡 − 𝑛)(1) Ψ(𝑡) = √2 ∑ 𝑔(𝑛)𝜓(2𝑡 − 𝑛) (2) n Where, g (n) = (-1) h (1-n) The factor √2 maintains the norm of the function for the time compression factor 2. The time compression factor is generally correlates to the scale. The selection of mother wavelet is based on the type of application. This paper used Daubachies wavelet which is suited for this application to get best results. 2.2. Alienation Coefficients In the suggested algorithm the current signals have been sampled over a half cycle. Approximation coefficients are acquired by applying wavelets to these current signals The alienation coefficient based on approximation decomposition (Coefficients) is calculated as: 𝐴𝐴 = 1 − 𝑝𝑎2 (3) Where, pa is the coefficient of correlation calculated based on approximations. The correlation coefficient based on approximation coefficient is calculated as 𝑁𝑠 (∑ 𝑟𝑎 𝑠𝑎 )−(∑ 𝑟𝑎 ∑ 𝑠𝑎 ) 𝑝𝑎 = (4) √[𝑁𝑠 ∑ 𝑟𝑎2 −(∑ 𝑟𝑎 )2 ][𝑁𝑠 ∑ 𝑠𝑎 2 −(∑ 𝑠𝑎 )2 Where, Ns is the number of samples per half cycle, absolute value of samples at t0 is denoted by ra .Absolute value of samples consider in previous moving window of half cycle is denoted by sa. The variance between two signals is defined as the alienation coefficient. Its value is between 0 and 1. 2.3. Weighted alienation coefficients It is needed to apply the concept of weighted alienation coefficients to detect the transients of faults at PCC when faults are computed at DGs and for load changes. Simple arithmetic gives equal importance to all values in a series. In some cases, all the values in a series do not give same weight age. In such cases weighted average is more suitable for calculations. The concept of average of weighted Alienation coefficients is as follows. It is used to increase the relative importance of any quantity (of our interest) with respect to other quantities. For which each value is multiplied by a weight according to its importance. The weighted average for any input x can be computed by using the following equation (5) and procedure. http://www.iaeme.com/IJMET/index.asp 1794 editor@iaeme.com
  4. Kamala Devi Kolavennu and Abdul Gafoor Shaik x  avg i 1 WiXi i 5 (5) i= Total number of inputs. Xi is alienation coefficient at each bus of four DGs and PCC where, i = 1, 2,3,4,5. Get Max (x1, x2, x3, x4, x5) = n. Divide each alienation value of DGs and PCC by n to get weights. The weights will be xi/n=wi where i=1 to 5. Multiply every alienation coefficient of four DGs and PCC with their respective weights (wi).Then get average of these values for all three phases. 
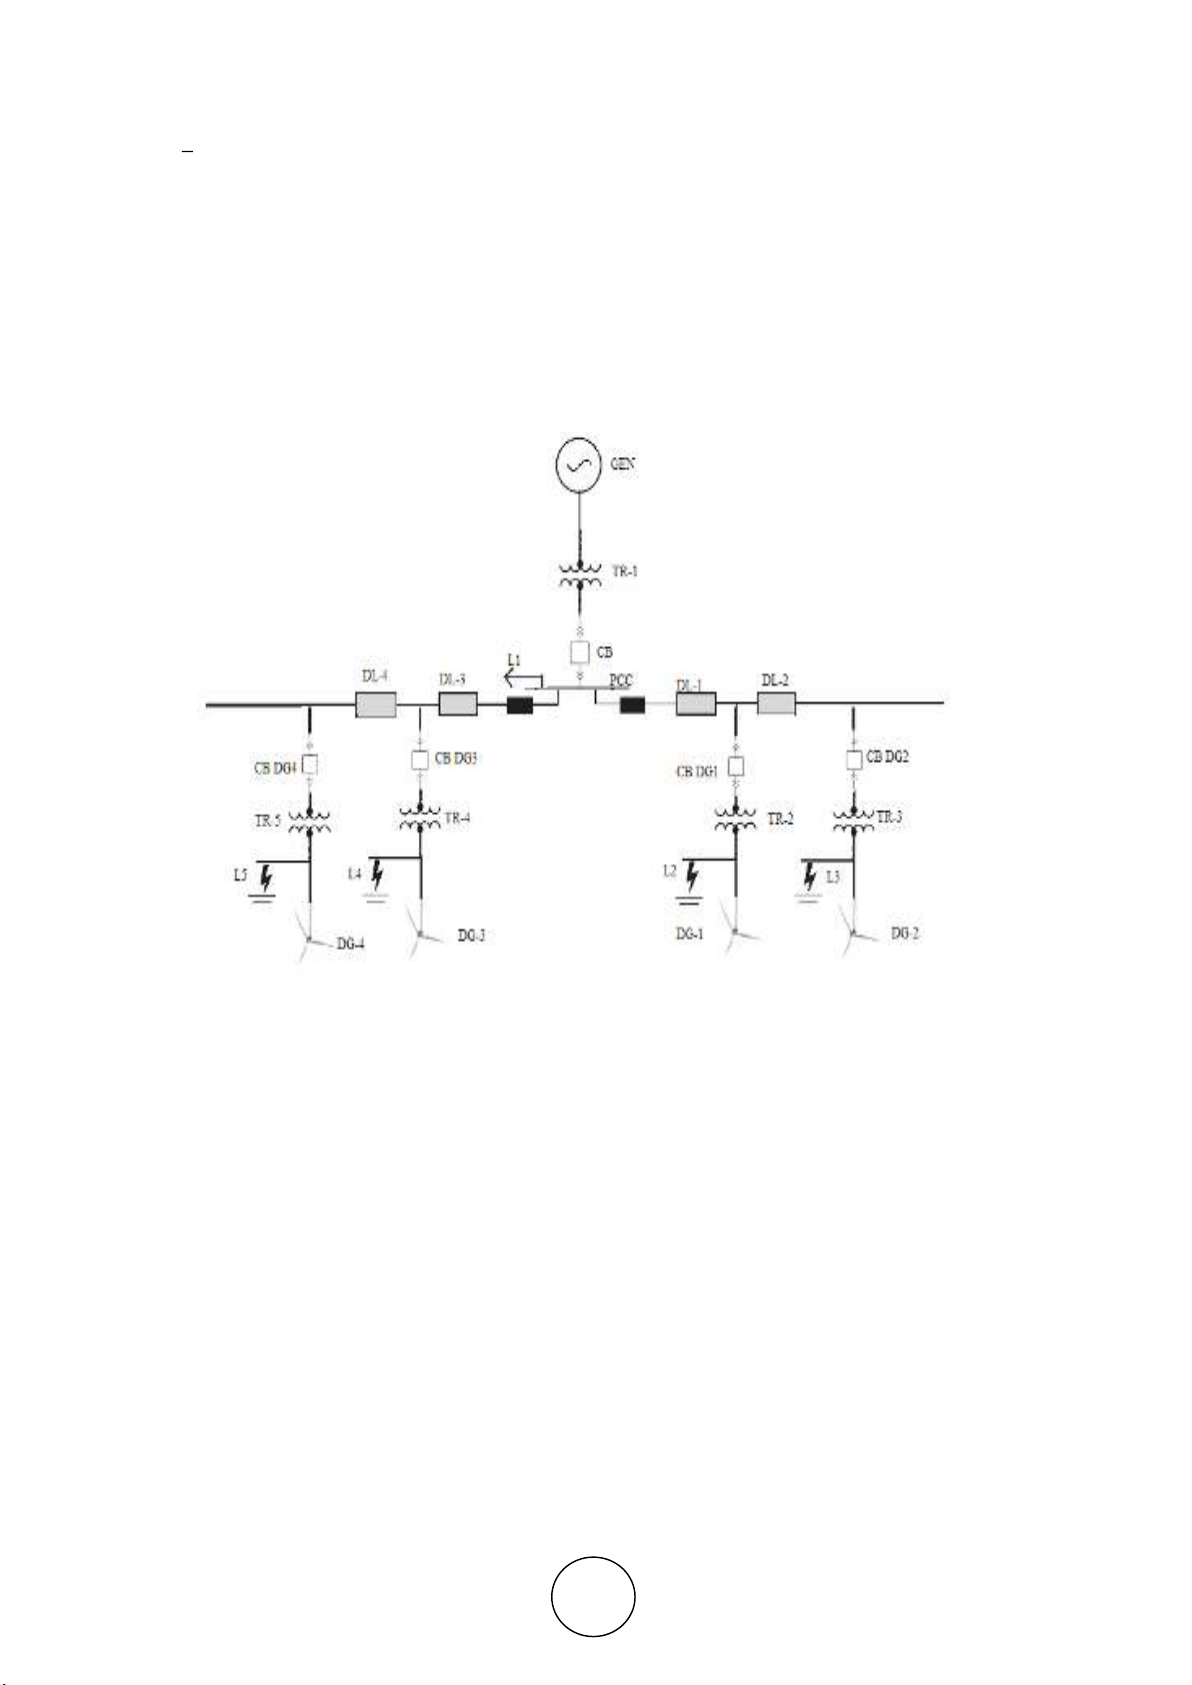
Figure 1. Line diagram of the system The single line diagram of proposed system is shown in Fig. 1. The base power is about 10 MVA. This system contain radial distribution system with 4 wind farms (DG units), which connected through Point of Common Coupling (PCC) to the main supply system and it operates at a power frequency of about 50 Hz. These DG units are connected at about a distance of 30 km with the distribution lines of pi-sections. The data of the DGs, generator, distribution lines and loads and transformers are considered from Ref. [17]. The three phase currents at a point of common coupling of distribution line and DGs are sampled at 6400 Hz. These samples are acquired over a moving window of half cycle length. These current samples have been decomposed with a db1 wavelet to get approximation coefficients of third level (A3). CA, the Alienation coefficient is evaluated by comparing the approximate coefficients of the current window, with those of the previous window of same polarity. These two consecutive windows, under normal conditions, have similar set of approximations, hence the Aa remains zero. But in the case of islanding, fault or any other abnormal condition, the approximate coefficient of the current window should differ from those http://www.iaeme.com/IJMET/index.asp 1795 editor@iaeme.com
  5. Smart Grid Islanding, Fault Detection and Classification with Distributed Generation Based on Wavelet Alienation Current Signals Approach of previous window of same polarity. Hence, the alienation coefficient would increase from zero to a certain value indicating disturbances. 3. PROPOSED ALGORITHM Table 1 Parameters adopted in the present work S.NO COMPONENT SPECIFICATION Rated short circuit MVA=1000 1. Generator Rated KV=120,Vbase=120kv,f=50Hz Six Doubly fed induction generators Distributed generations(DGs) (9MW) of each wind turbine of rating1.5MW 2. (DG-1 to DG-4) are joined to a 25kv grid through a length of 30km, 25 kv feeder. PI-Section,30km each, rated MVA= 20, Rated KV=25kv,Vbase=25kv, R0= 0.11530Ω/km,R1=0.4130Ω/km,L0= 3. Distribution lines 1 to 4 1.05e-3H/km, L1=3.32e-3H/km, C0=11.33e-009F/km,X1=5.01e-009 F/km. Rated MVA=25,Vbase=25kv,Rated 4. Transformer T1 KV=120/25, X1=0.10p.u, R1=0.003750 p.u,Rm=500.00p.u, Xm=500.00 p.u. Rated MVA=10.00,rated kv=575v/25kv, TransformerT2 to 5. Vbase=25KV, X1=0.10, R1=0.003750 Transformer T5. p.u, Rm=500.00 p.u, Xm=500.00 p.u,f=50hz 6. Load L-1 15MW,5MVAR. 7. Load L-2 to Load L-5 8.0MW,3MVAR. http://www.iaeme.com/IJMET/index.asp 1796 editor@iaeme.com
  6. Kamala Devi Kolavennu and Abdul Gafoor Shaik Figure 2. Flow chart of the proposed algorithm http://www.iaeme.com/IJMET/index.asp 1797 editor@iaeme.com
  7. Smart Grid Islanding, Fault Detection and Classification with Distributed Generation Based on Wavelet Alienation Current Signals Approach 4. RESULTS AND DISCUSSION 4.1. Comparison of islanding and load change 4.1.1. Detection of islanding As per Fig.1 the single line diagram is modelled in Matlab / Simulink environment. The flow chart of the present work is shown in Fig 2. The 6400 Hz sampling frequency is considered with 128 samples per cycle. The simulation has been carried out for 25 cycles and run for 0.5 sec (25 cycles) and fault islanding and load change were simulated after 20 cycles (at 0.4sec). The detection of islanding is illustrated in Fig.3 at various DGs by opening circuit breaker at 0.4sec at PCC. In islanding, fault and load changing the islanding index and fault indexes are compared with the threshold value. The threshold value is set as 0.01 in case of islanding and load change. Further, a threshold value of 0.4 at DGs and 0.15 at PCC were suitably considered for detection and classification of faults. It has been observed that the islanding index of islanding at every DG is greater than that of threshold and islanding index of load change at every DG is found to be lesser than the threshold. The fault index was observed as higher than the threshold for the fault and lower than the threshold for islanding. Fig.3(a), (b), (c), (d) illustrate variation of islanding index above the threshold which indicate islanding condition at DG-1, DG-2, DG-3, DG-4 for current signals which satisfies proposed algorithm. Figure 3.Variation of islanding indexes with time at a) DG-1 located at 30km from PCC, b) DG-2 located at 60km from PCC, c) DG-3 located at 30km from PCC and d) DG-4 located at 60km from PCC. 4.1.2. The Variation of islanding incidence angle The proposed algorithm has been tested at regular intervals of 300 by applying Islanding. Variation of islanding indexes of three phases with incidence angle has been illustrated in Fig. 4. It is evident from graph that the islanding index is always greater than the threshold one for various incidence angles at PCC which shows islanding condition. http://www.iaeme.com/IJMET/index.asp 1798 editor@iaeme.com
  8. Kamala Devi Kolavennu and Abdul Gafoor Shaik Table 2 Islanding Incidence Angle Incidence Angle PHASE A PHASE B PHASE C I-TH 0° 0.03466 0.0144 0.0222 0.01 30° 0.033375 0.0255 0.0319 0.01 60° 0.013 0.0189 0.0369 0.01 90° 0.038 0.0255 0.04215 0.01 120° 0.0155 0.023 0.01442 0.01 150° 0.0331 0.0222 0.039 0.01 180° 0.0331 0.01422 0.02312 0.01 A B C I-TH Weighted alienation coefficients 0.05 0.04 0.03 0.02 0.01 0 0° 30° 60° 90° 120° 150° 180° Incidence angle Figure 4.Variation of islanding index for different incidence angle at four DGs. 4.1.3. The Load changing The effect of sudden load change at DG-1 on distribution network is observed. The effect of load change is shown in Fig.5 in a distribution line at DG-1 at 0.4sec through a circuit breaker. System at different levels of load increment on 3MVAR and 0.8 power factor base has been added to the existing system load at similar time of 0.4 sec. Fig5 (a),5(b),5(c),5(d),5(e) show the load change of 5% , 10%,20%, 25% and 30% and it is observed that the magnitude of disturbance during load change is found to be less than that of threshold. 4.2. Comparison of Islanding and faults 4.2.1. Detection of islanding Fig.6 demonstrates the detection of islanding at various DGs with threshold value 0.15 by opening circuit breaker at 0.4sec at PCC. In order to compare islanding and fault , the fault index value is set as 0.15. The transients of islanding occurred in between 0.01 and 0.15. Islanding index and fault indexes are compared with the threshold value. It has been observed that the fault index of islanding at every DG is lower than the threshold and fault index of faults were observed as greater than the threshold value. Fig.6(a), (b), (c), (d),(e),(f) illustrate variation of islanding index below the threshold which indicate islanding condition at DG-1, DG-2, DG- 3, DG-4. http://www.iaeme.com/IJMET/index.asp 1799 editor@iaeme.com
  9. Smart Grid Islanding, Fault Detection and Classification with Distributed Generation Based on Wavelet Alienation Current Signals Approach Figure 5. The effect of load changing in a distribution line at DG-1: (a). 5% load changing at DG-1, (b). 10% load changing at DG-1, (c). 20% load changing at DG-1, (d). 25% load changing at DG-1, (e). 30% load changing at DG-1 Figure 6.Variation of islanding indexes with time at a) DG-1 located at 30km from PCC, b) DG-2 located at 60km from PCC, c) DG-3 located at 30km from PCC and d) DG-4 located at 60km from http://www.iaeme.com/IJMET/index.asp 1800 editor@iaeme.com
  10. Kamala Devi Kolavennu and Abdul Gafoor Shaik PCC, e) Variation of Islanding index with time at DG-3 located at 35km from PCC and f) Variation of Islanding index with time at DG-2 located at 50km from PCC. 4.2.2. Variation of islanding incidence angle Islanding condition has been tested at regular interval of 300. The variation of islanding indexes of three phases with incidence angle has been illustrated in Fig.7. It is evident from the graph that the islanding index is always lower than the threshold one for various incidence angles which shows the islanding condition Figure 7. Variation of islanding indexes with islanding incidence angles at DG-1, b) DG-2, c) DG-3 and d)DG4 4.2.3. Detection and classification of faults Figure 8 (a) AG fault at DG1 and (b) AG fault at PCC http://www.iaeme.com/IJMET/index.asp 1801 editor@iaeme.com
  11. Smart Grid Islanding, Fault Detection and Classification with Distributed Generation Based on Wavelet Alienation Current Signals Approach Figure 9 (a) ABG fault at DG2 and (b) ABG fault at PCC Figure 10 (a) AB fault at DG3 and (b) AB fault at PCC Figure 11 (a) ABG fault at DG4 and (b) ABG fault at PCC Simulation of faults has been done after 20-cycles for obtaining post fault transients for 5- cycles. The performance of the proposed algorithm for different faults at a distance of 30 km from PCC and DGs from each other at various DGs and PCC is demonstrated in Fig.8 to Fig.11. Fig.8 shows variation of fault indexes of three phase currents with time at DG1 and PCC. Transients due to faults at PCC occurred in between0.15 to 0.4 and at DGs transients obtained above 0.4. Hence .Threshold value for identification of faults and their classification ihas been set at 0.15 at PCC and 0.4 at four DGs. It has been observed from Fig. 8 (a) and (b) that the fault index of phase A is greater than that of the threshold and for those of phase B and phase C are lower than the threshold (F-TH). Thus the suggested scheme is identified and classified as single line to ground fault (AG) at DG-1 and PCC. It has been illustrated from Fig. 9 (a) and (b) that the fault index of phase A and phase B are above the threshold and that of phase C is found to be below the threshold. Thus this fault is identified and classified as ABG fault at DG- 2 and its respective PCC. Fig.10(a) and (b) illustrate that the fault index of both phase A and phase B are above threshold and phase C is below the threshold. Thus fault is recognized as AB fault at DG-3 and its PCC. Fig.11(a) and (b) show that the fault index of all the three phases are above threshold which is acknowledged as three phase fault. From the graphs it is observed that the healthy phase never cross the threshold value and faulty phase crosses the threshold value. Once fault index of any phase is greater than the threshold value, it is considered as faulty phase even though the fault index is lower than the threshold for a moment after detecting the fault. In the present work, fault was detected within quarter cycle at every DG and PCC. http://www.iaeme.com/IJMET/index.asp 1802 editor@iaeme.com
  12. Kamala Devi Kolavennu and Abdul Gafoor Shaik 4.2.4. Variation of the fault incidence angles To test the suggested algorithm at equal intervals of 300 faults have been simulated. The difference of fault indexes of the three phases with the angle of fault incidence has been illustrated in Fig 12. It is apparent from Fig 12(a) that the fault index of the faulty phases A and B are greater than that of threshold for various angles of fault incidence for AB fault at DG- 1. It is illustrated from the Fig12 (b) to Fig 12(e) that the fault index of the faulty phase is higher than that of threshold value and fault index of healthy phase is lower than the threshold value for different fault incidence angles for AG fault atDG-2,ACG fault at DG-3, ABG fault at DG- 4 and ABCG fault at PCC. Figure 12.Variation of fault index with fault incidence angle: (a) AB fault at DG-1, (b)AG fault at DG-2, (c)ACG fault at DG-3, (d) ABG fault at DG-4, (e) ABCG fault at PCC. Table 3. Fault detection time at different DGs for various faults PHASE A PHASE B PHASE C DETECTI DETECTI TYPE OF IS FAULT IS DETECCTI IS ON ON FAULT PRESE FAULTPR ON FAULTP TIME(SE TIME(SE NT ESENT TIME(SEC) RESENT C) C) AG atDG-1 YES 0.0025 NO N.A NO N.A ABG at DG-2 YES 0.00125 YES 0.00125 NO N.A AB at DG-3 YES 0.00375 YES 0.00125 NO N.A ABCG at DG-4 YES 0.0025 YES 0.0025 YES 0.0025 The above table-3 and table-4 illustrate that the time required detecting fault from incidence in seconds at DGs and PCC. From table-1 and table-2, it is clear that the fault is detected in 0.0025 sec from the incidence at both DG-1 and PCC in case of AG fault. It is evident that the fault is detected within the quarter cycle in all types of faults at both DGs and corresponding PCC. http://www.iaeme.com/IJMET/index.asp 1803 editor@iaeme.com
  13. Smart Grid Islanding, Fault Detection and Classification with Distributed Generation Based on Wavelet Alienation Current Signals Approach Table 4. Fault detection time at PCC during the faults at various DGs PHASE A PHASE B PHASE C DETECTI DETECTI TYPE OF IS FAULT IS DETECTIO IS FAULT ON ON FAULT PRESEN FAULTPR N PRESEN TIME(SE TIME(SE T ESENT TIME(SEC) T C) C) AG at DG-1 YES 0.0025 NO N.A NO N.A ABG at DG-2 YES 0.0025 YES 0.00125 NO N.A AB at DG-3 YES 0.005 YES 0.00125 NO N.A ABCG atDG- YES 0.00375 YES 0.0025 YES 0.005 4 5. CONCLUSION The suggested algorithm investigates the successful implementation of the wavelet transform based alienation coefficient approach for effective detection of faults, islanding, and load changing and further their comparison in the distribution system with the penetration of DGs. Alienation coefficients over a quarter cycle clearly detect and localize the event. It has been found that the islanding is greater than threshold value and load changing in a distribution line is very less than the threshold. Faults are found to be greater than threshold value and islanding condition is observed to be lower than the threshold value. Therefore, the proposed method is successful, fast and reliable for the detection of faults, islanding, and load change. REFERENCES [1] Dulău, Lucian Ioan, MihailAbrudean, and DorinBică "Effects of distributed generation on electric power systems" Procedia Technology 12 (2014): 681-686. [2] Kroposki, Benjamin, Thomas Basso, and Richard DeBlasio "Microgrid standards and technologies’’ In Power and Energy Society General Meeting-Conversion and Delivery of Electrical Energy in the 21st Century, 2008 IEEE, pp.1-4. IEEE, 2008. [3] Conti, Stefania "Analysis of distribution network protection issues in presence of dispersed generation" Electric Power Systems Research 79, no. 1 (2009): 49-56. [4] Ropp, Michael E., MiroslavBegovic, AjeetRohatgi, Gregory A. Kern, R. H. Bonn, and S. Gonzalez "Determining the relative effectiveness of islanding detection methods using phase criteria and nondetection zones" IEEE transactions on energy conversion 15,(2000): 290-29. [5] Recommended “Practice for Utility Interconnected Photovoltaic (PV) Systems”, IEEE Standard 929-2000, 2000. [6] IEEE “Standard for Interconnecting Distributed Resources into Electric Power Systems”, IEEE Standard 1547TM, June 2003. [7] Khamis, Aziah, HussainShareef, ErdalBizkevelci, and Tamer Khatib "A review of islanding detection techniques for renewable distributed generation systems" Renewable and sustainable energy reviews 28 (2013): 483-493. [8] Mahat, Pukar, Zhe Chen, and BirgitteBak-Jensen. "A hybrid islanding detection technique using average rate of voltage change and real power shift." IEEE Transactions on Power delivery 24, no. 2 (2009): 764-771 [9] Trujillo, César, David Velasco, Emilio Figures, and Gabriel Garcerá. "Local and remote techniques for islanding detection in distributed generators" In Distributed Generation. InTech, 2010. [10] P. Deshbhratar, R. Somalwar and S. G. Kadwane, "Comparative analysis of islanding detection methods for multiple DG based system," 2016 International Conference on http://www.iaeme.com/IJMET/index.asp 1804 editor@iaeme.com
  14. Kamala Devi Kolavennu and Abdul Gafoor Shaik Electrical, Electronics, and Optimization Techniques (ICEEOT), Chennai,2016,pp.1525- 1530. [11] Funabashi, Toshihisa, KaoruyKoyanagi, and R. Yokoyama. "A review of islanding detection methods for distributed resources." In Power Tech Conference Proceedings, 2003 IEEE Bologna, vol. 2, pp. 6-pp. IEEE, 2003. [12] Mahat, Pukar, Zhe Chen, and BirgitteBak-Jensen. "Review of islanding detection methods for distributed generation." In Electric Utility Deregulation and Restructuring and Power Technologies, 2008. DRPT 2008. Third International Conference on, pp. 2743-2748. IEEE, 2008. [13] J. Yin, L. Chang, and C. Diduch. “Recent development in islanding detection for distributed power generation,” Large engineering Systems Conference on Power Engineering” (LESCOPE), pp. 124-128, 28-30 July2004. [14] S.R.Samantaray, TruptiMayeePujhari, B.D.Subudhi. "A new approach to Islanding detection in Distributed Generations",2009 Third International Conference on Power Systems, Kharagpur,27-29, 978-1-4244-4331. [15] Narayanan, K., Shahbaz A. Siddiqui, and ManojFozdar. "An Improved Islanding Detection Technique and priority based load shedding for distribution system with multiple DGs." In Power Systems Conference (NPSC), 2016 National, pp. 1-6. IEEE, 2016. [16] Abd-Elkader, Ahmad G., Dalia F. Allam, and ElsayedTageldin. "Islanding detection method for DFIG wind turbines using artificial neural networks" International Journal of Electrical Power & Energy Systems 62 (2014): 335-343. [17] Ray, Prakash K., NandKishor, and Soumya R. Mohanty. "Islanding and Power Quality Disturbance Detection in Grid-Connected Hybrid Power System Using Wavelet and $ S $- Transform." IEEE Transactions on Smart Grid 3, no. 3 (2012): 1082-1094. [18] Laghari, J. A., H. Mokhlis, M. Karimi, A. H. A. Bakar, and Hasmaini Mohamad. "An islanding detection strategy for distribution network connected with hybrid DG resources." Renewable and Sustainable Energy Reviews 45 (2015): 662-676. [19] Gururajapathy, S. S., H. Mokhlis, and H. A. Illias. "Fault location and detection techniques in power distribution systems with distributed generation: A review." Renewable and Sustainable Energy Reviews 74 (2017): 949-958. [20] Abdul GafoorShaik, P.V. RamanaRao, Wavelet based fault detection, classification and locationin transmission lines, Proc. 2006 IEEE Power and Energy Conference (2018) 114– 118. [21] BhuvneshRathore, Abdul GafoorShaik, Fault detection and classification on transmission line using wavelet based alienation algorithm, Smart Grid Technologies-Asia (ISGT ASIA), 2015 IEEE Innovative, IEEE (2015) 1–6. [22] Bhuvnesh Rathore, Abdul Gafoor Shaik, Wavelet-alienation based transmission line protection scheme, IET Gener. Transm. Distrib. 11 (4) (2017)995–1003. [23] Masoud, M. E., and M. M. A. Mahfouz. "Protection scheme for transmission lines based on alienation coefficients for current signals." IET generation, transmission & distribution 4, no. 11 (2010): 1236-1244. http://www.iaeme.com/IJMET/index.asp 1805 editor@iaeme.com
ADSENSE

CÓ THỂ BẠN MUỐN DOWNLOAD


Đồng bộ tài khoản
2=>2