Journal of Water Resources & Environmental Engineering - No. 87 (12/2023)
31
Tensile –shear response correlation
of ultra-high-performance fiber-reinforced concrete at high strain rates
Tri Thuong Ngo
1*
,
Cong Bang Phan
2
Abstract: The superior mechanical characteristics of ultra-high-performance fiber-
reinforced concrete
(UHPFRC) hold great potential for application in structures subjected to extreme loads, such as impacts
or blasts. However, the practical application of this material in engineering is limited due to a lack of
information about its mechanical properties, especially at high strain rates. In this study, the shear
behavior of UHPFRC was investigated using a nov
el shear test setup installed in the universal testing
machine (UTM) for static tests and the improved-strain energy frame impact machine (I-
SEFIM) for
high strain rate tests, respectively. Additionally, effect of fiber volume contents and the correlation
between shear and tensile behavior were also clarified. The experimental results indicated a significant
increase in the shear strength of UHPFRC as the fiber volume content and applied strain rates increased,
even though the shear strain rate sensitivity
was not as high as the tensile strain rate sensitivity. The
shear-
tensile ratios were approximately 1.45, 0.67, and 0.66 at average strain rates 0.000667, 99, and
184 s
-1
, respectively.
Keywords: UHPFRCs, shear resistance, tensile resistance, high-strain rates.
1. Introduction
*
The superior strength and energy
absorption capacity of ultra-high-performance
fiber-reinforced concretes (UHPFRCs) is
expected to greatly improve the resistance of
civil infrastructure under impacts or blasts (N.
T. Tran et al., 2016), such as concrete walls
under single missile attacks. Under these
extreme loads, complex failure modes,
including compressive, tensile, and shear
failure as well as local spalling on the surface
of the structure have frequently been reported
(Micallef et al., 2014).
In recent years, the compressive, tensile, and
flexural responses of UHPFRCs at high strain
rates have been intensively investigated by a
considerable number of researchers. (Wu et al.,
2017) investigated the compressive strength of
1
Fuculty of Civil Engineering, Thuyloi University
2
Department of Transport, HCM City
*
Corresponding author; Email: trithuong@tlu.edu.vn
Received 18
th
Oct. 2023
Accepted 3
rd
Nov. 2023
Available online 31
st
Dec. 2023
UHPFRC at static and high strain rates using the
Hopkinson press bar (SHPB) testing, and they
reported that the dynamic compressive
properties increased gradually with the increase
of the strain rate. (Park et al., 2016a) and
(Millon et al., 2009) investigated the tensile
resistance of UHPFRC at different strain rates
using the different impact systems: improved-
strain energy frame impact machine (I-SEFIM)
and the split Hopkinson press bar, respectively.
They reported that the tensile resistance of
UHPFRC significantly increased with the
increase of loading rates and the enhancement
strongly depended on the fiber parameters such
as fiber volume content, fiber type, and fiber
aspect ratio. The tensile strength of UHPFRCs
at high strain rates (90 to 200 s
-1
) was reported
to be 2.9 times higher than that at the static rates
(Park et al., 2016b).
However, there has been still limited
information on the shear resistance of UHPFRC
at high strain rates, which was a dominant
failure mode of structures during the impact or
Journal of Water Resources & Environmental Engineering - No. 87 (12/2023)
32
blast load. (Millard et al., 2010) investigated
the shear resistance of UHPFRC using a drop-
hammer system and reported that there was no
significant strain rate dependence on shear
resistance in the case of drop-hammer loading.
(Ngo et al., 2019) investigated the shear
resistance of UHPFRCs at high strain rates
using a new shear test method installed in the
developed I-SEFIM. They reported that the
UHPFRC reinforced with smooth steel fiber
exhibited high rate sensitivity. However, they
have just investigated the shear resistance of
UHPFRCs reinforced with the smooth steel
fiber and up to 1.5% fiber volume fractions. In
addition, the correlation between tensile,
flexural, and shear resistance of UHPFRC has
not been considered, this is really the gap
information since the complex failure modes,
including compressive, tensile, shear failure as
well as local spalling on the surface of the
structure have frequently been reported when
infrastructure was subjected to high rate loads
(Millard et al., 2010; Thai & Kim, 2014).
This study aims to understand the shear
resistance as well as the correlation between
shear and tensile resistance of UHPFRCs at high
strain rates. The shear test method, newly
developed by (Ngo et al., 2017), was used to
investigate the shear resistance of UHPFRC at
both static and high strain rates while their
tensile resistance was investigated in a prior
study (Park et al., 2016b) .
2. Experimental program
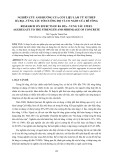
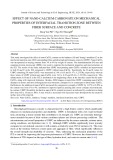
An experimental layout was designed to
investigate the shear strain-rate dependent as
well as shear-tensile correlation of UHPFRCs
reinforced with smooth steel fiber, under static
and high strain rates, as shown in Fig. 1. Three
series with 18 prism shear specimen (50 x 50 x
210 mm3) of UHPFRC reinforced with 2.0 vol.-
% smooth steel fiber was prepared and tested.
The tensile response was investigated by (Park
et al., 2016b).
2.1. Material and specimen preparation
The composition of the ultra-high-
performance concrete (UHPC) matrix was
shown in Table 1. The compositions by weight
ratio of ingredients are 0.25, 1.10, 0.30, 0.067,
and 0.2 for cement (Type I), silica fume, silica
sand, silica powder, super-plasticizer, and water,
respectively. Cement (Type I) satisfying Korea
Standard (KS) L5201 and ASTM C150, silica
fume certified by KS F2567 and ASTM C1240,
the silica sand with a median grain size of 0.15
mm, and a polycarboxylate-based
superplasticizer with 25% solid content by
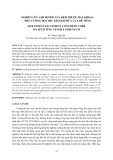
weight were used for the mixtures. The
chemical compositions, physical properties, and
images of compendious material were shown in
Table 2 and Fig. 2, respectively, while the
properties of steel fibers were listed in Table 3.
A Hobart type laboratory mixer with a
controllable rotation speed and a 20-L capacity
was used to prepare the UHPC mixture. The
ingredients were dry mixed until the mixture
showed a good distribution, then the water and
super-plasticizer were gradually added while the
mixing kept rotating. The fibers were sprayed
by hand after checking the workability and
viscosity of the mixture. The detailed procedure
of mixing and curing can be found in (J.J. Park,
S.T. Kang, K.T. Koh, n.d.). In their experiment,
the average compressive strength of 50 mm
cubic UHPC specimens was 180 MPa.
UHPFRCs
V
f
=2.0 vol.-%
(1)
Static shear tests
Impact shear tests
Strain rate-dependent
(2)
Correlation between shear and tensile response
Static tensile tests
Impact tensile tests
Fig 1. Experimental layout
The shear prism specimens (50 x 50 x 210
mm
3
) were cast by pouring the mixture into the

Journal of Water Resources & Environmental Engineering - No. 87 (12/2023)
33
mold using a scoop without any vibration. The
cast specimens were covered using a plastic
sheet for preventing the moisture loss, and they
were stored at room temperature for 24 hours
before demolding. The early age specimens
were cured in a hot 90 2
o
C water tank for 48
hours and keep drying until the ages of 28 days
for testing.
Table 1. Matrix composition by weight ratio
Cement
(Type I) Silica Fume
Sand Silica powder Super-plasticize Water
1.00 0.25 1.10 0.30 0.067 0.2
Table 2. Chemical composition and physical properties of cementitious materials
Chemical composition and physical
properties
Cement
(Type I) Silica fume Silica powder
CaO 60.6 0.27 0.20
SiO
2
23.0 95.0 97.2
Al
2
O
3
3.41 0.0 0.0
Fe
2
O
3
3.13 0.31 0.23
MgO 3.68 0.64 0.31
TiO
2
0.00 0.67 0.77
MnO 0.08 0.15 0.13
Chemical
composition
(%)
L.O.I 2.24 2.19 0.91
Mean particle size (µm)
16.1 0.30 3.92 Physical
properties Density (g/cc) 3.15 2.30 2.65
Table 3. Properties of steel fiber
Dimension/Length, mm Density,
(g/cc)
Tensile strength,
u
(MPa)
Elastic
modulus, E (GPa)
30/0.3 7.90 2580 200
Cement Silica fume Silica powder
Silica sand Super-plasticizer Smooth fiber
Fig 2. Images of compendious material
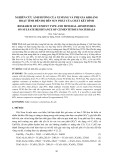
2.2. Test setup and procedure
Fig. 3 shows the shear test setup at static
rates. The shear test setup recently proposed by
(Ngo et al., 2017) was installed in the Universal
Test Machine (UTM). Two ends of specimens
were fixed while the load was applied on two 60
mm separated points. The shear span (a-
horizontal distance between the inner edge of
the supporting block and out the edge of the
loading block) was 25 mm, yielding the span-
to-depth ratios (a/d) was equal to 0.5. The test
setup was installed in the universal test
machine (UTM) with a displacement control
model of 1 mm/min. The applied load was
measured by a load cell installed inside the
UTM and the displacement of the middle part
of the specimen was measured by two linear
variable differential transformers (LDVTs)
attached by an aluminum frame.
Journal of Water Resources & Environmental Engineering - No. 87 (12/2023)
34
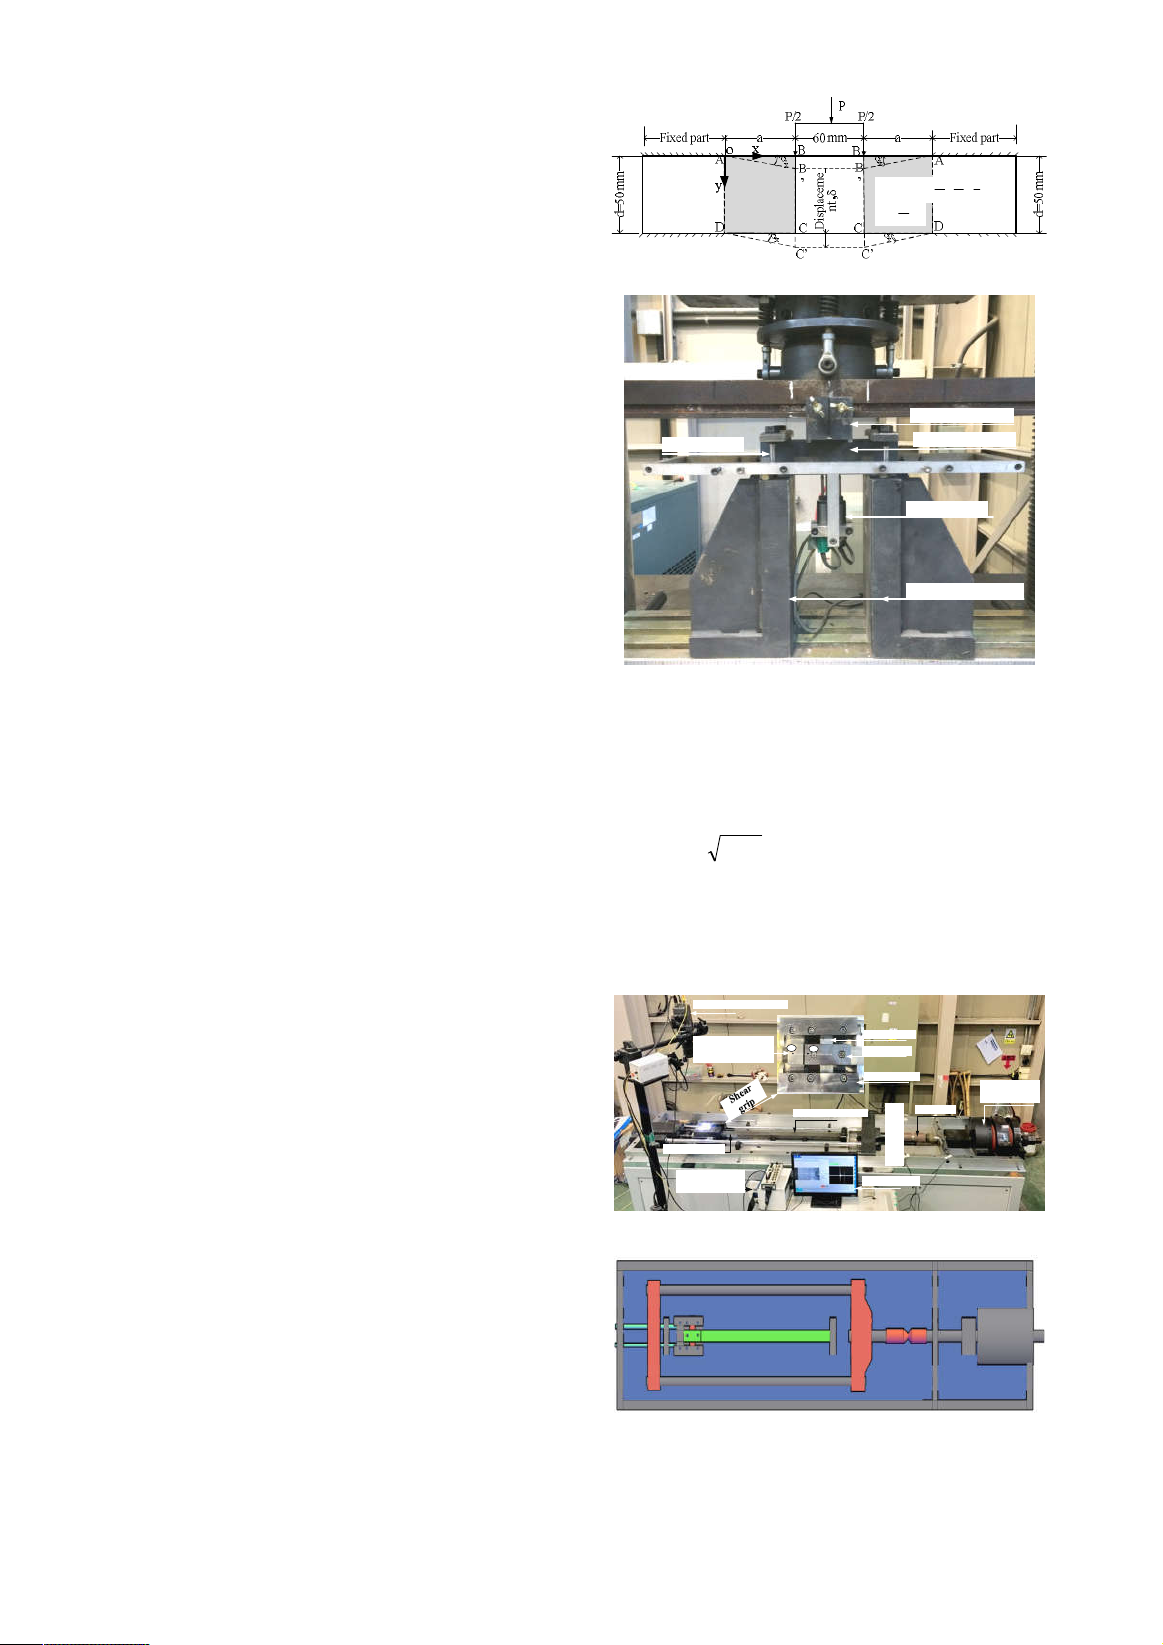
Fig. 4 shows the shear test setup at high
strain rates. A test setup with specimen size and
boundary condition was the same as the static
shear test setup, which was designed and
installed in the I-SEFIM to implement shear
dynamic tests. A fundamental principle of I-
SEFIM was using the strain energy stored in a
high-strength steel frame to generate a high-
speed loading on the specimen. Firstly, a
hydraulic jack stressed the coupler until the
yield limit, the coupler was suddenly broken
and all the strain energy stored in the high
strength frame was released, leading to the
entire frame and the grips moving with very
high energy for breaking the specimens to the
opposite side. The applied loading was
measured by two dynamic strain gauges
attached to the surface of the transmitter bar
while the displacement was measured by a high-
speed camera system. During the test, the
camera captured the movement of marked
points on the surfaces of the moving grip and
fixed grips, with the support of high intensive
light. The stress signal and displacement history
were recorded by a data acquisition connecting
to a computer system. Detail of test processing
could be referred to (Park et al., 2016a; T. K.
Tran & Kim, 2012).
The speed of the impact system could be
controlled by using different coupler and energy
frames (Park et al., 2016a). In this study, two
combinations of coupler and energy frame were
used in the setup: 1) a 800 kN capacity coupler
and high strength steel energy frame; and, 2) a
400 kN capacity coupler and titanium energy
frame. The theoretical impact velocity is
estimated as 13.8 and 13.1 m/s by using Eq. (1)
corresponding to the above combinations,
respectively.
0
y
v
y
ay
v
x
u
yxxy
a) Scheme of shear test setup
Loading block
Supporting blocks
Two LDVTs
Fixed frame Specimen
b) A prototype at Sejong University
Fig 3. Shear test setup at static rates
f
CV
.
(1)
Where, C is the wave velocity of energy
frame (
/EC
), E is the elastic modulus of
the energy frame,
is the density of the energy
frame, and
f
is the strain of the energy frame
when the coupler fails.
High speed camera
Fixed grip
Specimen
Displacement
measuring points
Moved grip
21
Transmitter bar
Strain gauges
Data
acquisition Computer
Coupler
Optica l
trigger
Hydraulic
Jack
a) Prototype in Sejong University (I-SEFIM)
b) Model of shear impact system
Fig 4. Shear test setup at high strain rates

Journal of Water Resources & Environmental Engineering - No. 87 (12/2023)
35
3. Results and discussion
Fig. 5 shows the failure of UHPFRCs
specimen at static and high strain rate tests.
From the test results indicated that all the
specimens failed with two major diagonal shear
cracks accompanied by several fine flexural-
shear cracks. The dominant trend of cracks was
diagonal with the longitudinal axis of the
specimen at an angle of 45
0
. In addition, the
UHPFRC specimen at high strain rates clearly
produced more cracks than those at static rates.
Static shear test
Dynamic shear test
Fig 5. Failure of shear specimens
Fig. 6 shows the average shear stress-versus-
strain responses of UHPFRC reinforced with 2.0
vol.-% smooth steel fibers at different strain
rates, while their average parameters were listed
in Table 3. The shear stress (
), shear strain
capacity (
), and strain rates (
) were
calculated according to Eqs. (2) – (4) for static
test and Eqs. (5) – (7) for the high rate test,
respectively (Ngo & Kim, 2018), as followed:
bd
P
2
(2)
a
(3)
1
000667.0
25
1
60
1
s
a
v
(4)
bd
EA
bd
P
trtrtr
22
(5)
a
dd
a
12
(6)
a
vv
12
(7)
where P (kN) is the applied load;
(mm) is
the displacement of the middle part of specimens;
b, d, and a (mm) are the width, height, and shear
span of specimens;
(mm/min) is the
displacement speed of the UTM.
tr
, A
tr
, and E
tr
are the elastic strain, cross-section area (mm
2
), and
elastic modulus (MPa) of the transmitter bar,
respectively. d
1
,
1
, d
2
, and
2
are the displacement
and velocity of point 1 and point 2 on the surface
of shear grip, respectively, measured by the high-
speed camera system.
As can see in Table 3, shear strength (
max
)
and shear strain capacity (
max
) of UHPFRC
exhibited strong strain-rate dependent. The
max
and
max
at static rate were 24.4 MPa and 0.050,
respectively. As the strain rate increased, the
max
of UHPFRCs increased from 25.8 MPa, at
the high strain rate level h1, to 32.0 MPa, at the
strain rates level h2. In addition, the average
value of
max
increased from 0.050 at static rates
to 0.057 at high strain rates level h
1
and 0.080 at
high strain rates level h
2
.
Table 3. Shear test results at different strain rates
Strain rate t
max
g
max
Test series Spe. Type s
-1
MPa
SP1 24.80 0.047
SP2 23.38 0.054
SP3 24.42 0.047
SP4 25.51 0.052
SP5 24.80 0.047
SP6
Static
6,67
-4
23.38 0.054
Average 6,67
-4
24.4 0.050
LS20-S
SD 0.9 0.003
![Cẩm Nang Xây Dựng: Quy Định Pháp Luật Cần Biết [Chuẩn Nhất]](https://cdn.tailieu.vn/images/document/thumbnail/2025/20251225/tangtuy08/135x160/80661766722918.jpg)