
Tạp chí phân tích Hóa, Lý và Sinh học - Tập 29, Số 1/2023
DETERMINATION OF TRACE METAL CONCENTRATION
IN WASTEWATER HO CHI MINH CITY USING THE INDUCTIVELY
COUPLED PLASMA-MASS SPECTROMETRY
Đến tòa soạn 27-02-2023
Nguyen Quoc Thang1*, Le van Tan1, Nguyen Thi Kim Phuong2
1. Chemical Engineering Faculty, Industrial University of Ho Chi Minh City, Ho Chi Minh City,
Vietnam, 12 Nguyen Van Bao, Go Vap, Ho Chi Minh City, Vietnam
2. Institute of Applied Materials Science, Vietnam Academy of Science and Technology, Vietnam
*Email: nguyenquocthang@iuh.edu.vn
TÓM TẮT
XÁC ĐỊNH HÀM LƯỢNG VẾT CÁC KIM LOẠI TRONG NƯỚC THẢI
Ở THÀNH PHỐ HỒ CHÍ MINH SỬ DỤNG PLASMA CAO TẦN
CẢM ỨNG GHÉP KHỐI PHỔ
Trong nghiên cứu này, lần đầu tiên hàm lượng 19 ion kim loại trong 23 mẫu nước thải ở Thành phố Hồ
Chí Minh được xác định sử dụng plasma cao tần cảm ứng ghép khối phổ (ICP-MS). Khoảng tuyến tính,
giới hạn phát hiện, giới hạn định lượng, độ đúng, độ không đảm bảo đo, độ chính xác trong ngày và giữa
các ngày đã được khảo sát. Kết quả cho thấy thiết bị ICP-MS thích hợp để phân tích hàm lượng kim loại
trong nước thải. Nồng độ kim loại trong nước thải xác định được giảm dần theo thứ tự Mg > Na > Ca >
Ba > Pb > Fe > Al > Zn > Mn > K > Cd > Cu > As > Cr > Tl > Ni. Ngoài ra, nghiên cứu này cũng tìm
ra mối tương quan giữa các ion kim loại trong nước thải, các cặp ion sau có mối tương quan mạnh ở
mức ý nghĩa 0,05%: Ca – K, Ca – Mg, Ca – Na, Cd – Cu, Cr – Pb, và Mg - Na.
Từ khóa: khảo sát, kim loại, ICP-MS, nước thải.
1. INTRODUCTION
Industries play an important role in the
economic growth of any country. However,
most of these industries have contributed
significantly to the pollution level of surface
aquifers. The pollutions were various acids,
alkalis, heavy metals, chlorinated
hydrocarbons, petroleum hydrocarbons, dyes,
and many other chemicals which greatly change
the physicochemical properties of water. High
concentrations of pollution compounds
discharged into the water that was harmful to
the aquatic environment. Pollution compounds
are slowly-biodegradable and can bio-
accumulate in organisms through food chains.
A human can exposure to pollution compounds
through the consumption of foods [1-5]. These
pollution compounds, especially heavy metals
are quite harmful or even seriously toxic to the
aquatic ecosystem [6]. So, many aquatic
organisms have disappeared due to the presence
of pollution contaminants [7]. Heavy metal
levels in the aquatic environment were
monitored through the determination of their
concentrations in lotic and lentic water systems
or wastewater discharge [3, 5, 8, 9].
Many different techniques have been applied to
determine metal in different samples. Many
metals were determined by using flame atomic
absorption spectrometry [10-11], hydride
221
generation atomic absorption spectrometry,
cold vapor-atomic absorption spectrometry
[12,], fluorescence spectrometry [13,],
inductively coupled plasma-mass spectrometry
[14].
Compare to other documents, our study was for
the first time validated the quality criteria of
ICP-MS for analyzing nineteen metal levels in
wastewater samples. The application of this
method was then tested by analyzing nineteen
metal levels in twenty-three wastewater
samples in the Tham Luong Canal in Ho Chi
Minh City. Based on these results, the
correlation of the concentration of these metals
in wastewater samples was determined.
2. MATERIALS AND METHODS
2.1. Chemicals
Analytical grade nitric acid (65%), chlorohydric
acid (36%), and nineteen metals stock standard
solution (1000 mg/L) were acquired from Merck
(Darmstadt, Germany). The working standard
solutions were prepared by diluting an
appropriate aliquot of the standard stock
solutions. All glassware was soaked in 20% (v/v)
nitric acid for 24 h and then the glassware was
rinsed three times with deionized water and
dried.
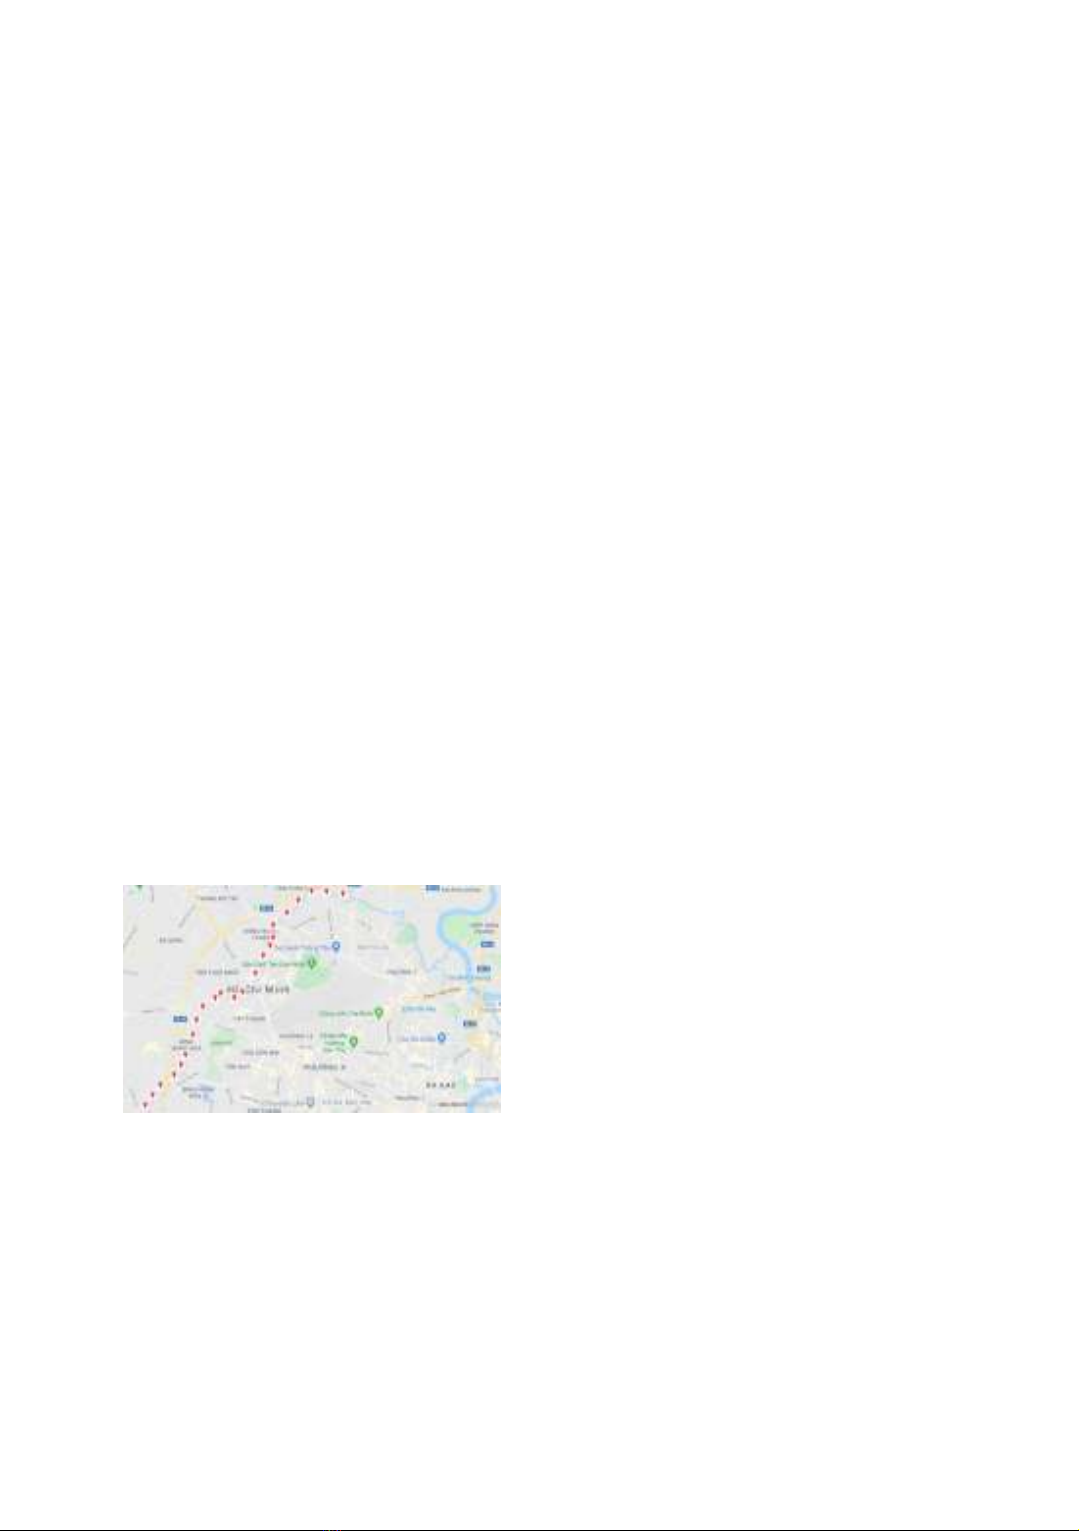
2.2. Sample collection
Figure 1. Description of location of
wastewater sampling
500 mL of wastewater samples were collected
by random method from different sampling
locations along Tham Luong Canal in Ho Chi
Minh City during March 2021 which was the
dry season in Ho Chi Minh City. The Tham
Luong Canal is located between 10°50'45.4"
and 10°47'0.7" North latitude and 106°38'08.8"
and 106°35'36.3" East longitude. Sample
preservation is performed by the sampler
immediately upon sample collection using
HNO3 (pH < 2) and then samples are contained
in high-density polyethylene. The location of all
wastewater samples in this study is provided in
figure 1.
2.3. Apparatus
ICP-MS NexION 300 X, Perkin Elmer
Instruments, including: NexION 300X;
autosampler ASX 520, CETAC; roughing
pump; water re-circulator; the internal standards
are blended by a mixing tee that is before the
nebulizer and after the peristaltic pump.
2.4. Trace heavy metal analyses
Sample digestion using a block digester in dilute
mineral acids is required to determine total
metals in unfiltered aqueous samples.
- As soon as arrived in the laboratory, the
sample was shaken well to homogenize before
sub-sampling for digestion.
- Pipet a 5.0 ± 0.1 mL sub-sample and dispense
the sample into a digestion tube, with each batch
of samples.
- Add 2.0 ± 0.1 mL 65% HNO3 and 1.00 ± 0.05
mL 36% HCl to each sample.
- Cap sample tubes and digest for 2.5 hours at
95 ± 5 °C (excluding the time required to warm
the samples up to 95 °C).
- After 2.5 hours at 95 ± 5 °C, remove the
samples from the heat source and let them cool
for at least 10 minutes.
- Remove the caps and reconstitute samples
back to 10 ± 0.1 mL with de-ionized water.
Shake samples to mix.
- Filter the samples using the 0.45 µm filter disk.
- The filtrate is diluted at the appropriate factor
and ready for ICP-MS analysis.
- The blank sample was repaired by using 5.0 ±
0.1 mL of de-ionized water in a digestion tube.
Add 2.0 ± 0.1 mL of HNO3 and 1.0 ± 0.05 mL
HCl to the water and treat it as the real same
sample.
The quantification of heavy metal was
performed with Inductively Couple Plasma-
Mass Spectrophotometry (ICP-MS 7700,
Agilent, USA)
3. RESULTS AND DISCUSSION
222

3.1. Inductively Couple Plasma-Mass
Spectrophotometry conditions
After some trials with mass, analysis mode, and
internal standards of element metals using
Inductively Couple Plasma-Mass
Spectrophotometry (ICP-MS 7700, Agilent,
USA) at a different value, these parameters
were optimized to determine trace metal
concentration.
Ions consisting of more than one atom cause
isobaric molecular interferences. Common
examples are potential interferences from
40Ar35Cl or 40Ca35Cl on 75As, 40Ar on 40Ca,
40Ar12C on 52Cr, 16O12C35Cl on 63Cu, 40Ar16O on
56Fe, 12C12C on 24Mg, 37Cl18O, 38Ar17O on 55Mn,
44Ca16O, 23Na37Cl on 60Ni, 34S16O2 on 66Zn.
Using the collision cell utilizing He gases
decrease these molecular interferences. A list of
the corrections used is given in the listing of the
isotopes monitored in the NexION 300X ICP-
MS software Chapter 8, Interference Correction
[15]. The transport and nebulization sample
solution process are caused by physical
interferences. These physical interferences and
matrix effects are decreased using internal
standards.
3.2. Quality control criteria for the method
Linearity
Linearity was evaluated by repeated five times
using different concentrations in the range in
table 1 with a determination coefficient (r) from
0.9980 to 1.000. The instrument detection limit
was studied using a calibration blank signal at
the selected analytical masses. The method
detection limit was studied using a synthetic
matrix at the selected analytical masses.
These results were given in table 1. The method
detection limit in this research was lower than
other published methods, for which LOD was
arranged from 0.1 to 17 µg/L [16-18].
Table 1. Linear dynamic range, instrument detection limit, method detection limit of some metals
Elements Linearity (µg/L) R2 The instrument
detection limit (µg/L)
The method detection
limit (µg/L)
27
Al 0.20-500 0.9999 0.169 0.623
75
As
0.02-500 1.0000 0.022 0.059
1
37
Ba
0.02-500 1.0000 0.004 0.085
9
Be 0.02-500 0.9980 0.004 0.007
4
4
Ca 2.00-50000 1.0000 2.737 8.051
1
11
Cd 0.02-500 0.9999 0.005 0.007
52
Cr 0.02-500 0.9999 0.014 0.024
63
Cu 0.20-500 0.9987 0.143 0.073
56
Fe 1.00-500 1.0000 0.122 0.885
20
2
Hg
0.01-5 0.9997 0.004 0.003
39
K
2.00-10000 1.0000
0.986 0.948
24
Mg
2.00-50000 0.9987 0.313 2.102
55
Mn
0.02-500 1.0000 0.019 0.493
23
Na
2.00-50000 0.9996 0.992 3.234
60
Ni
0.02-500 0.9996 0.034 0.047
2
08
Pb
0.20-500 0.9998 0.263 0.818
1
21
Sb
0.02-500 1.0000 0.005 0.006
2
0
5
Tl
0.02-500 0.9997 0.003 0.006
66
Zn
1.00-500 0.9992 0.599 0.975
Short-term precision, long-term stability, accuracy, and uncertainty values
223

Intra-day precision was studied by six replicate
measurements at two concentration levels
which were 20 µg/L, and 50 µg/L of each
element (Be, B, Al, Zn, Cr, Mn, Fe, Ni, Cu, As,
Mo, Cd, Pb, Sb, Tl), 2000 µg/L, 3000 µg/L for
major elements (Ca, Mg, K, Na), and 0.2 µg/L,
0.5 µg/L for Hg. Interday precision was
conducted during the routine operation of the
system. The RSD values were collected to
evaluate the precision of this method. Statistical
evaluation revealed that the relative standard
deviation of metal for six replicate
measurements was less than 1%. The trueness
of the method within-day was between 95.2%
and 108.8%. Measurement uncertainty can be
expressed as an expanded uncertainty. The
parameters obtained were shown in table 2.
These results were shown that there are
appropriately integrated modes for each
element.
Table 2. Repeatability evaluates, the trueness, uncertainty, and recovery values of some metals
Element
Repeatability evaluates
(%RSD) %
Uncertainty
values
Recovery (%) for sample ID
Short-term
precision
Long-term
stability 1 3 8 19 20
27
Al 1.3 2.7 5.6 95.6 102.8 102.9 114.0 106.6
75
As
3.6 5.9 6.9 102.2 106.1 99.7 107.9 93.5
1
37
Ba
1.9 2.4 4.8 86.5 89.5 96.7 99.6 98.0
9
Be 3.8 5.5 12.5 99.4 98.2 98.5 105.4 97.9
4
4
Ca 1.7 1.5 6.4 105.4 104.5 90.9 99.5 97.7
1
11
Cd 2.7 3.1 6.8 108.3 102.0 101.7 100.2 96.6
52
Cr 2.5 3.2 6.3 98.1 94.9 102.1 96.8 94.6
63
Cu 3.0 3.8 6.9 93.3 95.3 105.4 100.6 100.9
56
Fe 3.0 3.5 6.7 95.4 97.9 98.9 101.1 93.9
20
2
Hg
2.0 4.9 9.9 103.9 93.9 92.5 100.5 71.5
39
K
1.3
2.7
5.8 100.3 103.7 103.2 100.6 96.0
24
Mg
2.4
2.8
5.9 102.0 114.0 88.8 100.4 90.2
55
Mn
1.6 2.9 6.0 99.6 92.1 105.0 94.1 91.5
23
Na
2.2 2.9 5.9 101.1 105.5 91.7 97.1 90.3
60
Ni
2.5 3.5 6.3 92.9 94.4 100.6 98.7 96.9
2
08
Pb
5.6 7.3 14.0 101.7 96.3 94.0 98.2 99.3
1
21
Sb
1.6 2.5 6.5 111.3 103.0 99.0 100.5 87.1
2
0
5
Tl
0.7 1.7 10.4 104.3 100.3 98.1 99.6 99.9
66
Zn
2.7 5.9 11.7 97.5 96.1 110.6 97.1 104.1
Spike Recovery
224

20 µg/L of each element (Be, B, Al, Zn, Cr, Mn,
Fe, Ni, Cu, As, Mo, Cd, Pb, Sb, Tl), 2000 µg/L
for major elements (Ca, Mg, K, Na) and 0.2
µg/L for Hg were spiked to the sample. The
recoveries for all elements fluctuate around
100% except for Hg. It demonstrated that this
method is suitable for this type of sample with
high accuracy. From the analysis results, it is
shown that the recovery of these metals in the
wastewater sample was within the acceptable
range of 80 - 110% of AOAC - app F [19].
3.3. Application of the proposed method
The distribution of metals (Al, As, Ba, Be, Ca,
Cd, Cr, Cu, Fe, Hg, K, Mg, Mn, Na, Ni, Pb, Sb,
Tl, and Zn) in wastewater samples from Tham
Luong canal in Ho Chi Minh City has been
evaluated. As shown in table 3, the results
obtained revealed that the concentration of the
metals was found to be in the order of Mg > Na
> Ca > Ba > Pb > Fe > Al > Zn > Mn > K. In
most samples, the concentration of heavy
metals such as Cd, Cr, Cu, Hg, As, and Ni was
low level or not detected, except Pb. Moreover,
the concentration of Pb was higher than the
permissible limit set by WHO (2006) which
could pose a huge threat to human health and
the natural environment [20].
Table 3. Level of heavy metals in wastewater samples
Sample
ID
27Al
(µg/L)
75As
(µg/L)
138Ba
(µg/L)
9 Be
(µg/L)
44Ca
(mg/L)
111Cd
(µg/L)
52Cr
(µg/L)
63Cu
(µg/L)
56Fe
(µg/L)
202Hg
(µg/L)
1
ND
2
.
3
2
8
.7
ND
9
9
.2
1.2
0.4
4.6
2.1
ND
2 ND 4.1 48.9 ND 543.0 1.7 0.4 3.7 7.8 ND
3 3.2 ND 45.3 ND 331.0 0.2 0.7 6.1 16.4 ND
4 ND ND 90.1 ND 110.0 0.7 0.8 2.5 119.1 ND
5 6.7 ND 83.6 ND 183.0 2.3 1.2 3.2 90.9 ND
6 4.5 7.5 26.2 ND 413.0 2.7 3.3 2.6 2.4 ND
7 3.6 1.1 83.4 ND 180.0 2.1 7.1 5.1 91.5 ND
8 6.6 10.1 35.3 ND 314.0 1.6 8.5 3.4 6.6 ND
9 6.5 3.3 19.2 ND 434.0 5.0 3.6 3.8 8.9 ND
10 ND 2.6 452.0 ND 38.8 ND 5.1 2.9 16.1 ND
11 21.4 2.2 104.0 ND 142.0 1.1 6.3 5.7 80.0 ND
12 37.8 25.9 36.0 ND 83.1 0.8 5.8 6.2 34.1 ND
13 45.1 ND ND ND ND 1.5 5.9 6.5 50.2 ND
14 34.3 2.8 46.2 ND 131.0 2.5 6.3 5.6 34.6 ND
15 14.8 13.6 41.3 ND 362.0 4.2 6.7 5.1 54.5 ND
16 50.8 14.7 39.8 ND 366.0 0.8 7.2 2.6 61.6 ND
17 73.3 3.1 44.9 ND 132.0 0.5 2.1 3.3 51.6 ND
18 44.7 25.3 35.0 ND 86.3 1.4 1.5 2.1 43.0 ND
19 182.0 ND 19.7 ND 4.94 1.8 1.4 7.8 55.7 ND
20 51.8 14.6 36.5 ND 5.95 2.7 0.8 18.4 46.8 ND
21 50.9 2.5 36.6 ND 67.6 15.1 0.7 62.9 22.5 ND
22 ND ND 49.4 ND 51.3 6.4 0.9 15.6 32.1 ND
23 ND 5.2 55.9 ND 552.0 2.4 1.1 5.9 4.8 ND
Average
25.5 6.1 63.4 0.0 201.3 2.6 3.4 8.1 40.6 ND
225


![Bài giảng An toàn bức xạ: Bảo vệ an toàn đối với chiếu xạ ngoài - TS. Nguyễn Thái Hà [Chuẩn nhất]](https://cdn.tailieu.vn/images/document/thumbnail/2026/20260506/camtucau2026/135x160/80481778236374.jpg)


![Bài giảng An toàn bức xạ: Nguyên tử và các bức xạ ion hoá - TS. Nguyễn Thái Hà [Mới nhất]](https://cdn.tailieu.vn/images/document/thumbnail/2026/20260506/camtucau2026/135x160/67301778236378.jpg)


![Bài giảng Hoá kỹ thuật môi trường 2 - Đại học Xây dựng Miền Tây [Mới nhất]](https://cdn.tailieu.vn/images/document/thumbnail/2026/20260512/hoatulip0906/135x160/59431778724718.jpg)


![Giáo trình Tài nguyên năng lượng và bảo vệ môi trường - Trường CĐ Cơ điện Hà Nội [Mới nhất]](https://cdn.tailieu.vn/images/document/thumbnail/2026/20260323/lionelmessi01/135x160/8121774378783.jpg)
![Đề cương bài giảng Kỹ thuật xử lý môi trường - Trường Cao đẳng Cơ điện Hà Nội [Chuẩn nhất]](https://cdn.tailieu.vn/images/document/thumbnail/2026/20260323/lionelmessi01/135x160/75051774429892.jpg)
![Giáo trình Bảo vệ môi trường (Nghề Bảo vệ thực vật CĐ/TC) - Trường Cao đẳng Gia Lai [Mới Nhất]](https://cdn.tailieu.vn/images/document/thumbnail/2026/20260224/hoacattuong2026/135x160/61741772002861.jpg)


%20--%3e%3cdefs%3e%3cstyle%3e%20.st0%20{%20fill:%20%23fff;%20}%20.st1%20{%20fill:%20%237800fa;%20}%20%3c/style%3e%3c/defs%3e%3cpath%20class='st1'%20d='M117.78,12.18H43.11c2.9,3.47,4.65,7.94,4.65,12.82,0,5.6-2.3,10.66-6.01,14.29h76.02l7.22-13.56-7.22-13.56Z'/%3e%3cg%3e%3cpath%20class='st0'%20d='M53.58,26.17h-.59v-1.46h.59v-4.96h2.83c1.78,0,2.67.94,2.67,2.82v5.76c0,1.87-.89,2.81-2.67,2.81h-2.83v-4.96ZM55.36,21.37v3.34h1.1v1.46h-1.1v3.34h1.01c.61,0,.91-.37.91-1.1v-5.93c0-.74-.3-1.1-.91-1.1h-1.01Z'/%3e%3cpath%20class='st0'%20d='M65.99,31.14h-1.8l-.31-2.07h-2.19l-.31,2.07h-1.64l1.82-11.39h2.62l1.82,11.39ZM65.28,18.04c-.25.46-.51.77-.75.94-.21.15-.47.22-.79.22-.26,0-.57-.07-.92-.22l-.38-.15c-.14-.05-.26-.07-.37-.07-.3,0-.53.18-.71.54l-.91-.68c.25-.46.51-.77.75-.94.21-.14.48-.21.79-.21.26,0,.57.07.92.21l.38.15c.14.05.26.07.37.07.3,0,.53-.18.71-.54l.91.68ZM61.91,27.52h1.73l-.87-5.76-.87,5.76Z'/%3e%3cpath%20class='st0'%20d='M74.53,26.89v1.52c0,1.91-.89,2.86-2.67,2.86s-2.67-.95-2.67-2.86v-5.93c0-1.91.89-2.86,2.67-2.86s2.67.95,2.67,2.86v1.11h-1.69v-1.22c0-.75-.31-1.12-.93-1.12s-.93.37-.93,1.12v6.15c0,.74.31,1.11.93,1.11s.93-.37.93-1.11v-1.63h1.69Z'/%3e%3cpath%20class='st0'%20d='M81.4,31.14h-1.8l-.31-2.07h-2.19l-.31,2.07h-1.64l1.82-11.39h2.62l1.82,11.39ZM75.9,19.2l1.52-1.91h1.71l1.51,1.91h-1.61l-.76-.95-.75.95h-1.61ZM77.32,27.52h1.73l-.87-5.76-.87,5.76ZM83.1,15.99l-1.76,1.91h-1.26l1.17-1.91h1.86Z'/%3e%3cpath%20class='st0'%20d='M84.86,19.75c1.78,0,2.67.94,2.67,2.82v1.48c0,1.87-.89,2.81-2.67,2.81h-.85v4.28h-1.79v-11.39h2.64ZM84.01,21.37v3.86h.85c.58,0,.87-.36.87-1.08v-1.71c0-.71-.29-1.07-.87-1.07h-.85Z'/%3e%3cpath%20class='st0'%20d='M93.51,19.75c1.78,0,2.67.94,2.67,2.82v1.48c0,1.87-.89,2.81-2.67,2.81h-.85v4.28h-1.79v-11.39h2.64ZM92.66,21.37v3.86h.85c.58,0,.87-.36.87-1.08v-1.71c0-.71-.29-1.07-.87-1.07h-.85Z'/%3e%3cpath%20class='st0'%20d='M98.8,31.14h-1.79v-11.39h1.79v4.88h2.03v-4.88h1.83v11.39h-1.83v-4.88h-2.03v4.88Z'/%3e%3cpath%20class='st0'%20d='M105.36,24.55h2.46v1.62h-2.46v3.34h3.09v1.63h-4.88v-11.39h4.88v1.63h-3.09v3.18ZM108.17,17.29l-1.76,1.91h-1.26l1.17-1.91h1.86Z'/%3e%3cpath%20class='st0'%20d='M112.2,19.75c1.78,0,2.67.94,2.67,2.82v1.48c0,1.87-.89,2.81-2.67,2.81h-.85v4.28h-1.79v-11.39h2.64ZM111.35,21.37v3.86h.85c.58,0,.87-.36.87-1.08v-1.71c0-.71-.29-1.07-.87-1.07h-.85Z'/%3e%3c/g%3e%3ccircle%20class='st1'%20cx='25'%20cy='25'%20r='20'/%3e%3cpath%20class='st0'%20d='M32.78,19.27c2.92,0,4.43,2.55,5.28,5.33l.71,2.17c.14.38-.33.75-.71.75h-5.61c.19-.33.24-.71.09-1.08l-.75-2.45c-.43-1.32-.99-2.64-1.79-3.77.75-.57,1.65-.94,2.78-.94h0ZM25,18.38c3.25,0,4.9,2.78,5.89,5.89l.76,2.45c.14.42-.33.8-.8.8h-11.69c-.42,0-.94-.38-.8-.8l.75-2.45c.99-3.11,2.64-5.89,5.89-5.89h0ZM25,11.35c1.74,0,3.11,1.37,3.11,3.11s-1.37,3.11-3.11,3.11-3.11-1.41-3.11-3.11,1.41-3.11,3.11-3.11h0ZM17.27,19.27c1.08,0,1.98.38,2.73.94-.8,1.13-1.37,2.45-1.74,3.77l-.8,2.45c-.14.38-.05.75.09,1.08h-5.56c-.42,0-.9-.38-.75-.75l.71-2.17c.9-2.78,2.41-5.33,5.33-5.33h0ZM17.27,12.91c1.51,0,2.78,1.27,2.78,2.83s-1.27,2.83-2.78,2.83-2.83-1.27-2.83-2.83,1.27-2.83,2.83-2.83h0ZM32.78,12.91c1.56,0,2.78,1.27,2.78,2.83s-1.23,2.83-2.78,2.83-2.83-1.27-2.83-2.83,1.27-2.83,2.83-2.83h0ZM27.07,28.56v.09c0,.57-.24,1.08-.61,1.46h0v.05c-.38.33-.9.57-1.46.57s-1.08-.24-1.46-.61h0c-.38-.38-.61-.9-.61-1.46v-.09h1.41v.09c0,.19.05.38.19.47v.05c.09.09.28.19.47.19s.38-.09.47-.19v-.05c.14-.09.24-.28.24-.47t-.05-.09h1.41ZM30.99,28.56v.09c0,1.65-.66,3.16-1.74,4.24-1.08,1.08-2.59,1.79-4.24,1.79s-3.16-.71-4.24-1.79l-.05-.05c-1.04-1.08-1.7-2.55-1.7-4.2v-.09h1.41v.09c0,1.27.47,2.4,1.27,3.25h.05c.85.85,1.98,1.37,3.25,1.37s2.4-.52,3.25-1.37c.85-.8,1.37-1.98,1.37-3.25v-.09h1.37ZM34.99,28.56v.09c0,2.78-1.13,5.28-2.92,7.07-1.79,1.79-4.29,2.92-7.07,2.92s-5.23-1.13-7.07-2.92c-1.79-1.79-2.92-4.29-2.92-7.07v-.09h1.41v.09c0,2.4.94,4.53,2.5,6.08,1.56,1.56,3.72,2.5,6.08,2.5s4.52-.94,6.08-2.5c1.56-1.56,2.5-3.68,2.5-6.08v-.09h1.41Z'/%3e%3c/svg%3e)