62 Ngoc Hong Nguyen, Trung Xuan Nguyen
IDENTIFYING POTENTIAL URBAN FOCAL POINTS USING MULTIPLE
CENTRALITY ASSESSMENT (MCA): DA NANG’S CENTER AS A CASE STUDY
Ngoc Hong Nguyen*, Trung Xuan Nguyen
The University of Danang - University of Science and Technology, Vietnam
*Corresponding author: nhngoc@dut.udn.vn
(Received: September 15, 2024; Revised: October 02, 2024; Accepted: October 15, 2024)
DOI: 10.31130/ud-jst.2024.558E
Abstract - Conventionally, identifying urban focal points is
primarily based on subjective and intuitive evaluations. This
paper aims to establish an objective method for identifying urban
focal points by applying Multiple Centrality Assessment (MCA),
a spatial network analysis tool. The authors calculate
Betweenness, Straightness, and Closeness values within the urban
street network and combine these metrics to generate a composite
value, thereby identifying urban focal points in terms of
connectivity and accessibility. This combined value is used to
create maps of focal points and focal clusters, providing a
scientific approach in this practice of urban design. The paper
uses Da Nang City as a case study. The study’s results offer an
evident-based approach in proposing urban focal points in urban
design and planning.
Key words – MCA; hotspot analysis; Da Nang
1. Introduction
Identifying urban focal points plays an important role
in guiding urban development and attracting investment. In
the Explanatory Report for the Adjustment to the General
Planning of Da Nang in 2030, with a vision to 2045, on
page 252 [1], the focal points are described as “...special
destinations, aimed at emphasizing the identity of Da
Nang... Various focal points are oriented to create
diversity and excitement for residents and tourists when
visiting and experiencing the city. The focal points are
arranged along coastal and river corridors, hillside
subdivisions, gateway areas, and within tourism,
entertainment, and recreation complexes...” Thus, it can
be seen that the focal points are identified based on whether
they possess a distinctive identity or create an impressive
image. In addition, the focal points are also positioned
“along coastal and river corridors... gateway areas...”
If we exclude the first groups of features that define the
focal points through qualitative means, which are difficult
to quantify - such as identity or interest - the other
characteristics of the focal points suggest that they can and
should be identified more objectively, relying more on
evidence or data (i.e., data-driven or evidence-based
approach).
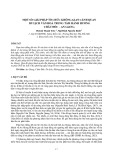
Specifically in Da Nang, the potential focal points
include (Figure 1):
The focal points are structures: These include
structures such as the Da Nang City Administrative Center,
the new CBD (i.e., the An Don area), the Financial,
Commercial, Entertainment, and Casino Complex Project
at the corner of Pham Van Dong and Vo Nguyen Giap
streets, the area at the end of Phan Dang Luu Street, the
corner of Hoang Sa and Le Duc Tho streets, the corner of
Nguyen Tat Thanh and Nguyen Sinh Sac streets, and the
corner of Truong Sa and An Nong streets, etc.
The open space focal points: These include 2-9 Square
and the Fireworks Festival grandstand area, Asia Park, etc.
Cluster focal points: These include the area of Cham
Museum – APEC Park – Bach Dang Street – Nguyen Van
Troi Bridge – Tran Hung Dao Street, the Ba Na Hills
Tourist Area, the integrated resort area of Lang Van, the
Vinacapital golf course project area, the Son Tra tourism
area, and the area surrounding Dragon Bridge – the square
– nearby structures, the Financial, Commercial,
Entertainment, and Casino Complex Project, the
International Fireworks Festival Complex, and the
InterContinental Danang Sun Peninsula Resort.
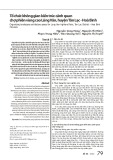
Figure 1. The focal points are identified according to the
overall urban design framework
(Source: Explanatory Report – Adjustment of the General
Planning of Da Nang in 2030, with a vision to 2045)
If we only consider the focal points located in
“... coastal and river corridors, hillside subdivisions,
gateway areas, and tourism, entertainment, and recreation
complexes...” they still tend to be subjective and emotional.
For example, the city’s focal points are primarily based on
tall buildings and architecturally prominent structures. This
approach lacks scientific basis, is not evidence-based, and
does not fully reflect important factors like connectivity
and accessibility within the urban network. This subjective
method can lead to an excessive focus on existing tall
buildings while overlooking other important factors such
as transportation, connectivity, and the functionality of the
space. Similarly, some open space and cluster focal points
tend to favor certain investors (e.g., Sun Group, Financial
Center Complex), etc.

ISSN 1859-1531 - THE UNIVERSITY OF DANANG - JOURNAL OF SCIENCE AND TECHNOLOGY, VOL. 22, NO. 11C, 2024 63
Therefore, it is crucial to objectively identify focal
points in a scientific way, which can serve as a foundation
for urban space redevelopment and attracting investment.
In this study, the authors propose the use of the Multiple
Centrality Assessment (MCA) method as a scientific tool
to objectively identify urban focal points and focal point
clusters. MCA is a spatial network analysis method that
calculates key values such as Betweenness, Straightness,
and Closeness - developed by Porta et al. [2] - to assess the
connectivity and accessibility of areas within the city. By
using an objective approach, this study not only helps to
scientifically identify focal points but also supports
planners in making evidence-based decisions for selecting
focal points.
2. Literature Review
Currently, methods for identifying urban focal points
often rely on easily recognizable and subjective criteria
such as tall buildings, iconic architectural structures, or
famous public spaces. These methods are typically used by
planners and architects. However, this approach is not
systematic and lacks a scientific foundation, leading to an
incomplete reflection of factors that affect the urban spatial
experience, such as accessibility, transportation
connectivity, and interactions between areas.
The Multiple Centrality Assessment (MCA) method
has been widely applied in urban studies to analyze and
evaluate the spatial network structure of cities. MCA
allows for the calculation of indicators such as
Betweenness, Straightness, and Closeness to assess the
importance of each point in the urban network, thereby
identifying areas that play a strategic role in the
transportation system and public spaces. Studies have
shown that MCA can provide valuable information for
urban development, from identifying key transportation
corridors to proposing suitable locations for new buildings.
The importance of Betweenness, Straightness, and
Closeness values in analyzing the urban spatial network
has been demonstrated in numerous studies. Research by
Porta and colleagues indicates that the centrality of a
network correlates with accessibility, proximity,
connectivity, and efficiency [3]. However, network
centrality research has been established for a long time.
Alex Bavelas was the first to apply network research to
interpersonal communication in sociology [4], showing
that good positions in a social network are equivalent to
power, influence, and control over others. The concept of
centrality was further developed by Freeman and
colleagues [5] to study networks of social relationships.
Freeman defined central attributes as Closeness and
Betweenness.
Network analysis is developed based on a graph theory,
in which relationships simplify any network into a set of
nodes and edges with different configurations. In network
studies, particularly road networks, Multiple Centrality
Assessment (MCA) uses four different centrality
indicators: Closeness, Betweenness, and Straightness.
MCA indicators have been used to quantify the relationship
between street centrality and density, as well as the types
of economic, commercial, and service activities [6], [7].
Additionally, studies have employed MCA indicators to
explore the importance of different public transportation
nodes [8], evaluate factors influencing traffic flow at
specific intersections [8], and examine the redistribution of
subway passenger traffic [10].
The Betweenness indicator measures the extent to
which a point acts as an intermediary in the shortest routes
between other points in the network, helping to identify
areas likely to regulate high traffic flow. The Straightness
indicator evaluates the directness of routes connecting a
point to other points, reflecting the efficiency of movement
through urban space. Closeness is a type of centrality
measure that reflects how close a node (i.e., an intersection)
is to all other nodes in the street network. This indicator
measures the accessibility of a point to the entire network,
showing areas that are easily accessible and well-
connected. These centrality indicators provide a
comprehensive view of the urban spatial structure, helping
to identify points with strategic roles and high development
potential.
The gap in current research highlights the need to
objectively identify urban focal points. Most current
studies focus on traffic analysis or spatial network
evaluation but have not fully explored the potential of
MCA indicators in urban design.
3. Methodology
The scope of this paper focuses on the central urban
area and the adjacent northern and southern areas of Da
Nang City. The criteria for selecting focal points in the
study area include locations with high centrality values,
indicating prominence in terms of connectivity and
accessibility. These points represent areas with the
potential to become urban focal points and play an
important role in the spatial structure of the city.
The research data were collected from the road network
map of Da Nang City, including detailed information on
the street system and intersections. This data includes
geographic coordinates, connections between points in the
network, and specific characteristics of the roads. The data
sources were obtained from Open Street Map.
Multiple Centrality Assessment (MCA) was applied to
calculate the Betweenness, Straightness, and Closeness
indices for each point in the urban network. Betweenness
measures the intermediary role of a point within the
network, Straightness assesses the efficiency of connecting
routes, and Closeness reflects the accessibility of a point to
the entire network. After calculating the Betweenness,
Straightness, and Closeness values, these indices were
combined to create a single composite centrality score.
This combined value allows for evaluating the importance
of each node in terms of connectivity and accessibility.
In this study, the authors assigned weights to
Betweenness (0.4), Straightness (0.3), and Closeness (0.3),
reflecting the relative importance of each index in terms of
urban connectivity and accessibility. Betweenness was
given the highest weight (0.4) because it measures how
much an intersection acts as an intermediary in the shortest

64 Ngoc Hong Nguyen, Trung Xuan Nguyen
routes between other nodes. This is significant for
assessing the role of an intersection in traffic flow control
within the road network.
Straightness and Closeness were assigned lower
weights (0.3), but they still play important roles.
Straightness measures the directness of routes, reflecting
the efficiency of movement through the road network.
Closeness measures the accessibility of a point to the entire
network, indicating the proximity and direct connection of
an intersection. These weights have been emphasized in
studies by Sevtsuk and Mekonnen [8]. After calculating
these values, the authors divided the composite centrality
values into 2, 3, and 4 standard deviations. Locations with
values of 2 standard deviations or higher were selected as
focal points.
The analysis was conducted using the Python
programming language, utilizing the Osmnx package built
by Jeff Boeing [9] and the Momepy package by Martin
Fleischman [10] to analyze Betweenness, Straightness, and
Closeness values. These tools allow for visualizing the
analysis values and creating composite index maps, clearly
illustrating prominent areas within the urban network of the
central city area of Da Nang.
4. Results
The results indicate that with values greater than 1.5
times the standard deviation, there are 540 locations across
the entire city of Da Nang can be candidates for potential
focal points. Corresponding to 2 times the standard
deviation, there are 357 locations; greater than 2.5 times
the standard deviation, there are 209 locations; and greater
than 3.5 times the standard deviation, there are 71
locations.
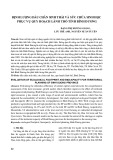
Figure 2. The focal points in the central area show that very few
align with the Adjusted Planning. (Source: the author)
When considering only the central area and adjacent
peripheral areas of the city, there are 27 points and clusters
(i.e., when focal points are within 100 meters of each other,
they are grouped into a cluster) along Nguyen Tat Thanh
Street with values ranging from 2.33 to 4.53 times the
standard deviation.
There are 19 points and clusters along Truong Chinh
Street, 15 points and clusters along Le Trong Tan - Tran
Duc Streets, and 4 points and clusters along Au Co Street.
However, since these points are not in the inner city center
and adjacent areas, the authors did not take them into
consideration.
In the inner city center (Hai Chau District and part of
Thanh Khe District), 18 points were selected with values
greater than 3 times the standard deviation. These points
are located along Tran Cao Van Street (4 points and
clusters), Ong Ich Khiem Street (2 points and clusters), and
Dien Bien Phu Street (5 points and clusters). Other streets
in the inner city center generally have only a few points and
clusters that could serve as focal points, such as: Hai Phong
Street (3 points and clusters), Le Duan Street (3 points and
clusters), and Nguyen Van Linh Street (1 point).
To the north of the inner city center, there are 5 points
and clusters along Hoang Thi Loan Street and one point on
Tot Dong Street.
To the south of the city center, there are also several
locations with the potential to become focal points. There
are a total of 11 locations with this potential: Duy Tan
Street (2 points), Bach Dang Street (2 points), 2-9 Street
(4 points and clusters), Xo Viet Nghe Tinh Street, Tien Son
Bridge, and Ho Xuan Huong Street (3 points and clusters).
East of the Han River, there are 10 locations, with Tran
Hung Dao Street containing many potential focal points
(5 points and clusters)-including a cluster at the head of the
Han River Bridge-and along Ngu Hanh Son Street
(5 points and clusters).
In the area outside the inner city, there are 29 points and
clusters with values over 2 times the standard deviation.
Most of these points are located along Le Dai Hanh Street
(10 points and clusters). Additionally, there are points
along Cach Mang Thang Tam Street (7 points and clusters),
Ong Ich Duong Street (3 points and clusters), Thang Long
Street (4 points and clusters), and Nguyen Huu Tho Street
(5 points and clusters).
The Hoa Xuan area alone has up to 8 points and
clusters.
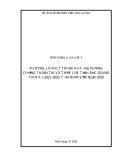
Figure 3. Comparison of focal points from MCA and focal
points in the Adjusted Planning. (Source: the author)
5. Discussion
After comparing the research results with the urban
focal points that have been planned in the Adjustment of
Da Nang City’s General Planning in 2030, with a vision to
2045, the authors found the following points:
First, most of the focal points identified through the
MCA analysis do not overlap with those in the Adjusted
Planning. Among the 82 locations with the potential to
become focal points in the central and adjacent northern
and southern areas of the city, according to the MCA

ISSN 1859-1531 - THE UNIVERSITY OF DANANG - JOURNAL OF SCIENCE AND TECHNOLOGY, VOL. 22, NO. 11C, 2024 65
analysis, only three points coincide with the positions in
the General Planning Adjustment. These are the focal point
at the intersection of Nguyen Sinh Sac and Nguyen Tat
Thanh streets, and two cluster focal points in the eastern
and western areas of the Dragon Bridge. This indicates a
need to reconsider and re-evaluate the selection of focal
points in the General Planning Adjustment.
However, it is important to note that the proposed
locations are suggestions and do not include focal points with
urban or architectural identity or landscape value. The
suggested locations are based on the combined index of the
quantitative MCA method and can be selected as focal points.
Future research should focus on evaluating these identity-
building or image-creating focal points. Another essential task
is to review the proposed focal points from the MCA analysis
based on the approved land-use planning maps.
This study highlights the need to reassess focal points
in a more objective way and to identify them through data-
driven or evidence-based research. The focal points
identified need not be at the city-wide scale; they can serve
as local centers. One important point that this study reveals
is that the number of focal points can be quite large. Rather
than just a few points or a few dozen, the focal points must
be local and serve specific positions in each area, rather
than being city-wide landmarks.
The selection of focal points in this study does not yet
include landscape or identity-preserving focal points. To
ensure comprehensiveness, a serious study is needed to
evaluate focal points related to culture, history, and urban
identity.
Urban identity is not only limited to physical factors but
also includes historical and cultural values, as well as how
residents and visitors perceive that space. Therefore, to
provide a comprehensive perspective, future research must
integrate the element of urban identity with the quantitative
indices used in the MCA. This combination will help create
an integrated approach, evaluating both the connectivity
and accessibility values of the urban network, while also
incorporating cultural, historical, and aesthetic factors.
6. Conclusion
This paper uses the Multiple Centrality Assessment
(MCA) method to identify urban focal points based on road
network data. This is a new approach to studying focal
points in urban design. Instead of relying solely on
qualitative criteria such as visual appeal or the prominence
of existing structures, the focal points identified in the
Adjustment of Da Nang City’s General Planning in 2030,
with a vision to 2045, emphasize architectural prominence,
primarily tall buildings or famous structures. This has led
to the neglect of important factors like connectivity and
accessibility within the urban network. Through the MCA
combined index analysis, only three locations coincided
with the focal points identified in the General Planning
Adjustment. The analysis results show that these focal
points do not necessarily align with the city’s current
planning framework. The study reveals that the focal points
in the adjusted plan may be incomplete and have
overlooked locations with potential to serve the city.
In this study, the authors use the Multiple Centrality
Assessment (MCA) method, combining the Betweenness,
Straightness, and Closeness indices. The paper provides a
quantitative analysis approach to identifying urban focal
points based on connectivity and accessibility. The study
shows that focal points are not just prominent locations
across the entire city but can also include smaller points
that serve local areas. This study expands the concept of
focal points, suggesting that urban design should consider
many smaller centers that meet local needs.
The authors have developed an innovative approach to
identifying urban focal points. The study uses quantitative
methods and evidence-based research in urban planning.
Future studies on focal points should continue to
explore how data-driven focal points can be combined with
qualitative assessments, including locations or structures
with identity and historical value. It is also necessary to
cross-check the potential focal points identified with
approved land-use planning.
REFERENCES
[1] Explanation - The adjustment of Da Nang City master plan until
2030, Vision to 2045, 2020.
[2] S. Porta, P.Crucitti, and V. Latora, “The Network Analysis of Urban
Streets: A Dual Approach”, Physica A: Statistical Mechanics and its
Applications, vol. 369, no. 2, pp. 853-866, 2006.
[3] S. Porta et al., “Street Centrality and the Location of Economic
Activities in Barcelona”, Urban Studies, vol. 49, no. 7, pp. 1471-
1488, 2012.
[4] A. Bavelas, “A Mathematical Model for Group Structures”, Human
Organization, vol. 7, no. 3, pp. 16-30, 1948.
[5] L. C. Freeman, “Centrality in Social Networks: Conceptual
Clarification”, Social Networks, vol. 1, no. 3, pp. 215-239, 1979.
[6] M. Özüdoğru, M. Ucal, and G. Gunes, “The Impact of Urban Street
Centrality on Economic Activities: A Case Study of Istanbul”,
Journal of Urban Planning and Development, vol. 146, no. 4, 2020,
doi: 04020043.
[7] S. Porta et al., “Street Centrality and Densities of Retail and Services
in Bologna, Italy” Environment and Planning B: Planning and
Design, vol. 36, no.3, pp. 450-465, 2009.
[8] A. Sevtsuk and M. Mekonnen, Urban Network Analysis: A New
Toolbox for Measuring City Form in ArcGIS. Proceedings of the
Symposium on Simulation for Architecture and Urban Design
(SimAUD), no. 18, pp. 1-10. 2012
[9] J. Boeing, “OSMnx: New methods for acquiring, constructing,
analyzing, and visualizing complex street networks.” Computers,
Environment and Urban Systems, vol. 65, pp. 126-139, 2017,
doi:10.1016/j.compenvurbsys.2017.05.004.
[10] M. Fleischmann, “Momepy: Urban Morphology Measuring
Toolkit”, Journal of Open Source Software, vol. 4, no. 43, pp. 1807,
2019, doi:10.21105/joss.01807.