ISSN 1859-1531 - THE UNIVERSITY OF DANANG - JOURNAL OF SCIENCE AND TECHNOLOGY, VOL. 22, NO. 12, 2024 1
AN ANALYTICAL MODEL OF CONTENTION IN WIRELESS SENSOR
NETWORKS USING TREE ROUTING
Vo Que Son1,2*
1Ho Chi Minh City University of Technology, Vietnam
2Vietnam National University Ho Chi Minh City, Vietnam
*Corresponding author: sonvq@hcmut.edu.vn
(Received: June 20, 2024; Revised: October 02, 2024; Accepted: October 04, 2024)
DOI: 10.31130/ud-jst.2024.316E
Abstract - Presently, the focus of current research on Wireless
Sensor Networks (WSNs) is predominantly on contention at the
MAC layer, overlooking the traffic characteristics of upper-layer
traffic, especially the interaction with the routing traffic. Hence,
balancing network adaptation and data throughput is critical in
WSN deployments. This paper introduces an analytical model to
assess collision probabilities, applicable for evaluating the
effectiveness of WSNs using tree routing protocols. It examines
collision probabilities across various types of traffic load,
including routing and data traffic, highlighting their
interconnected influences. The model also employs practical
parameters like routing information forwarding rate,
acknowledgments, and data rate to enhance applicability.
Validation through simulation demonstrates strong alignment
between the analytical and simulated results, suggesting the
model's efficacy in pre-deployment evaluations of WSN
applications. This leads to the belief that the model can be a
suitable candidate to evaluate the network performance before
deploying WSN applications.
Key words - Wireless Sensor Networks; MAC; tree routing,
contention.
1. Introduction
In a free space, a radio channel is shared by many nodes
of a wireless network. However, this medium cannot be
concurrently accessed by two or more nodes, as the
transmission from one node may lead to conflicts or
collisions at another node(s). Considering the energy
perspective in WSNs, collisions negatively impact overall
performance, reducing channel capacity due to corrupted
packets and resulting in energy wastage as neighboring
nodes engage in idle listening.
Two common strategies that address the challenge of
facilitating efficient channel access for multiple nodes in
WSNs are CSMA and TDMA. The TDMA approach
solves channel access issues by implementing a schedule
of timeslots, ensuring contention-free transmission for all
network nodes. However, TDMA faces various drawbacks,
such as challenges with timing synchronization and the
assignment of effective time slots. To address these issues,
several research works [1 - 3] have promoted global time
synchronization, and a distributed TDMA approach is
proposed [4] to alleviate these limitations, improving the
practicality of TDMA for WSNs. On the other hand, the
CSMA approach is commonly used in WSNs because of
its simplicity. Nodes in contention employ a random
backoff period, checking the channel activities and
transmitting data if it is idle. If the radio channel is
considered busy, the nodes repeat the process. The CSMA
protocol at the MAC layer provides several benefits, such
as simplicity, flexibility, and resilience, enabling nodes to
join or leave the network effortlessly without additional
procedures.
In WSNs, there are two main routing paradigms: tree
routing (proactive) and reactive routing. Tree routing
protocols [5 - 8] are more commonly used due to their
various advantages, such as adaptability to node mobility
and their suitability for many-to-one data collection
applications. Under tree routing, WSNs generate two types
of traffic patterns including routing traffic and data traffic.
Up to now, analyses of Medium Access Control (MAC)
protocols have not explored the impact of collisions
between traffic types (data and routing). Consequently,
networks utilizing tree routing are often not optimally
configured, potentially resulting in suboptimal
performance for data transmission.
To bridge this gap, this paper introduces an analytical
model for collision probability analysis in WSNs
employing tree routing. The model incorporates
considerations for acknowledgment transmissions and the
routing flooding issue. Additionally, the individual and
mutual probabilities of these two kinds of traffic are also
investigated.
2. Background and related works
In the field of WSNs, various MAC protocols [9 - 15]
have been studied and implemented. A stochastic model
proposed in [16] assesses the performance of these MAC
protocols. Additionally, the analysis of CSMA/CA
protocol for ZigBee networks is investigated in [17], taking
energy considerations into account. The evaluation of
MAC protocols in unsaturated conditions [18, 19] explores
the impact of sampling rates on collisions and throughput.
Several evaluations of MAC protocols are carried out by
simulations [20 - 22].
In [23] the analysis of interference in data collection
service is proposed and validated. Moreover, in [14, 15]
investigation on Radio Duty-Cycling protocols and
improvements are studied and proposed to enhance the
network performance using pipeline forwarding with
validation from simulations and experiments.
However, these research efforts lack a comparison with
the commonly used CSMA/CA protocol in real WSNs.
Furthermore, the exploration of the trade-off between node
2 Vo Que Son
adaptation and data traffic is notably absent. Therefore, this
paper employs a cross-layer design to evaluate WSN traffic
patterns, aiming to align with the traffic configuration of
operational WSNs. The proposed model seeks to analyze
the collision aspects of CSMA/CA protocols used in
WSNs, considering the configuration of tree routing and
periodic data transmission commonly employed in real-
world WSNs.
3. Proposed analytical model of collision probabilities
3.1. Tree routing
In the configuration of most WSN applications, a
network is formed with one or more root nodes (or sinks)
and numerous sensor nodes. The role of the root node is to
gather data packets from the sensor nodes. Currently, there
are two common approaches to routing in WSNs: proactive
and reactive. Reactive routing (e.g. TinyAODV) can reduce
the routing overhead by only requesting the path to the root
when it needs a path to send data packets to the root. In
contrast, proactive routing (which tree routing belongs to)
allows the root node to broadcast periodic beacons to signal
routing information from the root to the network,
establishing a collection tree. Tree routing updates the
topology faster if any frequent changes happen inside the
network (e.g. node may leave the network, node movement,
or link broken due to weak received signal strength).
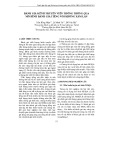
When receiving a beacon from a neighbor using tree
routing (Figure 1a), each node will update its local database
(e.g. neighbor management table) and then rebroadcast the
new beacon with updated local information to other
neighbors. Several parameters are exchanged between
nodes such as RSSI, LQI, and ETX [5, 8].
Figure 1. a) Principle of establishment of routing tree
b) Data collection using tree routing
Once the tree database is constructed, each sensing
node transmits its packets to the root (Figure 1b) via its best
neighbor node using multi-hop communication. The
relationship between beacon and data rates impacts
network performance. A higher beacon rate enables the
network to adapt well to network topology changes;
however, it may increase collisions and reduce the data
packet reception rate. Investigating the influence of these
factors can aid in optimizing network performance.
Furthermore, in tree routing, the exchange of beacons
occurs over time, regardless of whether nodes are
transmitting their data packets or not.
In this paper, the proposed model focuses on WSNs
using tree routing because this routing is the most popular
routing approach used in practical applications (CTP [5],
DSDV [6], RPL [8], Mint-Route [24], HYDRO [25]).
3.2. Assumptions
In this section, the collisions are now examined to
discover the influence on the data and routing traffic to
propose an analytical model for evaluation and comparison
of the contention in WSNs. In this model, each node
performs an initial backoff time before transmitting a
packet. If the node detects the radio channel is busy using
CCA, it immediately receives the packet (either a beacon
or data packet) and suspends its backoff timer. Once the
packet reception is complete, the node retains the
suspended backoff timer to re-enter the channel access
competition and send its packet. In addition, a fixed
window of CW slots is used to randomly select the backoff
period.
Theoretically, it is assumed that each contention slot 𝑖
within the CW slots can exist in one of three states:
• The collision during this slot 𝑖 is caused by the
backoff mechanism or the hidden node problem.
• When slot i is not chosen, this slot is considered as idle.
• Data is successfully transmitted in this slot i.
Thus, if Pc, Pi, and Pd respectively represent the
probabilities of slot i in each of the three states mentioned
above, it is evident that:
1
i c d
P P P+ + =
(1)
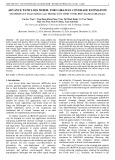
When the radio channel is identified as busy, each node
selects a backoff time within the range of [0, CW]. The CW
represents the backoff window (or contention window) in
CSMA, as illustrated in Figure 2.
Figure 2. Random backoff mechanism
3.3. Effective contention window
During the competition phase for radio channel access,
nodes can initiate backoff at different slots (as shown in
Figure 2); thus, the number of overlapping contention slots
between at least two nodes (which leads to collisions) may
be less than CW. This count of overlapping slots (referred
to as the random variable X) can vary anywhere within the
range of [0, CW], following a uniform distribution over the
observed time. The average of X represents the effective
contention window among nodes when their starting
backoff times differ. Gradually, the average of random
variable X will approach the effective contention window
CWeff. Therefore, given the uniform distribution of X within
the range [0, CW], the average number of overlapping
contention slots (or effective contention window) among
nodes can be approximated as follows:
ISSN 1859-1531 - THE UNIVERSITY OF DANANG - JOURNAL OF SCIENCE AND TECHNOLOGY, VOL. 22, NO. 12, 2024 3
00
1
( ) . ( ) . 2
CW CW
eff i i i
ii
CW
CW E x x P x x x CW
==
= = = =
(2)
To simplify the model, it is assumed that other nodes
compete for channel access within this effective collision
window. Figure 3 shows the effective collision window
estimation of overlapped slots with the contention window
(CW) of 32 slots.
At this point, each node must occupy one slot within
the effective contention window (having CWeff contention
slots). Since the effective contention window is fixed based
on formula (2), and the probability of selecting a slot within
it follows a uniform distribution, the probability of
successfully choosing one slot among the CWeff slots is
determined as
1/ eff
CW
. Furthermore, when each node has
(N-1) neighboring nodes, Pi represents the probability that
this slot is not occupied by any of the N nodes, as
determined by the following formula:
1
(1 - )N
i
eff
PCW
=
(3)
Similarly, the probability of successfully transmitting
data (Pd) occurs when a node selects a contention slot while
other nodes have different slots. Since data transmission
can occur with N nodes, this probability is determined
using the formula below:
-1 -1
1 1 1
.(1 - ) .(1 - )
NN
d
eff eff eff eff
N
N
PCW CW CW CW
==
(4)
From the equation system (1), (3), and (4), the
probability of collision Pc can be obtained.
Furthermore, in the commonly used CSMA/CA MAC
protocol [12, 13] which is usually used in practical design,
the backoff is determined by a backoff exponent (BE)
using the following: CW = (2BE -1) [26].
Figure 3. Convergence of effective contention window
3.4. Individual and mutual collision probabilities
It is important to note that collisions can occur with
both data and routing traffic (beacons). Additionally, both
beacons and data packets utilize the same frame in the
MAC layer. Therefore, the total collision probability Pc is
calculated as follows:
||
d b d b b d
c c c c c
P P P P P+ + + =
(5)
where:
-
d
c
P
and
b
c
P
are the individual collision probabilities
of only data and only beacon traffic respectively.
-
|db
c
P
is the mutual collision probability of data packets
caused by beacons transmission and
|bd
c
P
is the mutual
collision probability of beacons caused by data packets
transmission. However, beacon forwarding typically
occurs at the start of each beacon interval, while data
transmissions are distributed throughout the beacon period.
As a result, the mutual collision probabilities can be
ignored. Hence, (5) can be approximated to the following
formula:
db
c c c
P P P+=
(6)
In this approach, it is assumed that all nodes start to
transmit data frames with the given data period that is set
the same for all nodes. The model only considers all data
packets coming from neighbor nodes including the data
packets originating from neighbor nodes and the data
packets forwarded by neighbor nodes. Moreover, the
propagation delay can be neglected due to the high
propagation velocity and the distance between the 2 nodes
is tens of meters. Under these conditions, the distribution
of arrival data packets at each node can be assumed to have
a uniform distribution. However, in the analytical model,
the collision probability (Pc) is not determined directly; this
probability is calculated indirectly by determining the idle
probability (Pi) of a slot and the probability of successful
data transmission (Pd) and then using formula (1) to
determine the collision probability (Pc).
3.5. Relation between data rate, acknowledgment rate
and beacon rate
During a data period (inter-packet interval) of tipi, each
node averagely transmits 1 data packet and 1
acknowledgment (ACK) packet. The collision of data
packets is proportional to the rate 2/tipi (with 1/tipi for data
packet and 1/tipi for ACK) as the ACK is also processed
above the MAC layer. As a result, the ACK can be treated
as a data packet in terms of collision. Since the beacon
transmission does not require the ACK packet due to the
broadcast mechanism, therefore beacon collision is only
proportional to 1/tibi (where tibi is the inter-beacon interval).
Retransmissions are not included in this model, as a
retransmission can also be considered as a transmission of
the data packet.
However, in practice, the collisions are due to the
setting of the beacon period and data period. If any frame
is collided at the MAC layer, then the sending node cannot
receive the ACK frame. This activates the retransmission
mechanism to resend the collided frame (still in the
transmission buffer).
3.6. Beacon forwarding
Beacon transmission using broadcasting is typically
synchronous. When one node transmits a new beacon, N
neighboring nodes nearby forward this beacon after a short
delay (accounting for propagation and processing time).
This results in the number of beacon collisions being N times
greater than those occurring when transmitting a single data
packet (which is forwarded by only one neighboring node).
Combining this with the considerations in section 3.5, if
there are N contention nodes, the rate of collision
4 Vo Que Son
probabilities can be expressed by the following ratio:
. 1/
0
2/
b
c ibi
dipi
c
P N t
t
P
=
(7)
Based on equations (6) and (7), the collision
probabilities can be defined as follows:
.2
.
.
2
.
.
2
ipi
b
cc
ipi
ibi
dibi
cc
ipi
ibi
t
N
PP
t
tN
t
PP
t
tN
=
+
=
+
(8)
4. Simulation results and comparison
To examine the collisions discussed in the previous
section, a modified version of the Cooja simulator [27] has
been implemented to track the number of transmissions and
collisions for each node. As a result, the collision
probability can be calculated. A scenario is set up with N
nodes (where N ranges from 3 to 21) in a 100m x 100m
area, which typically represents the communication
distance of sensor nodes.
Each node in this network can communicate with (N-1)
other neighboring nodes. Consequently, the collision
probability can range from low to high levels. The beacon
period (tibi) and data period (tipi) are set to 8 seconds and 2
seconds, respectively, according to the routing protocol
mentioned in [8]. In the simulation, when a sensor node has
data to transmit, it initiates a random backoff. Following
this, the node must perform a Clear Channel Assessment
(CCA) to determine the state of the medium (idle or busy).
For easier evaluation and comparison, in both analysis and
simulation the maximum backoff time is set to the same
value as follows:
max
max
. .
slot backoff CCA unitBackoffPeriod CCA
CW T T T k T T= + = +
(9)
in which:
- CW: 32 slots in the contention window [16].
- TunitBackoffPeriod: 16 µs, duration of a symbol [28].
- Tslot: 16µs, duration of one slot.
-
max
backoff
T
: the maximum backoff time.
- TCCA: 128µs, duration of CCA phase of which is 8
times of Tslot [28].
- k: a random integer with a uniform distribution. This
value is selected for backoff time in the simulation and falls
within the range [kmin, kmax]. This range is derived from the
above equation and is utilized in the simulation.
For comparison with the proposed analytical model,
with the given CW, data period, beacon period, and the
network running time (which is equal to the simulation
time) the collision probabilities Pi, Pd, and Pc are calculated
from formulas (1), (3), (4) then using formula (8) to
determine and .
In the simulation, there are 2 types of traffic: routing
(beacons) and data packets. The routing protocol is always
running to keep the topology updated over time. The
routing and the data traffic levels can be configured as the
parameter beacon period and data period respectively.
Hence, two scenarios are simulated to determine collision
probabilities as follows:
- If nodes do not send any data packets (by turning off
the data transmission service inside each node), the
collisions happen only due to beacons (routing). In this
case, the collision probability caused by only beacon-
beacon can be determined.
- If nodes are turned on with data packet transmission,
inside the network there are several types of collision:
beacon-beacon, data packet-data packet, and beacon-data
packet. In this case, the mutual collision probabilities can
be measured.
From measurement in the 2 above scenarios, the
independent and mutual collision probabilities can be
calculated and compared with the analytical model’s results.
Figure 4. Collision probability versus the number of
neighboring nodes. The beacon and periods are set to 8 seconds
and 2 seconds respectively
In Figure 4, the simulation results and analysis of
collision probability in relation to the number of
neighboring nodes are presented. It is evident that if a node
has more neighboring nodes, the collision probability
increases due to higher collisions for transmitted beacons
and data packets. However, when the number of
neighboring nodes is less than 8, the collision probability
remains rather low (below 0.065). This figure also
illustrates that the analytical model aligns closely with the
simulation results because it considers various practical
factors such as synchronous beacon forwarding,
overlapping slots, and acknowledgments. This finding
supports a practical recommendation that the design of
network size in multi-hop sensor networks can help reduce
collisions.
To measure the collisions caused by beacons only, in
this scenario, all nodes are configured to stop their data
transmissions while only the routing protocol remains
running. Subsequently, the collision probability of data
packets can be calculated by subtracting the beacon
collisions from the total collisions, as mutual collisions
between beacons and data packets are neglected using (6).
Figure 5 illustrates the individual collision probabilities for
beacons and data packets, showing that the results from the
simulation and analysis align closely. As the number of
d
c
P
b
c
P
ISSN 1859-1531 - THE UNIVERSITY OF DANANG - JOURNAL OF SCIENCE AND TECHNOLOGY, VOL. 22, NO. 12, 2024 5
contention nodes increases, both the collision probabilities
for beacons and data packets also rise. In scenarios with a
high node density, the total collision probability for routing
(beacons) and data packet transmission is approximately
0.31 and 0.12, respectively, when there are 20 neighboring
nodes.
The figure also shows that the collision probability of
beacons increases at a faster rate than that of data packets
in both the simulation and analysis. This is attributed to
the synchronous beacon forwarding of the tree routing
protocol. In scenarios with more crowded contention
nodes, the collision probability observed in the simulation
is slightly higher than that in the analysis, due to mutual
collisions and the number of retransmissions, which are
not considered in the analysis. Another factor
contributing to the discrepancy between the simulation
and analysis results is the CCA, which is not included in
the analysis because it is relatively small (only 16 µs)
compared to the beacon and data periods (which span
several seconds).
Figure 5. Individual collision probabilities of
beacons and data packets
To assess the influence of data and beacon traffic on
collision probability within the network, sensor nodes are
set up with variable data periods and beacon periods to
represent levels of data and routing traffic load. Figure 6
illustrates the simulation results, revealing that the overall
average collision probability in the network reaches
approximately 0.17 under high traffic conditions (with data
and beacon periods set at 8 and 2 seconds, respectively).
Conversely, when the traffic load is low (data or beacon
period set at 60 seconds), the collision probability is
significantly reduced.
Additionally, the findings depicted in this figure
provide further evidence of a close alignment between
simulation outcomes and analytical results. In real
deployment of WSNs, the data period is typically
configured to span several minutes, particularly in
monitoring applications, resulting in a very low collision
probability with this setup. The selection of the beacon
period is influenced by the nodes' need to adapt to network
changes either rapidly or gradually. In many widely
employed routing protocols [5, 8] for IoT applications, the
beacon period is typically set to 8 seconds if the adaptive
beaconing mechanism [16] is not utilized, proving enough
flexibility for most wireless sensing applications.
Figure 6. Collision probability versus beacon and data period
5. Conclusion and outlooks
The presented analytical model aims to provide a more
accurate analysis of collision probabilities for beacons of
routing information and data packets, considering several
factors such as synchronous beacon forwarding, data rate,
and ACK packet rate. The validation analysis indicates a
close match between the proposed model and simulation
results, specifically in terms of individual collision
probabilities for data packets and beacons.
In future work, the exploration of mutual collision
probabilities between beacons and data packets will be
conducted, incorporating an adaptive beaconing
forwarding mechanism.
Acknowledgement: We acknowledge the support of time
and facilities from Ho Chi Minh City of Technology
(HCMUT), VNU-HCM for this study.
REFERENCES
[1] N. Xu, X. Zhang, Q. Wang, J. Liang, G. Pan, and M. Zhang, “An
Improved Flooding Time Synchronization Protocol for Industrial
Wireless Networks”, in Proc. of 2009 International Conference on
Embedded Software and Systems, Hangzhou, China, 2009, pp. 524-529.
[2] S. Ganeriwal, R. Kumar, and M. B. Srivastava, “Timing-sync
protocol for sensor networks,” in Proc. Of the 1st international
conference on Embedded networked sensor systems, New York, NY,
USA, 2003, pp. 138–149.
[3] W. Son, J. Choi, S. Park, H. Lee, and B. C. Jung, “A Time
Synchronization Protocol for Barrage Relay Networks”, Journal
Application of Semantic Technologies in Sensors and Sensing
Systems (Special issue), MDPI, vol 23, isssue 5, 2023,
https://doi.org/10.3390/s23052447
[4] V. Zibakalam, “A New TDMA Scheduling Algorithm for Data
Collection over Tree-Based Routing in Wireless Sensor Networks”,
International Scholarly Research Notices, 2012,
https://doi.org/10.5402/2012/864694
[5] O. Gnawali, R. Fonseca, K. Jamieson, D. Moss, and P. Levis. “CTP
– Collection Tree Protocol”, in Proc. of the 7th ACM Conference on
Embedded Networked Sensor Systems, 2009, pp. 1-14.
[6] S. Nithya, G. Arul Kumar, and P. Adhavan, “Destination-sequenced
distance vector routing (DSDV) using clustering approach in mobile
ad hoc network”, in Proc. of 2012 International Conference on
Radar, Communication and Computing (ICRCC), 2012,
Tiruvannamalai, India, pp. 319-323.
[7] D. Johnson and D. Maltz, “Dynamic source routing in ad hoc
wireless networks”. Mobile Computing Journal, Kluwer Academic
Publishers, 1996, pp. 153–181, https://doi.org/10.1007/978-0-585-
29603-6_5
[8] N. Hassanzade, “Scalable Data Collection for Mobile Wireless
Sensor Networks”, Master Thesis, SICS, KTH, 2011.