
Hindawi Publishing Corporation
EURASIP Journal on Applied Signal Processing
Volume 2006, Article ID 45684, Pages 1–13
DOI 10.1155/ASP/2006/45684
Recovery and Visualization of 3D Structure of Chromosomes
from Tomographic Reconstruction Images
Sabarish Babu,1Pao-Chuan Liao,1Min C. Shin,1and Leonid V. Tsap2
1Department of Computer Science, University of North Carolina at Charlotte, 9201 University City Boulevard,
Charlotte, NC 28223, USA
2Systems Research Group, Electronics Engineering Department, University of California Lawrence Livermore National Laboratory,
Livermore, CA 94551, USA
Received 27 April 2005; Revised 12 October 2005; Accepted 21 December 2005
The objectives of this work include automatic recovery and visualization of a 3D chromosome structure from a sequence of 2D
tomographic reconstruction images taken through the nucleus of a cell. Structure is very important for biologists as it affects chro-
mosome functions, behavior of the cell, and its state. Analysis of chromosome structure is significant in the detection of diseases,
identification of chromosomal abnormalities, study of DNA structural conformation, in-depth study of chromosomal surface
morphology, observation of in vivo behavior of the chromosomes over time, and in monitoring environmental gene mutations.
The methodology incorporates thresholding based on a histogram analysis with a polyline splitting algorithm, contour extraction
via active contours, and detection of the 3D chromosome structure by establishing corresponding regions throughout the slices.
Visualization using point cloud meshing generates a 3D surface. The 3D triangular mesh of the chromosomes provides surface
detail and allows a user to interactively analyze chromosomes using visualization software.
Copyright © 2006 Hindawi Publishing Corporation. All rights reserved.
1. INTRODUCTION
1.1. Motivation
Tracking and visualizing chromosomes gives biologists valu-
able information regarding their three-dimensional (3D)
structure and behavior. Previously, segmentation of banded
chromosomes frozen in metaphase of mitosis was important
for classification especially in the karyotyping process. This
process facilitates the classification and detection of chro-
mosomal abnormalities such as Klinefelter’s, Down’s, and
Turner’s syndrome. Chromosome analysis is important in
such situations as prenatal amniocentesis examination, de-
tection of malignant diseases, and monitoring environmen-
talgenemutations.
In this paper, we propose a new method for (1) an au-
tomatic recovery of chromosomes in a sequence of 2D flu-
orescence volume image slices, and (2) visualizing the re-
sulting chromosomes in 3D. Such 3D visualization provides
biologists with information that cannot be obtained by 2D
images alone. Commonly used imaging systems rely on re-
construction of an image from its projections through the
process of computed tomography (CT) which generates flu-
orescent optical sections also known as volume image slices.
In medical imaging, for example, X-ray plates, CT scans,
magnetic resonance imaging (MRI), and various types of
positron emission tomography (PET) all record 2D projec-
tions of 3D objects [1]. Hence, tracking the contour of an
object along each successive slice allows us to recreate a 3D
representation of the object. We see that 3D visualization of
the chromosome can be useful for biologists in the follow-
ing ways: (1) identifying the space occupied by the chro-
mosome within the cell, (2) visualizing specific structures
along the contour such as “constrict points,” and binding
sites with other intercellular molecules such as proteins (i.e.,
matrix-binding proteins which anchor the chromosome to
the nucleus), enzymes, and other organelles, (3) using the
visualization to accurately classify the chromosomes, (4) de-
tecting anomalies, such as chromosomal disorders, (5) help-
ing to identify and observe the behavior of the organelle
over time (sometimes called 4D reconstruction, with time
as the fourth dimension), especially during cellular expres-
sion and replication, (6) analysing genomic mutations such
as deletions and inversions, and (7) studying DNA confor-
mation (packaging) within the chromosome including the
presence of DNA structural motifs, understanding how con-
formation is affected over time, and gene expression pat-
terns.

2 EURASIP Journal on Applied Signal Processing
1.2. Previous work
Previous research of chromosomes in 2D images was pri-
marily focused on abnormality detection and classification of
chromosomes. In chromosome classification (Karyotyping),
one of the main efforts includes the problem of separation of
partially occluded chromosomes. Lerner et al. [2] proposed
classification based on skeleton points, and local feature ex-
traction for classification purposes (CPOOS—classification-
driven partially occluded object segmentation method). Shi
et al. also used local features such as cut points, skeleton
points, junction points, and ravine points to separate touch-
ing chromosomes using parallel mesh algorithm [3]. Some of
the local features extracted were based on topology, such as
concavities, that indicated where occlusions between chro-
mosomes occurred. Hence, their separation and classifica-
tion were based on landmarks and occlusion points. Lerner
et al. [4] trained multilayer perceptron (MLP) neural net-
works to classify chromosomes and used a “knockout” tech-
nique as well as principle component analysis (PCA) for fea-
ture selection. Both techniques yielded the benefit of using
only about 70% of the available features to get the most
out of classifier performance. Vidal and Castro used syntac-
tic/structural pattern recognition algorithms such as error-
correcting grammatical interface (ECGI) and MLP to classify
chromosomes by formulating rule-based string representa-
tion of the features extracted [5]. Keller et al. presented a
fuzzy logic system in addition to neural network-based clas-
sification system to deal with ambiguities during the classi-
fication process. These ambiguities included imprecisions in
computation, and in-class definitions in mid-level computer
vision processes [6]. Minor chromosomal abnormalities can-
not be detected by applying available techniques to 2D im-
ages. Based on banding patterns and skeletal line lengths,
only major chromosomal abnormalities, such as deletions,
can be detected. Inversion abnormalities may cause problems
in information extraction for the formulation of rules in the
syntactic/structural methods. However, 3D visualization en-
ables scientists to discern occluding chromosomes for fur-
ther classification better than 2D image analysis. Imelinska
et al. proposed a semiautomatic region-based color segmen-
tation algorithm to extract anatomic structures. Their basic
approach included subdividing an image into regions inside
or outside the target structure using Delaney triangulation,
and then breaking up the regions on the boundary between
the two classifications into smaller regions, and finally re-
peating the classification based on user input [7]. Holden
et al. proposed a methodology for segmentation of brain le-
sions from MR images. Their segmentation algorithm con-
sisted of contour detection followed by Haslett’s contextual
classification method extended to 3D [8]. Yan et al. described
a semiautomatic method for segmentation of lymph nodes
in CT images using the level set method [9]. Noordmans and
Smeulders proposed a strategy that detects and characterizes
isolated and overlapping spots in images, where spots are de-
fined as image details without inner structure [10]. To apply
the strategy to our domain, one would have to define a sub-
stantial, nontrivial set of spot models to suit our image data.
The proposed method requires a seed point and a circle to
define an approximate region of interest for the level set oper-
ator to work on segmenting the biological object. Our region
segmentation step employed within our automatic method-
ology uses polyline splitting algorithm to model the his-
togram contour, and was designed to simply and efficiently
identify slices that could consist of regions corresponding to
foreground chromosome and to subsequently select the ap-
propriate threshold for region segmentation automatically.
There have also been several papers published on visu-
alization and 3D reconstruction of large and small biolog-
ical objects based on various imaging modalities. Volume
rendering is the process of generating a 3D organ from 2D
image slices. There are two methods of volume visualiza-
tion: surface rendering which requires a preprocessing seg-
mentation procedure and volume rendering where the re-
constructed organ is directly generated from the original im-
age slices. Although rendering effects of volume rendering
provides the greatest amount of detail, volume rendering is
slow. Surface rendering allows for easier manipulation and
interaction with the biological object in 3D [11]. For some
types of biological visualization, very high-resolution details
of the surface structure may not be necessary. In the case of
chromosome structural analysis, biologists are looking for
a method of detecting abnormalities and other higher-level
surface artifacts which do not require very detailed visual-
izations, hence in this case medium-resolution surface ren-
dering would be sufficient. Chemical analysis of the DNA
within the chromosome can reveal small-scale abnormali-
ties and inconsistencies better. The visible human project of
the National Library of Medicine used transverse CT, MR,
and cryosection images of representative male and female ca-
davers to obtain 3D human body representations [12]. The
cryosection images, used for full body visualization, were
taken at regular intervals, the male was sectioned at one-
millimeter intervals, and the female at one-third of a mil-
limeter intervals. Subramanian et al. used intravascular ul-
trasound (IVUS) images, which is a technology for imaging
the vascular lumen and atherosclerotic plague structure, and
devised a technique to accurately reconstruct 3D geometry
of blood vessels [13]. Various imaging modalities were also
employed in 3D reconstruction such as biplane X-ray fluo-
roscopy, X-ray, and echo images. The path of the catheter
tip was estimated by fitting an interpolating spline through
the 3D points. Arnison et al. presented a modality called dif-
ferential interference contrast (DIC) microscopy and applied
Hilbert transforms to distinguish features of chromosomes
from background in each 2D slice, and selective opacity to
3D pixels (voxels) according to their intensity to visualize
chromosomes [14]. Engelhardt et al. visualized metaphase
chromosome from human (HeLa) cell lines using electron
microscopy (EM) [15]. The images were aligned using col-
loidal gold particles as reference points, and reconstruction
was produced by the weighted back-projection method. Liu
et al. proposed a methodology to visualize and quantify brain
tumor lesions from MRI volumetric images towards routine
clinical evaluation of brain tumor patients [16]. They used
a fuzzy connectedness framework for tumor segmentation,

Sabarish Babu et al. 3
which requires some user intervention, towards detecting the
tumor regions in 3D. Zoroofi et al. provided an automatic
methodology for segmentation and 3D visualization of the
diseased femoral head from 3D MR volumetric data [17].
Both segmentation of the femur and necrotic lesion classi-
fication were done in 3D. Viergever et al. have used an inte-
grated multimodal approach towards segmentation, integra-
tion, and visualization of brain slices [18]. The volumetric
data was acquired and integrated from CT, MRI, and SPECT
input modalities. Qingsong et al. proposed a visualization
approach that used surface as well as volume rendering tech-
niques to visualize the human head towards surgical plan-
ning applications [11]. Since either integrating volume ren-
dering methods or integrating volumetric data from several
modalities can be slow, there have been efforts in rendering
real-time visualizations of biological organs using commer-
cial graphics hardware. For example, Levin et al. proposed
a method of real-time visualization of a 4D volume visual-
ization of a beating heart using the graphics processing unit
[19].
Most techniques for the segmentation and visualization
of 3D biological structures have been proposed for large bi-
ological organelles such as brain, heart, and bone tissues.
Methods for the segmentation and 3D recovery of small
intracellular organelles such as chromosomes, mitochon-
dria, and endoplasmic reticulum are challenging to develop
as these biological organelles are extremely small, and im-
ages containing volumetric data of such organelles consist of
higher levels of noise. Until recently computer tomography
(CT), which has been regarded as a fastest, most-detailed,
and highest-resolution detection technology for in vivo bio-
logicalstructures,wasunabletodetectandproducevolumet-
ric data of very small objects such as intracellular structures.
With the advent of new and improved techniques in com-
puter tomography, it now becomes possible to quickly and
accurately reconstruct 2D volumetric slices of minute struc-
tures such as intracellular organelles in their native state [20].
Our work focuses on a methodology for automatic recovery
and visualization of chromosomes in tomographic recon-
struction (CT) volume image slices. Our visualization ap-
proach also employs surface rendering as opposed to volume
rendering as surface geometry is reconstructed from the im-
age data. Our methodology can also be extended to recover
and visualize other intracellular organelles such as mitochon-
dria and human chromosomes, which are also of great inter-
est to biologists when such data becomes available. In fol-
lowing sections, we explain in detail the various steps of our
methodology and show results of the visualizations of the re-
constructed Drosophila chromosomes.
2. METHODOLOGY
2.1. Overview of the approach
The objective of our research is to track the contour of chro-
mosomes in a sequence of tomographic reconstruction im-
ages, thus enabling us to recover the chromosome object
and to provide visualization. Images generated through to-
mographic fluorescence data are a form of commonly used
fluorescence-based technique to generate medical volume
image slices. The dataset was generated in the Sedat Lab at
the University of California San Francisco [20]. The slices
are grayscale images of two chromosomes of the common
fruit fly (Drosophila melanogaster). The slices progress along
a plane of capture, and total sixty-five slice images at 478 ×
512 resolution. The images consist of relatively high contrast
and each slice is contaminated with many reconstruction ar-
tifacts.
Our proposed methodology consists of five stages.
(1) Segmentation of the chromosome regions in each 2D
image slice is performed by image thresholding. The
threshold is automatically selected by analyzing the
histogram contour using a polyline splitting algorithm
[21].
(2) Noise removal is achieved by connected component la-
beling (CCL) [21] to filter out foreground regions be-
low a certain size.
(3) Two-dimensional contour refinement on each slice is
performed on the contour of the chromosome regions
extracted after step 2. This step employs an active con-
tour model (snake) technique [22].
(4) Region correspondence is performed by correspond-
ing the 2D regions of the same chromosome in adja-
cent slices. We use a region comparison method pro-
posed by Hoover et al. [23] to correspond regions of
the same chromosome between slices. This method
achieves correspondence even when the chromosome
breaks into multiple regions in some slices.
(5) Visualization of the chromosome in 3D consists of two
steps. Initially, we extract a set of nodes from the con-
tour of a single chromosome in each slice using chain-
coding algorithm [21].Thissetistakenforeachchro-
mosome, to create point clouds. Then, using meshing
technique [24], we construct a mesh representing the
surface of each chromosome.
These steps are described in separate sections in this paper.
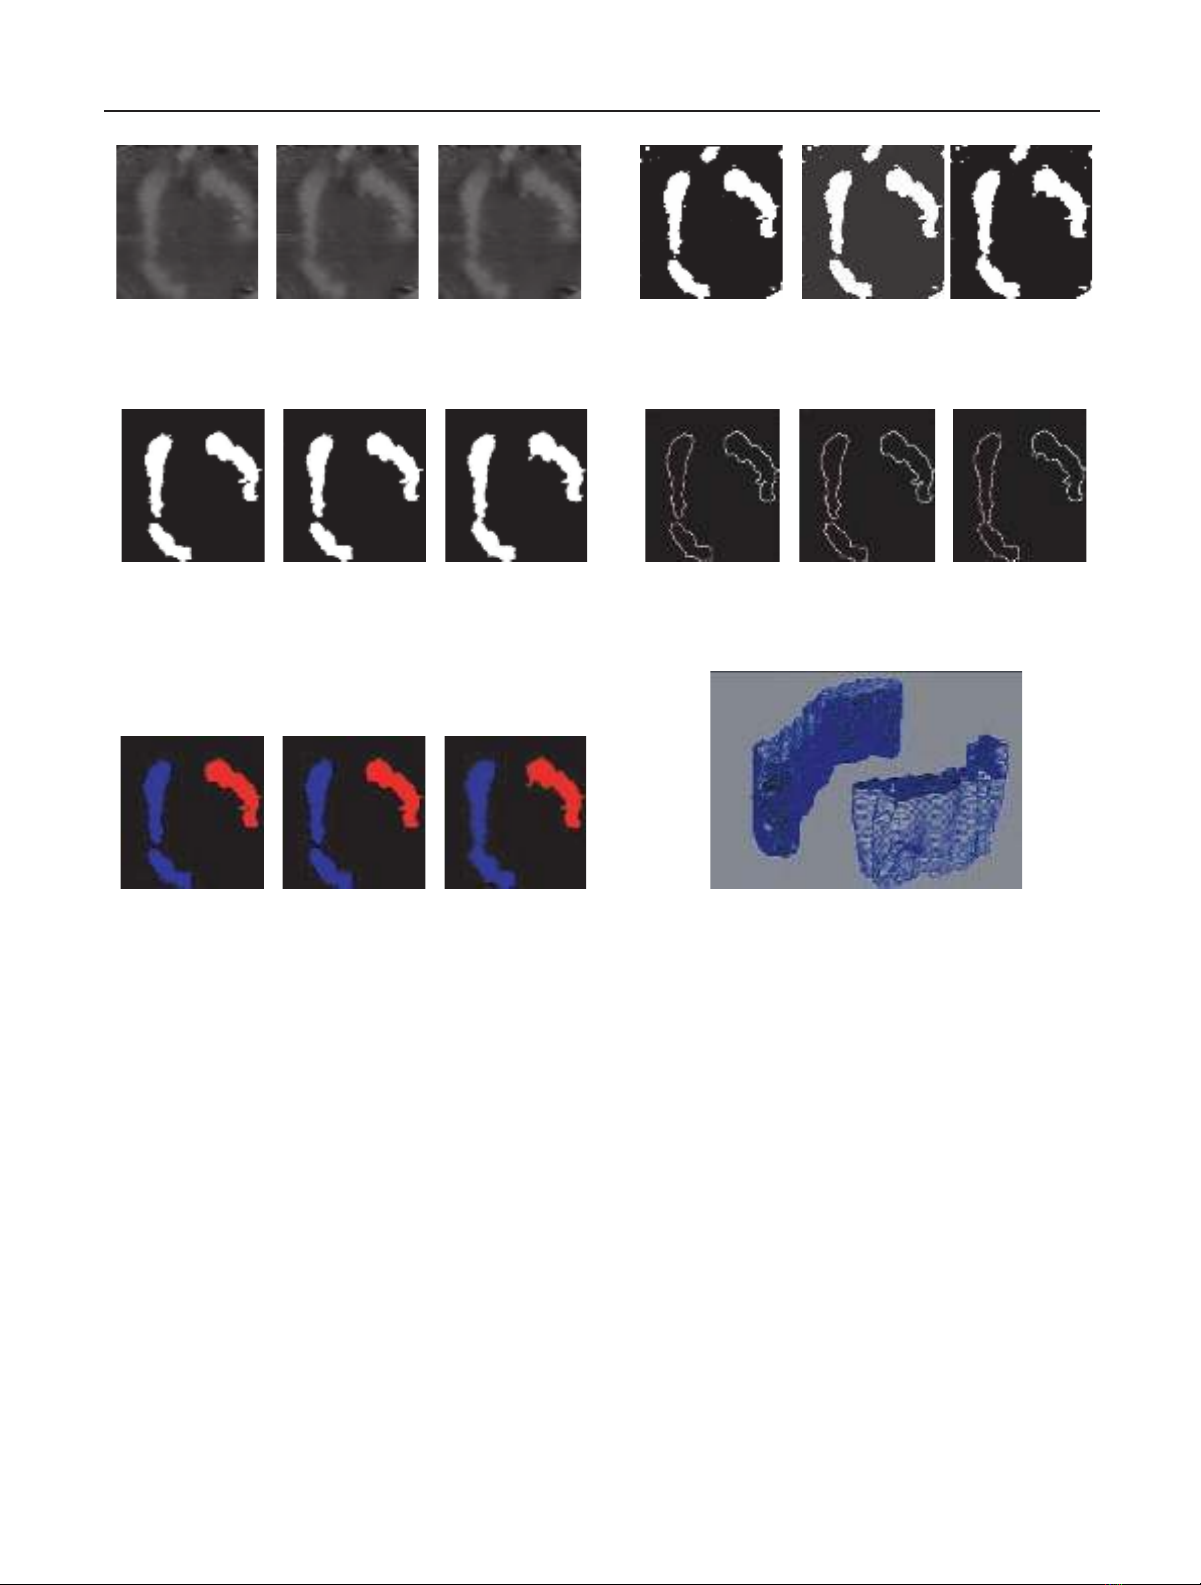
Figure 1 illustrates the flow chart of our methodology, show-
ing sample output images from each step described above.
2.2. Dataset
Various imaging systems rely on reconstruction of an image
from its projections through the process of computed tomog-
raphy (CT). In medical imaging, for example, X-ray plates,
CT scans, magnetic resonance imaging (MRI), and various
types of positron emission tomography (PET) all record 2D
projections of 3D objects [1]. Our dataset consists of tomo-
graphic reconstruction of chromosome volume image sli-
ces through the cell of a fruit fly (Drosophila melanogaster).
There are a total of 65 images representing slices taken along
a plane of capture. Most medical imaging systems separately
reconstruct 2D slices of a 3D object. Those slices closest to
Slice 1 are more indistinct, consisting primarily of back-
ground. Some of the slices, in particular ones closer to the
end of the sequence, contain significant noise, which makes
the task of chromosome segmentation more difficult.
4 EURASIP Journal on Applied Signal Processing
(a) Input images: the three sample input images on the right are
from the set of tomographic reconstruction volume images. The to-
tal number of slices is 65, and is greyscale. From left to right, the
image samples are slice number 23, 24, and 25, respectively
(b) Region segmentation: sample binary images from left to right
are output images after region segmentation has been performed
(c) Noise removal: images on the right show the result of noise re-
moval performed on the output images of region segmentation
(d) 2D contour refinement: using the resulting contour as an
initial estimate, we apply active contour models (snakes) [22]to
refine it. Image on the right shows the refined contour of chro-
mosome 1 (left) in slices 23, 24, and 25, respectively
(e) Region correspondence: finding respective chromosomes in ad-
jacent slides yields regions on left corresponded to chromosome 1
and right to chromosome 2
(f) Visualization: points along the refined contour correspond-
ing to each chromosome (nodes) are extracted to obtain point
clouds. Meshing technique [24] is applied to the point clouds to
obtain the mesh describing the surface of the chromosome
Figure 1: Flow chart of the methodology showing sample input images, and output images corresponding to steps outline in the left column.
3. REGION SEGMENTATION AND NOISE REMOVAL
3.1. Overview
The goal of this step is to create a methodology that allows
us to detect the presence of foreground regions that may
consist of chromosomes, and to segment chromosome re-
gion from its background in each 2D slice, through auto-
matic selection of an appropriate threshold for segmenta-
tion. In this step, we also remove slices for which suitable
thresholds could not be determined since those slices only
contain background. The histograms of the slices are either
unimodal or multimodal. The histograms of the top-end and
bottom-end slices are unimodal, as those slices contain back-
ground only. The histograms of the middle slices, however,
are multimodal. To perform thresholding and subsequently
segment chromosomes from the background successfully, we
must establish that the histograms of the slices are multi-
modal.
Segmentation of many clinical and biological images is
currently performed using manual slice editing [25]. This
method has some deficiencies, such as difficulty in achiev-
ing reproducible results, operator bias, and it is tedious
to perform. Segmentation using techniques, such as region
growing, edge detection, and mathematical morphology op-
erations, mostly requires considerable amounts of expert
interactive guidance because some knowledge of the domain
(the content of images) is necessary. Hence, automatic seg-
mentation with little to no human intervention would be
preferred. Otsu’s method of thresholding (recommended by
Shi et al. [3]), based on minimizing intragroup variance
and maximizing intergroup variance, is not applicable to
this dataset. These algorithms assume that the histogram
is bimodal and demonstrates essentially two distributions.
Sabarish Babu et al. 5
Hence, we seek an automatic method that analyses the his-
togram contour of each slice to determine whether it is uni-
modal or multimodal, excludes unimodal slices, and selects
an appropriate threshold for segmentation. Wilcoxon’s rank-
sum test [26], which is similar to a paired T-test for nonpara-
metric data, could also be used as a criterion for determining
whether the foreground is significantly different from back-
ground from two sets of data. Our segmentation step differs
from previous methods by automatically processing in single
step, excluding slices that do not contain chromosome and
finding the appropriate threshold for segmentation by sim-
ply and effectively analyzing the histogram contour.
Applying polyline splitting to model the contour of the
histogram enables us to determine whether the histogram is
unimodal or multimodal, subsequently excluding slices with
a unimodal histogram. This method also provides a basis
for threshold selection through a reasonable measure such
as the peakiness method [21], which will be described in the
following section. Details of the polyline splitting algorithm
can be found in [21]. By using the polyline splitting algo-
rithm on a histogram contour, we can find the list of edges
with vertices end to end that describes the histogram curve
by recursively splitting it into line segments.
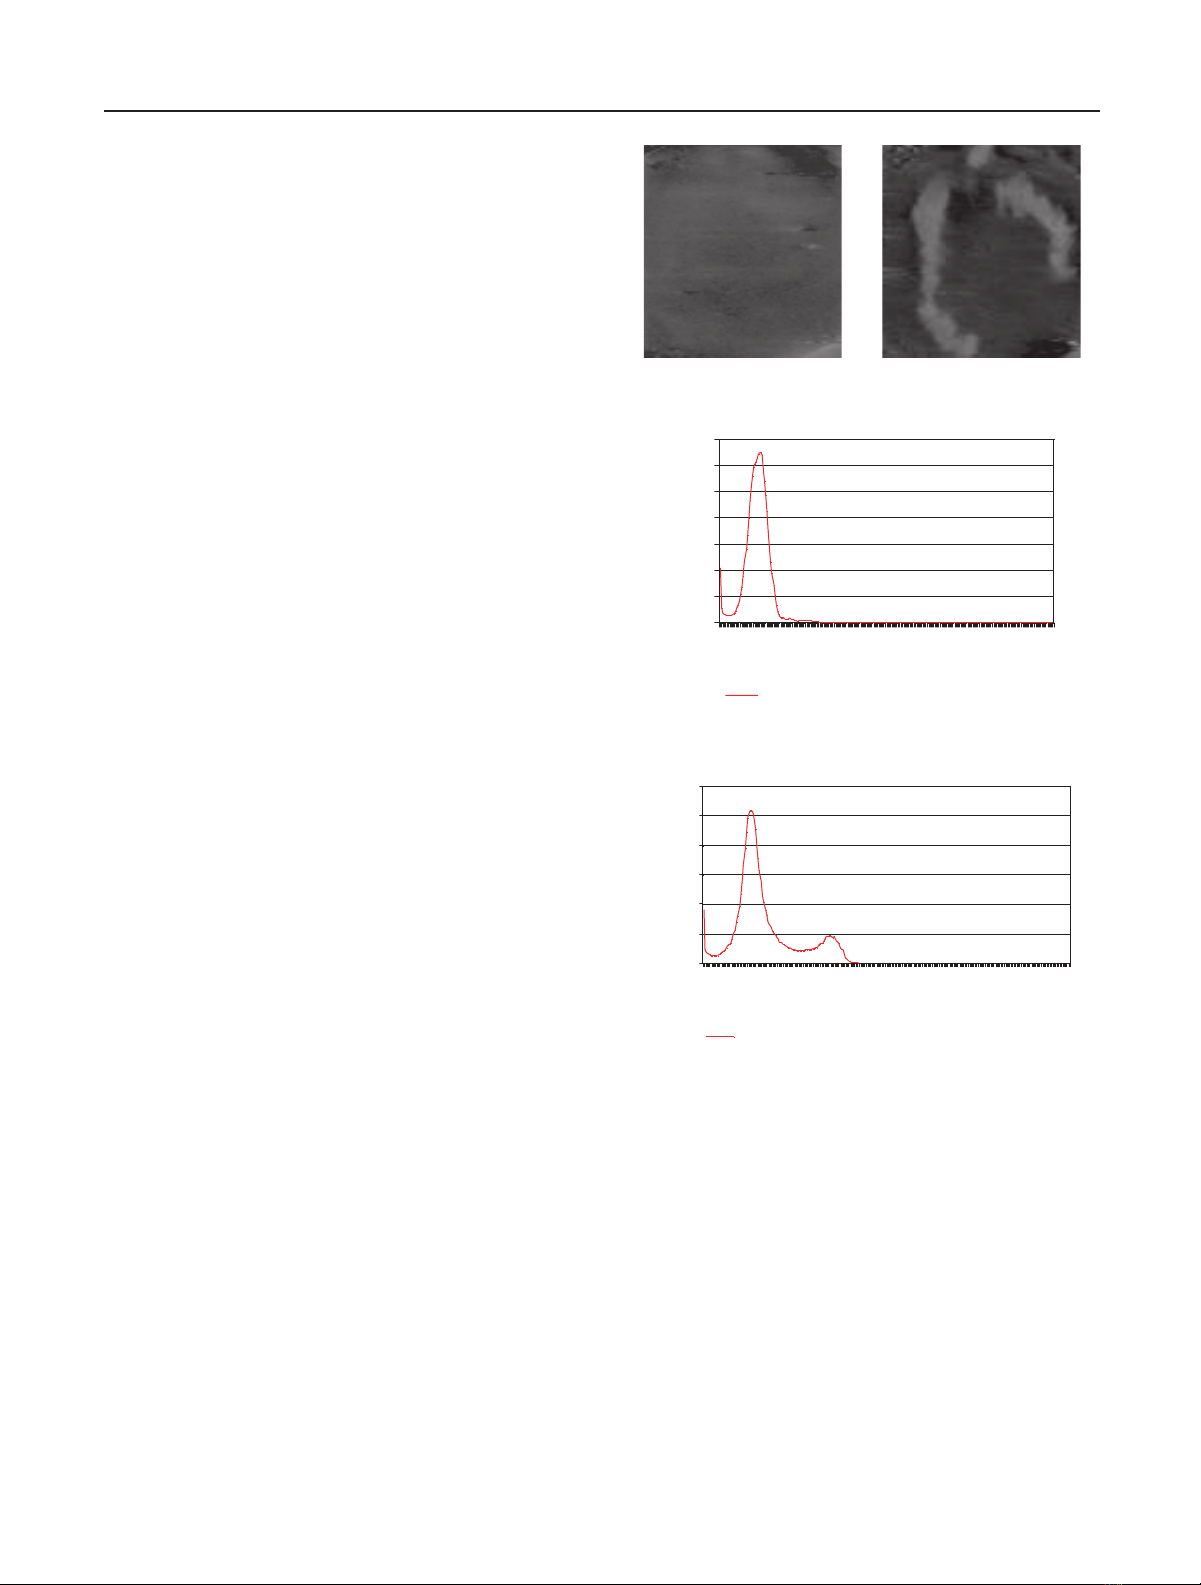
Slice 2 (Figure 2(a)), one of the top-end slices, is uni-
modal (Figure 2(c)) and it is therefore very difficult to dis-
tinguish foreground from background. In contrast, slice 35
(Figure 2(b)), one of the images from the middle slices, is bi-
modal (Figure 2(d)). Hence, it is possible to extract the chro-
mosome from background using region segmentation.
3.2. Description of the process
The goal of this step is to robustly segment chromosome re-
gions by (1) determining whether the image contains any
chromosome and (2) finding the correct threshold even
when the histogram of image contains multiple modalities.
The polyline splitting algorithm is used to analyze the con-
tour of the histogram [21]. It iteratively divides a curve
into a set of line segments denoted by a set of vertices (see
Figure 3). If we detect no local minima between two local
maxima in an image slice, we determine that the histogram
of the image is unimodal; thus the image does not contain
any chromosomes (see Figure 3(a)). When a local minima
is detected, we find the threshold by finding the local min-
ima (k) with the highest peakiness [21]. The peakiness is
min(H(i), H( j))/H(k), where iand jare the intensity values
of the neighboring local maxima and H(x) is the histogram
value at the intensity of x.
3.3. Results of region segmentation
In Figure 3, no local minima is present on the histogram
for slice 9 (Figure 3(a)), while one local maxima is found
at intensity 37 corresponding to background as annotated
in Figure 3, thus indicating that the histogram for slice 9
is unimodal. After applying polyline splitting to the his-
togram contour of the entire sequence, slices with uni-
modal histogram are excluded from the subsequent processes
(a) Slice 2 (b) Slice 35
0
2
4
6
8
10
12
14
×103
Frequency
1 24 47 70 93 116 139 162 185 208 231 254
Intensity
Histogram
(c) Histogram of slice 2
0
2
4
6
8
10
12
×103
Frequency
1 19 37 55 73 91 109 127 145 163 181 199 217 235 253
Intensity
Histogram
(d) Histogram of slice 35
Figure 2: (a) Slice 2 is one of the earlier slices of the CT scan im-
ages with a unimodal histogram distribution of intensity. (c) The
histogram for slice 2. (b) Slice 35 is one of the middle slices with a
bimodal histogram distribution of intensity suitable for threshold-
ing. (d) The histogram for slice 35.
performed for visualization. They include slices 1 through 6,
9, 13 through 22, and 54 through 65.
Figure 3(b) shows local maxima 1 and local maxima 2
found with a local minima containing the highest peakiness
value in between these two local maxima. The intensity of
this local minima is selected, and this value is used for re-
gion segmentation throughout the process of thresholding.
A polyline distance threshold value of 25 enables proper dis-
tribution of vertices in the polyline, giving rise to a single
minima vertex placed in between two local maxima vertices.


%20--%3e%3cdefs%3e%3cstyle%3e%20.st0%20{%20fill:%20%23fff;%20}%20.st1%20{%20fill:%20%237800fa;%20}%20%3c/style%3e%3c/defs%3e%3cpath%20class='st1'%20d='M117.78,12.18H43.11c2.9,3.47,4.65,7.94,4.65,12.82,0,5.6-2.3,10.66-6.01,14.29h76.02l7.22-13.56-7.22-13.56Z'/%3e%3cg%3e%3cpath%20class='st0'%20d='M53.58,26.17h-.59v-1.46h.59v-4.96h2.83c1.78,0,2.67.94,2.67,2.82v5.76c0,1.87-.89,2.81-2.67,2.81h-2.83v-4.96ZM55.36,21.37v3.34h1.1v1.46h-1.1v3.34h1.01c.61,0,.91-.37.91-1.1v-5.93c0-.74-.3-1.1-.91-1.1h-1.01Z'/%3e%3cpath%20class='st0'%20d='M65.99,31.14h-1.8l-.31-2.07h-2.19l-.31,2.07h-1.64l1.82-11.39h2.62l1.82,11.39ZM65.28,18.04c-.25.46-.51.77-.75.94-.21.15-.47.22-.79.22-.26,0-.57-.07-.92-.22l-.38-.15c-.14-.05-.26-.07-.37-.07-.3,0-.53.18-.71.54l-.91-.68c.25-.46.51-.77.75-.94.21-.14.48-.21.79-.21.26,0,.57.07.92.21l.38.15c.14.05.26.07.37.07.3,0,.53-.18.71-.54l.91.68ZM61.91,27.52h1.73l-.87-5.76-.87,5.76Z'/%3e%3cpath%20class='st0'%20d='M74.53,26.89v1.52c0,1.91-.89,2.86-2.67,2.86s-2.67-.95-2.67-2.86v-5.93c0-1.91.89-2.86,2.67-2.86s2.67.95,2.67,2.86v1.11h-1.69v-1.22c0-.75-.31-1.12-.93-1.12s-.93.37-.93,1.12v6.15c0,.74.31,1.11.93,1.11s.93-.37.93-1.11v-1.63h1.69Z'/%3e%3cpath%20class='st0'%20d='M81.4,31.14h-1.8l-.31-2.07h-2.19l-.31,2.07h-1.64l1.82-11.39h2.62l1.82,11.39ZM75.9,19.2l1.52-1.91h1.71l1.51,1.91h-1.61l-.76-.95-.75.95h-1.61ZM77.32,27.52h1.73l-.87-5.76-.87,5.76ZM83.1,15.99l-1.76,1.91h-1.26l1.17-1.91h1.86Z'/%3e%3cpath%20class='st0'%20d='M84.86,19.75c1.78,0,2.67.94,2.67,2.82v1.48c0,1.87-.89,2.81-2.67,2.81h-.85v4.28h-1.79v-11.39h2.64ZM84.01,21.37v3.86h.85c.58,0,.87-.36.87-1.08v-1.71c0-.71-.29-1.07-.87-1.07h-.85Z'/%3e%3cpath%20class='st0'%20d='M93.51,19.75c1.78,0,2.67.94,2.67,2.82v1.48c0,1.87-.89,2.81-2.67,2.81h-.85v4.28h-1.79v-11.39h2.64ZM92.66,21.37v3.86h.85c.58,0,.87-.36.87-1.08v-1.71c0-.71-.29-1.07-.87-1.07h-.85Z'/%3e%3cpath%20class='st0'%20d='M98.8,31.14h-1.79v-11.39h1.79v4.88h2.03v-4.88h1.83v11.39h-1.83v-4.88h-2.03v4.88Z'/%3e%3cpath%20class='st0'%20d='M105.36,24.55h2.46v1.62h-2.46v3.34h3.09v1.63h-4.88v-11.39h4.88v1.63h-3.09v3.18ZM108.17,17.29l-1.76,1.91h-1.26l1.17-1.91h1.86Z'/%3e%3cpath%20class='st0'%20d='M112.2,19.75c1.78,0,2.67.94,2.67,2.82v1.48c0,1.87-.89,2.81-2.67,2.81h-.85v4.28h-1.79v-11.39h2.64ZM111.35,21.37v3.86h.85c.58,0,.87-.36.87-1.08v-1.71c0-.71-.29-1.07-.87-1.07h-.85Z'/%3e%3c/g%3e%3ccircle%20class='st1'%20cx='25'%20cy='25'%20r='20'/%3e%3cpath%20class='st0'%20d='M32.78,19.27c2.92,0,4.43,2.55,5.28,5.33l.71,2.17c.14.38-.33.75-.71.75h-5.61c.19-.33.24-.71.09-1.08l-.75-2.45c-.43-1.32-.99-2.64-1.79-3.77.75-.57,1.65-.94,2.78-.94h0ZM25,18.38c3.25,0,4.9,2.78,5.89,5.89l.76,2.45c.14.42-.33.8-.8.8h-11.69c-.42,0-.94-.38-.8-.8l.75-2.45c.99-3.11,2.64-5.89,5.89-5.89h0ZM25,11.35c1.74,0,3.11,1.37,3.11,3.11s-1.37,3.11-3.11,3.11-3.11-1.41-3.11-3.11,1.41-3.11,3.11-3.11h0ZM17.27,19.27c1.08,0,1.98.38,2.73.94-.8,1.13-1.37,2.45-1.74,3.77l-.8,2.45c-.14.38-.05.75.09,1.08h-5.56c-.42,0-.9-.38-.75-.75l.71-2.17c.9-2.78,2.41-5.33,5.33-5.33h0ZM17.27,12.91c1.51,0,2.78,1.27,2.78,2.83s-1.27,2.83-2.78,2.83-2.83-1.27-2.83-2.83,1.27-2.83,2.83-2.83h0ZM32.78,12.91c1.56,0,2.78,1.27,2.78,2.83s-1.23,2.83-2.78,2.83-2.83-1.27-2.83-2.83,1.27-2.83,2.83-2.83h0ZM27.07,28.56v.09c0,.57-.24,1.08-.61,1.46h0v.05c-.38.33-.9.57-1.46.57s-1.08-.24-1.46-.61h0c-.38-.38-.61-.9-.61-1.46v-.09h1.41v.09c0,.19.05.38.19.47v.05c.09.09.28.19.47.19s.38-.09.47-.19v-.05c.14-.09.24-.28.24-.47t-.05-.09h1.41ZM30.99,28.56v.09c0,1.65-.66,3.16-1.74,4.24-1.08,1.08-2.59,1.79-4.24,1.79s-3.16-.71-4.24-1.79l-.05-.05c-1.04-1.08-1.7-2.55-1.7-4.2v-.09h1.41v.09c0,1.27.47,2.4,1.27,3.25h.05c.85.85,1.98,1.37,3.25,1.37s2.4-.52,3.25-1.37c.85-.8,1.37-1.98,1.37-3.25v-.09h1.37ZM34.99,28.56v.09c0,2.78-1.13,5.28-2.92,7.07-1.79,1.79-4.29,2.92-7.07,2.92s-5.23-1.13-7.07-2.92c-1.79-1.79-2.92-4.29-2.92-7.07v-.09h1.41v.09c0,2.4.94,4.53,2.5,6.08,1.56,1.56,3.72,2.5,6.08,2.5s4.52-.94,6.08-2.5c1.56-1.56,2.5-3.68,2.5-6.08v-.09h1.41Z'/%3e%3c/svg%3e)