
Infrared spectroscopy as a tool for discrimination between sensitive
and multiresistant K562 cells
Anthoula Gaigneaux, Jean-Marie Ruysschaert and Erik Goormaghtigh
Laboratory of Structure and Function of Biological Membranes, Free University of Brussels, Belgium
Fourier transform infrared spectroscopy was performed on
human leukemic daunorubicin-sensitive K562 cells and their
multiresistant counterpart derived by selection. Statistical
analysis, including variable reduction and linear discrimi-
nant analysis was performed on sensitive and multiresistant
cells spectra in order to establish a diagnostic tool for
multiresistant pattern. For each of the two methods of data
reduction tested [genetic algorithm or principal component
analysis (PCA)] discrimination between the two cell lines was
found to be possible. The best results, obtained with
PCA-reduction, showed an accuracy of 93% on a distinct
test set of spectra. These results demonstrate the efficiency of
Fourier transform infrared spectroscopy for classification.
Further analysis of the spectral differences indicated that
discrimination between resistant and sensitive cells was
based on variations in all cellular contents. Lipid and nucleic
acid decreased, relatively, while the protein content
increased.
Keywords: multiresistance; infrared spectroscopy; multivar-
iate statistics; K562; leukemia.
In recent years, infrared spectroscopy has been a powerful
tool for biodiagnostics [1]. A major advantage of infrared
spectroscopy over more classical techniques of investigation
is that neither staining of the samples nor chemical reagent
additions are necessary. Just a few minutes and a few lLof
a cell suspension are sufficient to obtain a spectrum
representative of all cell constituents.
This technique is based on absorption of infrared light by
the vibrational transitions in covalent bonds. Intensities
provide quantitative information, while frequencies give
qualitative information about the nature of these bonds,
their structure, and their molecular environment.
In complex systems such as cells, the main absorptions
arise from N–H, C¼O, C–H and P¼O bonds from the
proteins, lipids, and nucleic acids present in the cells. An
infrared spectrum of cells is the sum of all these contribu-
tions. A classical group frequency approach can be used to
interpret changes in one of the cell component, as previously
done on leukemic cell lines [2]. Another way to analyse
infrared spectra is to use the spectral signature to correlate
spectral patterns with biological properties. Rigas [3] proved
that IR spectroscopy was able to detect features of human
normal or malignant cultured colonocytes. Multivariate
statistics known as Ôpattern recognition techniquesÕhave
been used to classify spectra in intrinsic groups when they
are unsupervised (cluster analysis, or principal component
analysis). Naumann et al. [4] successfully used cluster
analysis to characterize hundreds of bacterial cell lines. The
same approach was also used to clearly distinguish between
normal and chronic lymphocytic leukemia cells [5]. Super-
vised multivariate methods, such as linear discriminant
analysis (LDA) or partial least squares regression are
powerful tools to build rules of discrimination that are used
later to identify new samples. This method was successfully
applied to skin tumours [6] and to lymph cells and tissues [7].
The multiresistant phenotype is an significant problem in
cancer chemotherapy. It is characterized by cell resistance to
multiple and structurally unrelated drugs [8]. It may be
expressed by cells selected for resistance to a single agent.
Many of these multiresistant cells differ from their sensitive
counterpart by overexpression of a membranous protein of
170 kDa, named P-glycoprotein (P-gp) [9]. Although the
sole presence of P-gp has proven in some cell lines to confer
multidrug resistance phenotype [10], previous studies have
shown that molecular changes in lipid and nucleic acid
fractions of the cells accompany P-gp overexpression
[11,12].
In this study, we worked with sensitive (K562/DNS) and
multiresistant (K562/DNR) human chronic myelogenous
leukemia K562 cells. First, we examined whether infrared
spectroscopy, associated with data reduction techniques and
multivariate statistics, is able to identify multidrug resistant
phenotype in these cells with a high accuracy. Second, we
tried to learn more about biological origin of the spectral
differences that exist between the K562-multiresistant cell
line and its sensitive counterpart.
MATERIALS AND METHODS
Cell culture
K562 is a human chronic myelogenous leukemia cell line. In
this study, two different K562 lines were used. The first cell
line (cell line A) has been described previously [13]. A second
Correspondence to G. Erik, Laboratory of Structure and Function of
Biological Membranes, Free University of Brussels, CP 206/2,
Boulevard du Triomphe, B-1050 Brussels, Belgium.
Fax: + 32 2 650 5382, Tel.: + 32 2 650 5386,
E-mail: egoor@ulb.ac.be
Abbreviations: P-gp, P-glycoprotein; K562/DNS, sensitive K562 cells;
K562/DNR, daunorubicin resistant K562 cells; PCA, principal com-
ponent analysis; LDA, linear discriminant analysis; MDR, multidrug
resistant.
(Received 4 January 2002, accepted 21 January 2002)
Eur. J. Biochem. 269, 1968–1973 (2002) ÓFEBS 2002 doi:10.1046/j.1432-1033.2002.02841.x
cell line (cell line B) was obtained from A. Delforge (Bordet
Hospital, Bruxelles). From each cell line (K562/DNS), a
multiresistant subline (K562/DNR) was derived by selection
on daunorubicin. All cell lines were kept in exponential
growth in RPMI 1640 medium, supplemented with 10%
fetal bovine serum,
L
-glutamine (2%), and 1% antibiotic/
antimycotic solution, at 37 °C, in an humidified atmosphere
of 5% CO
2
. All growing media and supplement were
purchased at Life Technologies (Paisley, Scotland). To
maintain resistance phenotype, K562/DNR was selected in
a medium containing 1 l
M
daunorubicin or doxorubicin for
1 week every 2 months. All infrared measurements were
carried out at least one week after the interruption of culture
with selection agent. The cell lines were maintained at the
same density of cells and then harvested in the same phase of
culture growth (exponential) for IR measurement.
For harvesting, cells were centrifuged 3 min at 300 gand
the pellet washed twice in a solution 0.9% NaCl to remove
all growing medium.
FTIR spectroscopy
An aliquot of cell pellet was deposited on a germanium
crystal (2–5 ·10
5
cells per smear). The sample was
rapidly evaporated in N
2
flux to obtain a homogenous film
of entire cells. IR measurements were recorded between
4000 and 800 cm
)1
by a Bruker Equinox spectrophotometer
(Bruker, Karlsruhe, Germany) containing a liquid
N
2
-refrigerated Mercury Cadmium Telluride detector. Each
spectrum was obtained by averaging of 256 scans at a
resolution of 4 cm
)1
. The spectra were baseline corrected
and normalized for equal area between 1711 and 1485 cm
)1
.
Spectra were encoded every 1 cm
)1
.
Data analysis
All spectra were treated with in-house software working in a
MATLAB
environment (
MATLAB
6, Mathworks Inc., Natick,
USA). Spectra were separated in a training set constituted of
48 samples of the cell line A and a test set composed of 30
spectra of cell line A and cell line B. The training set was the
only one used for model calculations (PCA, genetic
algorithm and LDA).
Data reduction by principal component analysis (PCA).
IR spectra are samples defined by 3000 variables. To
reduce this number, PCA was performed. PCA is a method
of variable reduction that builds linear combinations
between variables (wavenumbers) varying together. The
first linear combination is called the first principal compo-
nent, and contains almost 98% of the variance. The second
principal component is a linear combination of wavenum-
bers, which explains the maximum of residual variance and
is perpendicular to the first one. The following principal
components obey the same rules. This method allows the
reduction of a spectrum to 10 variables (the first 10 principal
components) that explain almost 100% of variance.
Selection of wavenumbers with genetic algorithm.The
genetic algorithm is a supervised method that uses muta-
tion/selection principles to solve problems [14]. Many
parameters can be adjusted for increasing the efficiency of
the algorithm. The data were analysed with a window of five
wavenumbers, assuming that adjacent wavenumbers are
highly correlated. A population of 32 solutions was built at
each generation, and evaluated. The algorithm stopped at
generation 100 or when 50% of convergence was reached
between all the solutions. The mutation rate was 0.005, with
double crossing-over, and data were divided in nine subsets
to cross-validate the models.
As the solutions proposed by this method are not
deterministic, running the algorithm several times allows a
more precise solution to be obtained. Only the wavenum-
bers selected in more than 80% of all models built were kept
in the final model.
Linear discriminant analysis (LDA).Thisstatistical
multivariate method is supervised. It searches for the
variables containing the greatest interclass variance and
the smallest intraclass variance, and constructs a linear
combination of the variables to discriminate between the
classes. The rule is constructed with training set of samples,
and further tested with the test set. We performed LDA in
standard method, i.e. including all the variables in the
model.
RESULTS
Spectral information contained in a cell IR spectrum
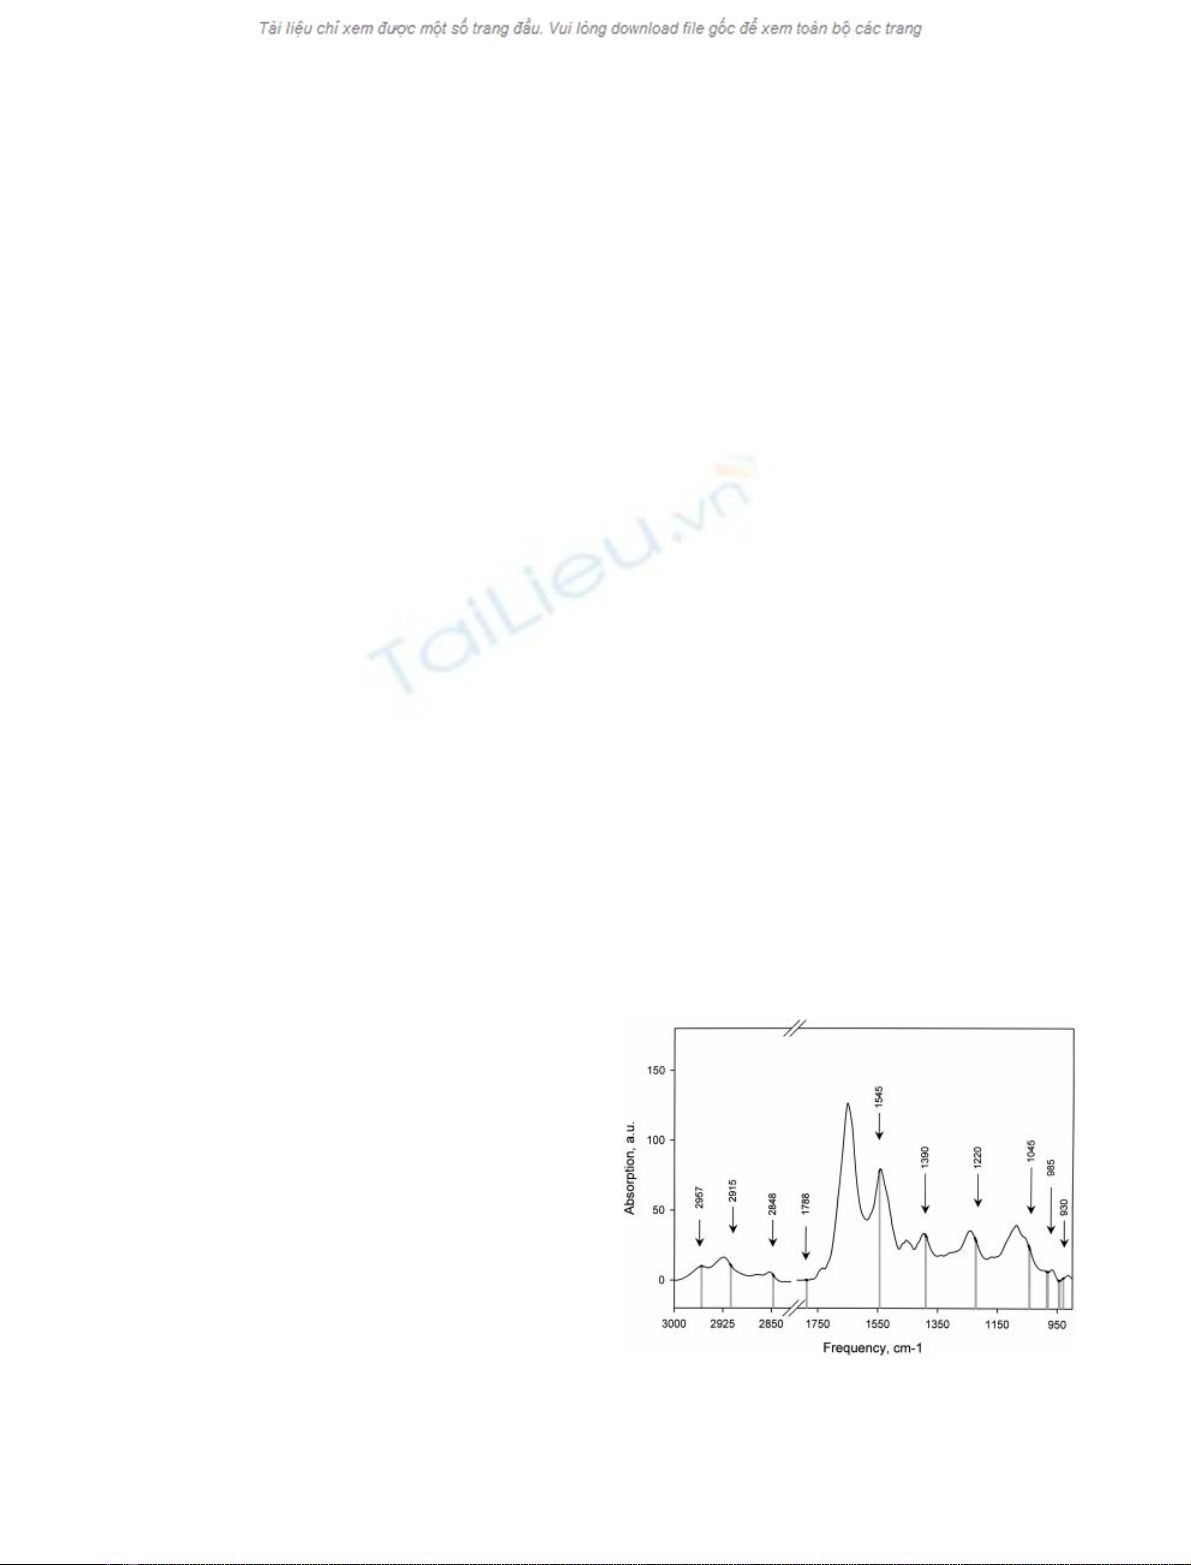
Figure 1 (line A) shows a representative spectrum of K562/
DNS cells, which can be divided in three regions. The
absorption between 3000 and 2800 cm
)1
is dominated by
the stretching vibration of CH
2
and CH
3
groups mainly
contained in fatty acids of the cell. The band at 2963 cm
)1
can be assigned to the asymmetric stretching of CH
3
,and
the band at 2873 cm
)1
to its symmetric mode. The bands at
2926 and 2853 cm
)1
can be assigned to an asymmetric and
symmetric stretching mode of CH
2
, respectively [1]. The
peak shoulder present at 1740 cm
)1
canbeassignedtothe
ester C¼O stretching of phospholipids [15,16], not present
in DNA and proteins. Between 1700 and 1300 cm
)1
,
contributions are primarily due to proteins, with some
Fig. 1. K562 cell spectrum and spectral areas selected by genetic algo-
rithm. A smear of about 2 ·10
5
cells was dried on an area of 2 cm
2
on
the germanium surface as explained in Materials and methods.
Wavenumbers selected by genetic algorithm are in shaded.
ÓFEBS 2002 K562 cell classification by FT1R (Eur. J. Biochem. 269) 1969
absorptions from lipids. The stretching of protein amide
C¼O bonds arises at 1650 cm
)1
(amide I). The deformation
of protein amide N–H bond appears at 1540 cm
)1
(amide
II) [15]. The 1450 and 1400 cm
)1
bands arise from the side
chain of proteins [15], but the C–H bending vibration of
fatty acids at 1467 and 1450 cm
)1
[3] and the carboxylate
vibration of fatty acids at 1400 cm
)1
[17] are superimposed.
Absorptions between 1300 and 900 cm
)1
arise mainly
from phosphate associated with nucleic acids, i.e. DNA
and RNA. The absorption bands at 1245 and 1087 cm
)1
are characteristic of asymmetric and symmetric phospho-
diester vibration of nucleic acids [15]. In glycogen-poor cells
such as lymphocytes, Benedetti et al. assigned the shoulders
present at 1117 and 1020 cm
)1
to RNA and DNA,
respectively [18].
Classification by LDA
LDA was applied to discriminate the two cell lines. The
large number of variables (3000) of an infrared spectrum
is a problem for this approach that needs more observations
than variables. We attempted to reduce this number by two
distinct methods: genetic algorithm (supervised method),
and PCA (unsupervised method).
Classification by LDA on spectra restricted by genetic
algorithm
Genetic algorithm was performed on the training set
composed of K562/DNR (22 spectra) and K562/DNS
(26 spectra) cells. Each spectrum was obtained for another
cell culture. The 48 spectra were accumulated over a
period of eight months. The region between 2800 and
1800 cm
)1
, which does not contain any chemical infor-
mation excepted from atmospheric CO
2
, was discarded.
After 16 runs of the algorithm, we selected wavenumbers
present in more than 80% of the 185 models built. They
were distributed in 10 regions of the spectra (Fig. 1),
including several areas in lipid and in nucleic acid regions,
and one area associated with proteins (amide II). Training
set spectra were used for model building in LDA. The
model was tested with the 30 test spectra (not included in
the training set) on which the global accuracy was 73%
(Table 1). About the half of the resistant spectra were
classified in the sensitive class.
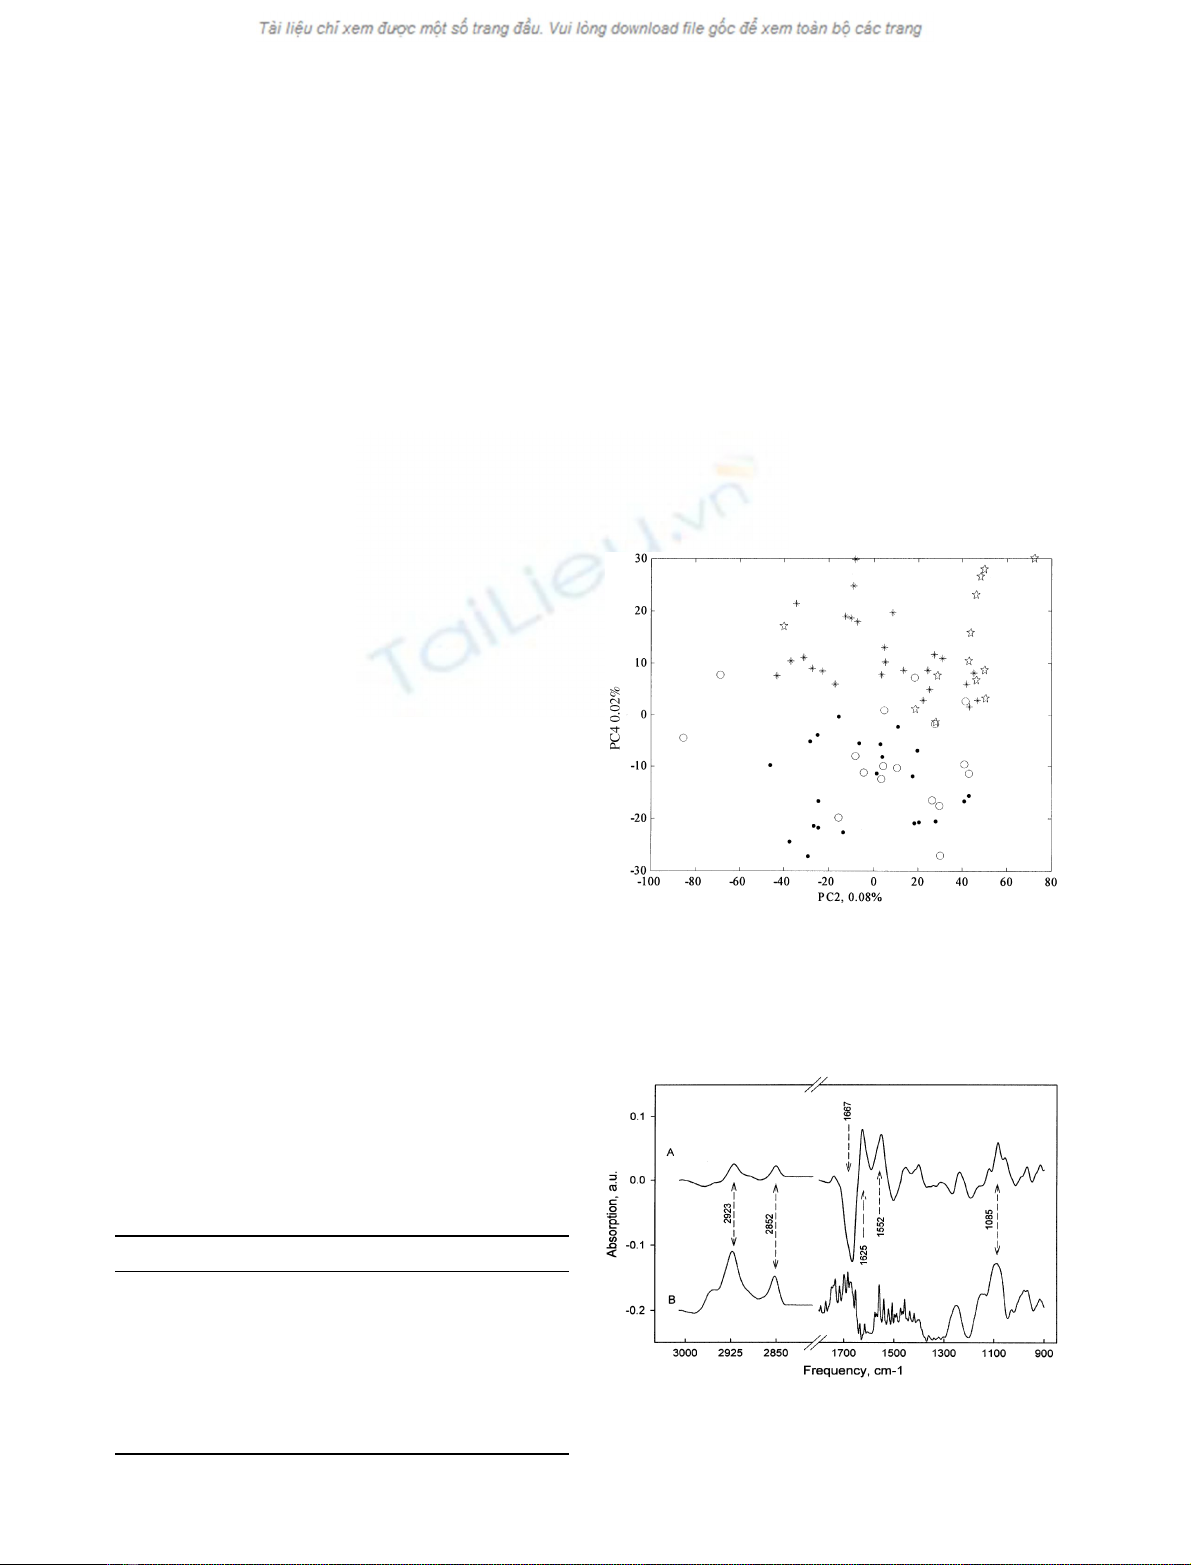
Classification by LDA on spectra reduced by PCA
PCA was performed on the training set. At this stage, only
two or three principal components were sufficient to obtain
a partial separation between the two cell lines; Fig. 2 shows
the spectra reduced with PCA projected on vector 2 and
vector 4. Each one of these two vectors (Fig. 3) has
features at characteristic wavenumbers of nucleic acids,
lipids, and protein. It is interesting to note that, in the
second vector, a negative influence of 1625 cm
)1
(attribut-
ed to a beta sheet secondary structure of proteins) is
associated with a positive value of 1667 cm
)1
(ahelix
secondary structure). This may reflect a modification in the
global secondary structure composition in the cells.
Reduced training set spectra was used for model building
in LDA. The results obtained show 100% of correct
classification for the training set. For the test sets (Table 2),
the global accuracy was 93%.
Table 1. Results of LDA for spectra of the test set when spectra were
reduced by genetic algorithm. Overall accuracy on the training set was
100% and overall accuracy on the test set is 73%. Actual assignments
in columns, LDA predicted assignments in rows.
K562/DNS K562/DNR Accuracy
K562/DNS 7 0 100%
A line
K562/DNS 6 0 100%
B line
K562/DNR 6 5 45%
A line
K562/DNR 2 4 67%
B line
Fig. 2. Two-dimensional plot of PCA-reduced spectra of K562 cells.
Resistant K562 cells (39 spectra, black stars), sensitive K562 cells
(39 spectra, circles) of the training (full) and test set (empty). The
percentage of variance represented by each component is indicated on
the axes.
Fig. 3. Principal components which allow a partial separation between
resistant and sensitive K562 cells. (A) Second vector. (B) Fourth vector.
All components are on the same scale.
1970 A. Gaigneaux et al. (Eur. J. Biochem. 269)ÓFEBS 2002


![Vaccine và ứng dụng: Bài tiểu luận [chuẩn SEO]](https://cdn.tailieu.vn/images/document/thumbnail/2016/20160519/3008140018/135x160/652005293.jpg)


%20--%3e%3cdefs%3e%3cstyle%3e%20.st0%20{%20fill:%20%23fff;%20}%20.st1%20{%20fill:%20%237800fa;%20}%20%3c/style%3e%3c/defs%3e%3cpath%20class='st1'%20d='M117.78,12.18H43.11c2.9,3.47,4.65,7.94,4.65,12.82,0,5.6-2.3,10.66-6.01,14.29h76.02l7.22-13.56-7.22-13.56Z'/%3e%3cg%3e%3cpath%20class='st0'%20d='M53.58,26.17h-.59v-1.46h.59v-4.96h2.83c1.78,0,2.67.94,2.67,2.82v5.76c0,1.87-.89,2.81-2.67,2.81h-2.83v-4.96ZM55.36,21.37v3.34h1.1v1.46h-1.1v3.34h1.01c.61,0,.91-.37.91-1.1v-5.93c0-.74-.3-1.1-.91-1.1h-1.01Z'/%3e%3cpath%20class='st0'%20d='M65.99,31.14h-1.8l-.31-2.07h-2.19l-.31,2.07h-1.64l1.82-11.39h2.62l1.82,11.39ZM65.28,18.04c-.25.46-.51.77-.75.94-.21.15-.47.22-.79.22-.26,0-.57-.07-.92-.22l-.38-.15c-.14-.05-.26-.07-.37-.07-.3,0-.53.18-.71.54l-.91-.68c.25-.46.51-.77.75-.94.21-.14.48-.21.79-.21.26,0,.57.07.92.21l.38.15c.14.05.26.07.37.07.3,0,.53-.18.71-.54l.91.68ZM61.91,27.52h1.73l-.87-5.76-.87,5.76Z'/%3e%3cpath%20class='st0'%20d='M74.53,26.89v1.52c0,1.91-.89,2.86-2.67,2.86s-2.67-.95-2.67-2.86v-5.93c0-1.91.89-2.86,2.67-2.86s2.67.95,2.67,2.86v1.11h-1.69v-1.22c0-.75-.31-1.12-.93-1.12s-.93.37-.93,1.12v6.15c0,.74.31,1.11.93,1.11s.93-.37.93-1.11v-1.63h1.69Z'/%3e%3cpath%20class='st0'%20d='M81.4,31.14h-1.8l-.31-2.07h-2.19l-.31,2.07h-1.64l1.82-11.39h2.62l1.82,11.39ZM75.9,19.2l1.52-1.91h1.71l1.51,1.91h-1.61l-.76-.95-.75.95h-1.61ZM77.32,27.52h1.73l-.87-5.76-.87,5.76ZM83.1,15.99l-1.76,1.91h-1.26l1.17-1.91h1.86Z'/%3e%3cpath%20class='st0'%20d='M84.86,19.75c1.78,0,2.67.94,2.67,2.82v1.48c0,1.87-.89,2.81-2.67,2.81h-.85v4.28h-1.79v-11.39h2.64ZM84.01,21.37v3.86h.85c.58,0,.87-.36.87-1.08v-1.71c0-.71-.29-1.07-.87-1.07h-.85Z'/%3e%3cpath%20class='st0'%20d='M93.51,19.75c1.78,0,2.67.94,2.67,2.82v1.48c0,1.87-.89,2.81-2.67,2.81h-.85v4.28h-1.79v-11.39h2.64ZM92.66,21.37v3.86h.85c.58,0,.87-.36.87-1.08v-1.71c0-.71-.29-1.07-.87-1.07h-.85Z'/%3e%3cpath%20class='st0'%20d='M98.8,31.14h-1.79v-11.39h1.79v4.88h2.03v-4.88h1.83v11.39h-1.83v-4.88h-2.03v4.88Z'/%3e%3cpath%20class='st0'%20d='M105.36,24.55h2.46v1.62h-2.46v3.34h3.09v1.63h-4.88v-11.39h4.88v1.63h-3.09v3.18ZM108.17,17.29l-1.76,1.91h-1.26l1.17-1.91h1.86Z'/%3e%3cpath%20class='st0'%20d='M112.2,19.75c1.78,0,2.67.94,2.67,2.82v1.48c0,1.87-.89,2.81-2.67,2.81h-.85v4.28h-1.79v-11.39h2.64ZM111.35,21.37v3.86h.85c.58,0,.87-.36.87-1.08v-1.71c0-.71-.29-1.07-.87-1.07h-.85Z'/%3e%3c/g%3e%3ccircle%20class='st1'%20cx='25'%20cy='25'%20r='20'/%3e%3cpath%20class='st0'%20d='M32.78,19.27c2.92,0,4.43,2.55,5.28,5.33l.71,2.17c.14.38-.33.75-.71.75h-5.61c.19-.33.24-.71.09-1.08l-.75-2.45c-.43-1.32-.99-2.64-1.79-3.77.75-.57,1.65-.94,2.78-.94h0ZM25,18.38c3.25,0,4.9,2.78,5.89,5.89l.76,2.45c.14.42-.33.8-.8.8h-11.69c-.42,0-.94-.38-.8-.8l.75-2.45c.99-3.11,2.64-5.89,5.89-5.89h0ZM25,11.35c1.74,0,3.11,1.37,3.11,3.11s-1.37,3.11-3.11,3.11-3.11-1.41-3.11-3.11,1.41-3.11,3.11-3.11h0ZM17.27,19.27c1.08,0,1.98.38,2.73.94-.8,1.13-1.37,2.45-1.74,3.77l-.8,2.45c-.14.38-.05.75.09,1.08h-5.56c-.42,0-.9-.38-.75-.75l.71-2.17c.9-2.78,2.41-5.33,5.33-5.33h0ZM17.27,12.91c1.51,0,2.78,1.27,2.78,2.83s-1.27,2.83-2.78,2.83-2.83-1.27-2.83-2.83,1.27-2.83,2.83-2.83h0ZM32.78,12.91c1.56,0,2.78,1.27,2.78,2.83s-1.23,2.83-2.78,2.83-2.83-1.27-2.83-2.83,1.27-2.83,2.83-2.83h0ZM27.07,28.56v.09c0,.57-.24,1.08-.61,1.46h0v.05c-.38.33-.9.57-1.46.57s-1.08-.24-1.46-.61h0c-.38-.38-.61-.9-.61-1.46v-.09h1.41v.09c0,.19.05.38.19.47v.05c.09.09.28.19.47.19s.38-.09.47-.19v-.05c.14-.09.24-.28.24-.47t-.05-.09h1.41ZM30.99,28.56v.09c0,1.65-.66,3.16-1.74,4.24-1.08,1.08-2.59,1.79-4.24,1.79s-3.16-.71-4.24-1.79l-.05-.05c-1.04-1.08-1.7-2.55-1.7-4.2v-.09h1.41v.09c0,1.27.47,2.4,1.27,3.25h.05c.85.85,1.98,1.37,3.25,1.37s2.4-.52,3.25-1.37c.85-.8,1.37-1.98,1.37-3.25v-.09h1.37ZM34.99,28.56v.09c0,2.78-1.13,5.28-2.92,7.07-1.79,1.79-4.29,2.92-7.07,2.92s-5.23-1.13-7.07-2.92c-1.79-1.79-2.92-4.29-2.92-7.07v-.09h1.41v.09c0,2.4.94,4.53,2.5,6.08,1.56,1.56,3.72,2.5,6.08,2.5s4.52-.94,6.08-2.5c1.56-1.56,2.5-3.68,2.5-6.08v-.09h1.41Z'/%3e%3c/svg%3e)