Serin and Vingron Algorithms for Molecular Biology 2011, 6:18 http://www.almob.org/content/6/1/18
R E S E A R C H
Open Access
DeBi: Discovering Differentially Expressed Biclusters using a Frequent Itemset Approach Akdes Serin* and Martin Vingron
Abstract
Background: The analysis of massive high throughput data via clustering algorithms is very important for elucidating gene functions in biological systems. However, traditional clustering methods have several drawbacks. Biclustering overcomes these limitations by grouping genes and samples simultaneously. It discovers subsets of genes that are co-expressed in certain samples. Recent studies showed that biclustering has a great potential in detecting marker genes that are associated with certain tissues or diseases. Several biclustering algorithms have been proposed. However, it is still a challenge to find biclusters that are significant based on biological validation measures. Besides that, there is a need for a biclustering algorithm that is capable of analyzing very large datasets in reasonable time.
Results: Here we present a fast biclustering algorithm called DeBi (Differentially Expressed BIclusters). The algorithm is based on a well known data mining approach called frequent itemset. It discovers maximum size homogeneous biclusters in which each gene is strongly associated with a subset of samples. We evaluate the performance of DeBi on a yeast dataset, on synthetic datasets and on human datasets. Conclusions: We demonstrate that the DeBi algorithm provides functionally more coherent gene sets compared to standard clustering or biclustering algorithms using biological validation measures such as Gene Ontology term and Transcription Factor Binding Site enrichment. We show that DeBi is a computationally efficient and powerful tool in analyzing large datasets. The method is also applicable on multiple gene expression datasets coming from different labs or platforms.
Background In recent years, various high throughput technologies such as cDNA microarrays, oligo-microarrays and sequence-based approaches (RNA-Seq) for transcrip- tome profiling have been developed. The most common approach for detecting functionally related gene sets from such high throughput data is clustering [1]. Tradi- tional clustering methods like hierarchical clustering [2] and k-means [3], have several limitations. Firstly, they are based on the assumption that a cluster of genes behaves similarly in all samples. However, a cellular pro- cess may affect a subset of genes, only under certain conditions. Secondly, clustering assigns each gene or sample to a single cluster. However, some genes may not be active in any of the samples and some genes may participate in multiple processes.
Biclustering is a two-way clustering method for detect- ing local patterns in data. It finds subsets of genes that behave similarly in subsets of samples. Biclustering was initially introduced by Hartigan [4]. However, it was first applied by Cheng and Church [5] on gene expression data. Cheng and Church tried to identify submatrices of low mean residue score which indicates uniform fluctua- tion in expression profiles. Since the algorithm discovers one bicluster at a time, repeated application of the method on a modified matrix is needed for discovering multiple biclusters. This has the drawback that it results in highly overlapping gene sets. Ben-Dor et al. [6] detected a subset of genes whose expression levels induce the same linear ordering of the experiments. The drawback of this method is that it enforces a strict order of the samples. Bergmann et al. [7] identified biclusters which consist of the set of co-regulated genes and the conditions that induce their co-regulation. Mur- ali and Kasif [8] found subsets of genes that are
© 2011 Serin and Vingron; licensee BioMed Central Ltd. This is an Open Access article distributed under the terms of the Creative Commons Attribution License (http://creativecommons.org/licenses/by/2.0), which permits unrestricted use, distribution, and reproduction in any medium, provided the original work is properly cited.
* Correspondence: serin@molgen.mpg.de Max Planck Institute for Molecular Genetics, Ihnestrasse 63-73, 14195 Berlin, Germany
Page 2 of 12
Serin and Vingron Algorithms for Molecular Biology 2011, 6:18 http://www.almob.org/content/6/1/18
simultaneously similarly expressed across a subset of the samples. The algorithm uses prior knowledge about the sample phenotypes. Tanay et al. [9] defined biclustering as a problem of finding bicliques in a bipartite graph. Due to its high complexity, the number of rows the bicluster may have is restricted. Prelic et al. [10] defined the binary inclusion maximal biclustering (BIMAX) using a fast divide and conquer method. However, divide and conquer has the drawback of possibly miss- ing good biclusters by early splits. Li et al. [11] devel- oped an algorithm for discovering statistically significant biclusters from datasets containing tens of thousands of genes and thousands of conditions. Madeira and Oli- veira have written a detailed review on different biclus- tering methods [12].
lymphoma (DLBCL) dataset [15] (d) a reference collec- tion of gene-expression profiles from human cells that have been treated with a variety of drugs [14] (e) gene expression profiles of 2158 human tumor samples pub- lished by expO (Expression Project for Oncology) (f) gene sets from the Molecular Signature Database (MSigDB) C2 category. The synthetic data is studied to show the performance of our algorithm in recovering implanted biclusters. Additionally, the effect of overlap between biclusters and noise on the performance of the algorithm can be studied using the synthetic data. The yeast and human gene expression datasets are studied to evaluate the biological relevance of the biclusters from several aspects. We used a fold-change of 2 for binariz- ing the datasets. The set of biclusters generated by all the algorithms are filtered such that the remaining ones have a maximum overlap of 0.5. (unless specified otherwise)
Here, we propose a novel, fast biclustering algorithm called DeBi that utilizes differential gene expression ana- lysis. In DeBi, a bicluster has the following two main properties. Firstly, a bicluster is a maximum homoge- nous gene set where each gene in the bicluster should be highly or lowly expressed over all the bicluster sam- ples. Secondly, each gene in the bicluster shows statisti- cal difference in expression between the samples in the bicluster and the samples not in the bicluster. Differen- tially expressed biclusters lead to functionally more coherent gene sets compared to standard clustering or biclustering algorithms.
First, for each bicluster we calculated the statistically significantly enriched Gene Ontology (GO) terms using the hypergeometric test. We determined the proportion of GO term enriched biclusters at different levels of sig- nificance. Second, Transcription Factor Binding Sites (TFBS) enrichment is calculated by a hypergeometric test using transcription factor binding site data coming from various sources [16-18] at different levels of signifi- cance. The GO term and TFBS enrichment analyses are done using Genomica http://genie.weizmann.ac.il.
There are several advantages of the DeBi algorithm. Firstly, the algorithm is capable of discovering biclusters on very large datasets such as the human connectivity map data with 22283 genes and 6100 samples in reason- able time. Secondly, it is not required to define the number of biclusters a priori [5,7,10].
We have compared our algorithm with BIMAX, SAMBA, Cheng and Churchs algorithm (CC), Order Preserving Submatrix Algorithm (OPSM), Iterative Sig- nature Algorithm (ISA) and Qualitative Biclustering (QUBIC) [5-7,9,10]. We used QUBIC software for QUBIC, BicAT software for OPSM, ISA, BIMAX and Expander software for SAMBA with default settings for each algorithm [10,19,20].
We evaluated the performance of DeBi on a yeast dataset [13], on synthetic datasets [10], on the connec- tivity map dataset which is a reference collection of gene expression profiles from human cells that have been treated with a variety of drugs [14], gene expres- sion profiles of 2158 human tumor samples published by expO (Expression Project for Oncology), on diffuse large B-cell lymphoma (DLBCL) dataset [15] and on gene sets from the Molecular Signature Database (MSigDB) C2 category. We show that DeBi compares well with existing biclustering methods such as BIMAX, SAMBA, Cheng and Church’s algorithm (CC), Order Preserving Submatrix Algorithm (OPSM), Iterative Sig- nature Algorithm (ISA) and Qualitative Biclustering (QUBIC) [5-7,9,10].
Prelic’s Synthetic Data We applied our algorithm to a synthetic gene expression dataset. In the artificial datasets biclusters have been created on the basis of two scenarios (data available at http://www.tik.ee.ethz.ch/sop/bimax. In the first sce- nario, non-overlapping biclusters with increasing noise levels are generated. In the second scenario, biclusters with increasing overlap but without noise are produced. In both scenarios, biclusters with constant expression values and biclusters following an additive model where the expression values varying over the conditions are investigated.
In order to assess the performance of different biclus- tering algorithms, we used two measures from Prelic et al. [10] and Hochreiter et al. [21], respectively. The mea- sure introduced by Prelic et al. calculates a similarity based on the Jaccard index between the computed
Results We have evaluated our algorithm on six datasets (a) Prelic’s benchmark synthetic datasets with implanted biclusters [10] (b) 300 different experimental pertur- bations of S. cerevisiae [13] (c) diffuse large B-cell
Page 3 of 12
Serin and Vingron Algorithms for Molecular Biology 2011, 6:18 http://www.almob.org/content/6/1/18
2025 genes and 192 conditions. As a binarization level we used the fold change of 1.58 as recommended in the original paper [13].
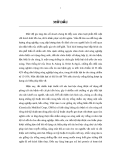
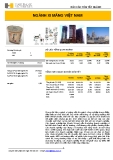
Figure 3 (a) illustrates the proportion of GO term and TFBS enriched biclusters for the six selected biclustering methods (ISA, OPSM, BIMAX, QUBIC, SAMBA and DeBi) at different levels of significance. DeBi performs the second best based on biological validation measures. BIMAX discovers a higher proportion of GO term and TFBS enriched biclusters. All the biclusters, the enrich- ment analysis can be found in Additional file 3.
biclusters and the implanted biclusters. Bicluster recov- ery score measures the accuracy of the predicted biclus- ters however it does not consider the number of biclusters in both sets. Hochreiter et al. introduced a consensus score by computing similarities between all pairs of biclusters and then assigning the biclusters of one set to biclusters of the other set. It penalizes differ- ent number of biclusters by dividing the sum of similari- ties by the numbers of biclusters in largest set. A more detailed description of the measures can be found in Additional File 1.
In the analyzed yeast data, conditions are knocked-out genes. Since biclustering discovers subsets of genes and subsets of conditions we can also examine the biological significance of the clustered conditions. Similar to the previous analysis, we measured GO term enrichment of conditions in each discovered biclusters. DeBi is the sec- ond best in discovering high percentage of GO term enriched biclusters.
In the discovered biclusters, the enriched gene func- tions are related to the enriched sample functions. Bicluster 83, genes are enriched in the ‘conjugation’ GO term and conditions are enriched in ‘regulation of biolo- gical quality’. Moreover, there is an enrichment of the TFBS of STE12, which is known to be involved in cell cycle. Bicluster 50, consists of genes and samples that are enriched in ‘ribosome biogenesis and assembly’ GO term. Bicluster 22, consists of genes and samples that are enriched in ‘lipid metabolic process’ GO term, and additionally genes are enriched with TFBS of HAP1. Bicluster 9, consists of down regulated genes and sam- ples that are enriched in ‘cell division’ GO term, and additionally genes are enriched with TFBS of STE12.
DLBCL Data We also evaluated our DeBi algorithm on ‘diffuse large B-cell lymphoma’ (DLBCL) dataset. DLBCL dataset con- sists of 661 genes and 180 samples. We applied ISA, OPSM, QUBIC, SAMBA and DeBi algorithms.
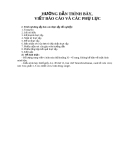
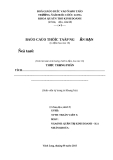
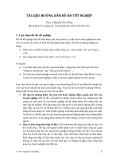
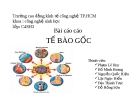
In Figures 1 and 2 the performance of BIMAX, ISA, SAMBA, DeBi, OPSM and QUBIC algorithms on the synthetic data is summarized based on Prelic et al. recovery score and Hochreiter et al. consensus score. The set of biclusters generated by these algorithms are filtered such that the remaining ones have a maximum overlap of 0.25. In the Prelic et al. paper, after the filter- ing process the largest 10 biclusters are chosen. Since the bicluster number is not known a priori, we have considered all the filtered biclusters. We did not evalu- ate xMotif and CC algorithms since they have been shown to perform badly in all the scenarios, mostly below 50% of recovery accuracy [10]. The CC and xMo- tif algorithms produce large biclusters containing genes that are not expressed. ISA and QUBIC give high Prelic et al. recovery score and Hochreiter et al. consensus score in all scenarios. SAMBA has a lower Hochreiter et al. consensus score compared to its Prelic et al. recovery score. The reason is that, Hochreiter et al. consensus score takes into account both gene and condition dimensions and SAMBA is not very accurate in recover- ing the biclusters in condition dimension. In the absence of noise with an increasing overlap degree, BIMAX has a high performance based on Prelic et al. and Hochreiter et al. scores. However, BIMAX estimates a large number of biclusters upon increasing noise level. The compari- sion of the estimated number of biclusters given by the algorithms with the true number of biclusters under all the scenarios can be found in Figure S1 in Additional File 1. In the absence of overlap with increasing noise levels, DeBi is able to identify 99% of implanted biclus- ters both in additive and constant model. High degree of overlap decreases the performance of DeBi because it considers the overlapping part of the biclusters as a seperate bicluster. The DeBi biclustering results can be found in Additional file 2.
Figure 3 (b) illustrates the proportion of GO term and TFBS enriched biclusters for the five biclustering meth- ods at different levels of significance. DeBi discovers the highest proportion of GO term and TFBS enriched biclusters. The up regulated bicluster 16 and down regu- lated bicluster 4 contains the sample classes identified by [22]. Bicluster 16 is enriched with ‘ribosome’ and ‘cell cycle’ GO Term and Bicluster 4 is enriched with ‘cell cycle’ and ‘death’ GO Terms. The protein interaction networks of this two selected biclusters can be found in Figure S2 and S3 Additional File 1. Protein interaction networks are generated using STRING [23]. All the biclusters and the enrichment analysis can be found in Additional file 4.
Yeast Compendium We further applied our algorithm to the compendium of gene expression profiles derived from 300 different experimental perturbations of S. cerevisiae [13]. We dis- covered 192 biclusters in the yeast dataset containing
Page 4 of 12
Serin and Vingron Algorithms for Molecular Biology 2011, 6:18 http://www.almob.org/content/6/1/18
Effect of Noise: Relevance of BC's (Constant)
Effect of Noise: Relevance of BC's (Additive)
Bimax Samba ISA DeBi Qubic OPSM
Bimax Samba ISA DeBi Qubic OPSM
0 . 1
0 . 1
e r o c s h c t a m g v a
e r o c s h c t a m g v a
5 . 0
5 . 0
0 . 0
0 . 0
0.05
0.10
0.15
0.20
0.25
0.00
0.02
0.04
0.06
0.08
0.10
noise level
noise level
Regulatory Complexity: Relevance of BC's (Constant)
Regulatory Complexity: Relevance of BC's (Additive)
Bimax Samba ISA DeBi Qubic OPSM
Bimax Samba ISA DeBi Qubic OPSM
0 . 1
0 . 1
e r o c s h c t a m g v a
e r o c s h c t a m g v a
5 . 0
5 . 0
0 . 0
0 . 0
0
2
4
6
8
0
2
4
6
8
overlap degree
overlap degree
Figure 1 Bicluster recovery accuracy score on synthetic data. The synthetic data have been created based on two scenories (a) and (b) with increasing noise level, constant and additive model respectively. (c) and (d) with increasing degree of overlap, constant and additive model respectively.
Human CMap Data We also evaluated our DeBi algorithm on the Connec- tivity Map v0.2 (CMap) [14]. CMap is a reference collec- tion of gene expression profiles from human cells that have been treated with a variety of drugs comprised of 6100 samples and 22283 genes. Figure 3 (c) summarizes the results of DeBi and QUBIC. The proportion of GO term and TFBS enriched biclusters are much more higher in DeBi compared to QUBIC.
The biclusters discovered by DeBi can be used to find drugs with a common mechanism of action and identify new therapeutics. Moreover, we can observe the effect
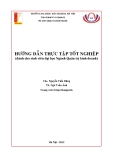
of drugs on different cell lines. Figure 4 shows parallel coordinate plots of some of the identified biclusters. In parallel coordinate plots, the profile of the conditions that are included in a bicluster are shown as black, the other conditions as gray. This aids to visualize the expression difference between the conditions in a biclus- ter compared to the rest of the conditions. The bicluster 6, contains up regulated ‘heat shock protein binding’ genes and ‘heat shock protein inhibitors’ such as gelda- namycin, alvespimycin, tanespimycin, monorden. Heat shock proteins (Hsps) are overexpressed in a wide range of human cancers and are involved in tumor cell
Page 5 of 12
Serin and Vingron Algorithms for Molecular Biology 2011, 6:18 http://www.almob.org/content/6/1/18
Effect of Noise: (Constant)
Effect of Noise: (Additive)
Bimax Samba ISA DeBi Qubic OPSM
Bimax Samba ISA DeBi Qubic OPSM
0 . 1
0 . 1
e r o c s s e r k n u m
e r o c s s e r k n u m
5 . 0
5 . 0
0 . 0
0 . 0
0.05
0.10
0.15
0.20
0.25
0.00
0.02
0.04
0.06
0.08
0.10
noise level
noise level
Regulatory Complexity: (Constant)
Regulatory Complexity: (Additive)
Bimax Samba ISA DeBi Qubic OPSM
Bimax Samba ISA DeBi Qubic OPSM
0
0
.
.
1
1
5
5
e r o c s s e r k n u m
e r o c s s e r k n u m
.
.
0
0
0
0
.
.
0
0
0
2
4
6
8
0
2
4
6
8
overlap degree
overlap degree
Figure 2 Bicluster consensus score on synthetic data. The synthetic data have been created based on two scenories (a) and (b) with increasing noise level, constant and additive model respectively. (c) and (d) with increasing degree of overlap, constant and additive model respectively.
Additionally, protein interaction networks of the selected biclusters are strikingly connected and they can be found in Figure S4, S5, S6 and S7 in Additional File 1. All the biclusters and the enrichment analysis can be found in Additional file 5.
proliferation [24]. Additionally, genes in the bicluster are enriched with ‘P53 binding site’, which is known to tar- get heat shock protein binding genes. Bicluster 11, con- tains up regulated genes enriched with ‘cadmium ion binding’ GO Term and calcium-binding protein inhibi- tors, calmidazolium. Bicluster 15, contains up regulated genes enriched with ‘transcription corepressor activity’ GO Term. Cell lines in this bicluster are all breast can- cer. Bicluster 14, contains down regulated genes enriched with ‘steroid hormone signalling’ GO Term.
Human ExpO Data We applied our DeBi algorithm and QUBIC on Expres- sion Project for Oncology(expO) dataset http://www.int- gen.org/. ExpO consists gene expression profiles of 2158
Page 6 of 12
Serin and Vingron Algorithms for Molecular Biology 2011, 6:18 http://www.almob.org/content/6/1/18
% (cid:95)
% (cid:95)
(a) GO and TFBS Enrichment of Yeast biclusters
(b) GO and TFBS Enrichment of DLBCL biclusters
0 . 1
0 . 1
8 . 0
8 . 0
i
i
GO: (cid:95)(cid:95)=5% GO: (cid:95)(cid:95)=1% GO: (cid:95)(cid:95)=0.5% GO: (cid:95)(cid:95)=0.1% GO: (cid:95)(cid:95)=0.001% TFBS: (cid:95)(cid:95)=5% TFBS: (cid:95)(cid:95)=1% TFBS: (cid:95)(cid:95)=0.5% TFBS: (cid:95)(cid:95)=0.1% TFBS: (cid:95)(cid:95)=0.001%
GO: (cid:95)(cid:95)=5% GO: (cid:95)(cid:95)=1% GO: (cid:95)(cid:95)=0.5% GO: (cid:95)(cid:95)=0.1% GO: (cid:95)(cid:95)=0.001% TFBS: (cid:95)(cid:95)=5% TFBS: (cid:95)(cid:95)=1% TFBS: (cid:95)(cid:95)=0.5% TFBS: (cid:95)(cid:95)=0.1% TFBS: (cid:95)(cid:95)=0.001%
6 . 0
6 . 0
l
l
i
i
4 . 0
4 . 0
2 . 0
2 . 0
0 . 0
0 . 0
BIMAX DeBi QUBIC OPSM
ISA
SAMBA
DeBi
OPSM
ISA
SAMBA QUBIC
l e v e l t n a c i f i n g s r e p s r e t s u c b d e h c i r n e f o e g a t n e c r e P
l e v e l t n a c i f i n g s r e p s r e t s u c b d e h c i r n e f o e g a t n e c r e P
(c) GO and TFBS Enrichment of CMap biclusters
(d) GO and TFBS Enrichment of ExpO biclusters
% (cid:95)
% (cid:95)
0 . 1
0 . 1
8 . 0
8 . 0
i
i
6 . 0
6 . 0
GO: (cid:95)(cid:95)=5% GO: (cid:95)(cid:95)=1% GO: (cid:95)(cid:95)=0.5% GO: (cid:95)(cid:95)=0.1% GO: (cid:95)(cid:95)=0.001% TFBS: (cid:95)(cid:95)=5% TFBS: (cid:95)(cid:95)=1% TFBS: (cid:95)(cid:95)=0.5% TFBS: (cid:95)(cid:95)=0.1% TFBS: (cid:95)(cid:95)=0.001%
GO: (cid:95)(cid:95)=5% GO: (cid:95)(cid:95)=1% GO: (cid:95)(cid:95)=0.5% GO: (cid:95)(cid:95)=0.1% GO: (cid:95)(cid:95)=0.001% TFBS: (cid:95)(cid:95)=5% TFBS: (cid:95)(cid:95)=1% TFBS: (cid:95)(cid:95)=0.5% TFBS: (cid:95)(cid:95)=0.1% TFBS: (cid:95)(cid:95)=0.001%
l
l
i
i
4 . 0
4 . 0
2 . 0
2 . 0
0 . 0
0 . 0
l e v e l t n a c i f i n g s r e p s r e t s u c b d e h c i r n e f o e g a t
l e v e l t n a c i f i n g s r e p s r e t s u c b d e h c i r n e f o e g a t
DeBi
QUBIC
DeBi
QUBIC
n e c r e P
n e c r e P
Figure 3 Biological Significance of Yeast, DLBCL, CMap, ExpO Biclusters. GO and TFBS enrichment of yeast, dlbcl, CMap and ExpO biclusters.
human tumor samples coming from diverse tissues with 40223 transcripts.
tumor samples and genes enriched with ‘protein-hor- mone receptor activity’. Bicluster 3 contains prostate tumor samples and genes enriched with ‘tissue kallikrein activity’. Bicluster 22 contains mostly pancreas and colon samples and genes enriched with ‘pancreatic elas- tase activity’ GO Term. All the biclusters and the enrichment analysis can be found in Additional file 6.
Figure 3 (d) shows that the proportion of GO term and TFBS enriched biclusters are much more higher in DeBi compared to QUBIC. It illustrates that DeBi performs better than QUBIC in ExpO data. 70% of the DeBi biclusters are enriched with GO Terms with a p-value smaller than 0.05. Moreover biclusters contain tumor samples mostly from similar tissue types. Figure S8 in Additional file 1 shows GO Term enrichment of some of the biclusters. Bicluster 13 contains thyroid
MSigDB Data Finally, we applied our algorithm on the manually curated gene sets from the Molecular Signature Database
Page 7 of 12
Serin and Vingron Algorithms for Molecular Biology 2011, 6:18 http://www.almob.org/content/6/1/18
Figure 4 Example CMap biclusters identified using DeBi Algorithm. Parallel coordinate plots of some of the identified CMap biclusters using the DeBi algorithm. In parallel coordinate plots, the profile of the conditions that are included in a bicluster are shown as black, the other conditions as gray.
Figure 5, illustrates all the biclusters using BiVoc algorithm [25]. BiVoc algorithm rearranges rows and conditions in order to represent the biclusters with the minimum space. The output matrix of BiVoc, may have repeated rows and/or columns from the original matrix. In Figure 5, the function of each bicluster is specified based on GO Term enrichment. Bicluster 3, contains the down-regulated gene set from Alzheimer patients and gene set from proteasome pathway. It is known that there is a significant decrease in proteasome activity in Alzheimer patients [26]. Bicluster 3 also contains the
(MSigDB) C2 category. The C2 category of MSigDB con- sists of 3272 gene sets in which 2392 gene sets are chemi- cal and genetic pertubations and 880 gene sets are from various pathway databases. The gene sets naturally define a binary matrix where ones indicate the affected gene under certain pertubation/pathway. The binary matrix contains 18205 genes and 3272 samples. This analysis aids us to identify the pathways that are affected by chemical and genetic perturbations. It has not been possible to run QUBIC on this dataset while QUBIC requires a certain amount of overlap between genes.
Page 8 of 12
Serin and Vingron Algorithms for Molecular Biology 2011, 6:18 http://www.almob.org/content/6/1/18
Figure 5 MSigDB biclusters identified using DeBi Algorithm.
ij of Eu are defined as follows:
Preliminaries The input gene expression data is binarized according to either up or down regulation. Let Eu and Ed denote the up and down regulation binary matrices, respectively. Then the entries eu (cid:2)
(1)
eu ij =
1 if gene i is c fold up regulated in sample j 0 otherwise
up-regulated gene set from pancreatic cancer patients. In previous studies, high activity of ubiquitin-protea- some pathway in pancreatic cancer cell line was detected [27]. Bicluster 8 contains up-regulated gene set from liver cancer patients and gene set from G-protein activation pathway. Dysfunction of G Protein-Coupled Receptor signaling pathways are involved in certain forms of cancer. All the biclusters and the enrichment analysis can be found in Additional file 7.
and the entries of ed
ij of Ed are defined analogously with a c-fold down-regulation cut-off. The fold change cut-off c will typically be set to 2.
Finding seed biclusters by Maximal Frequent Gene Set Algorithm The DeBi algorithm, identifies the seed gene sets by iteratively applying the maximal frequent gene set algo- rithm. We first define the term support, which we will later use in the algorithm. The support of the gene gi, i = 1 ,..., n, is defined as follows:
Running Time DeBi algorithm is capable of analyzing yeast data(size 6100 × 300) in 6 minutes, ExpO data (size 40223 × 2158) in 12 minutes, MSigDB data (size 18205 × 3272) in 11 minutes, DLBCL data (size 610 × 180) in 11 sec- onds, CMap data (size 22283 × 6100) in 3 hours 45 minutes. The QUBIC algorithm analyzes CMap data in 2 hours 55 minutes and ExpO data in 3 hours 54 min- utes. The running time analysis was done on a 2.13 GHz Intel 2 Dual Core computer with 2GB memory.
m(cid:3)
supp(gi) =
eij
(2)
1 m
j=1
In other words, the support is the proportion of sam- ples for which the gene-vector ei. is 1. This is further extended to sets of genes. Let G(cid:2) v = {g1, . . . , gk} be the vth gene-set. For a set of gene-vectors we define their phenotype vector Cv as their element-wise logical AND:
(3)
Cv = ∧(e1., . . . , ek.)
(G(cid:2)
Methods Given an expression matrix E with genes G ={g1, g2, g3,..., gn} and samples S ={s1, s2, s3,..., sm} a bicluster is defined as b = (G’, S’) where G’ ⊂ G is a subset of genes and S’ ⊂ S is a subset of samples. DeBi identifies func- tionally coherent biclusters B ={b1, b2, b3,..., bl} in three steps. Below we describe each step in detail. An over- view of the DeBi algorithm is shown in Figure 6. The DeBi algorithm is based on a well known data mining approach called Maximal Frequent Item Set [28]. We will refer to this as Maximal Frequent Gene Set, as given by our problem definition. The pseudocode of the algorithm is in Additional file 1.
The support of the gene set is then defined as the fraction of samples for which the phenotype vector is 1. v is (c1, c2) - frequent iff its support supp | above c2.
A gene set G(cid:2) v) is larger than c1 and the cardinality |G(cid:2)
v
Page 9 of 12
Serin and Vingron Algorithms for Molecular Biology 2011, 6:18 http://www.almob.org/content/6/1/18
Figure 6 Illustration of DeBi algorithm. The algorithm is ran on two different binarized datasets. One is the binarized data based on up regulation and the other is the binarized data based on down regulation. In Step 1, seed biclusters identified within each support value going from high to low. For the binarized data based on up regulation, in the 1st iteration, red gene set with support value 10/20 is detected and excluded from the search space. Similarly, in the second and third iterations yellow and blue clusters with support values, respectively 6/20 and 4/20, are found. In Step 2, seed gene sets are improved based on genes’ association strength. Gene 15 is added to the red bicluster because the p-value returned by the Fisher exact test is smaller than a and gene 13 is deleted because the p-value returned by the Fisher exact test is higher than a. None of the discovered biclusters have an overlap of the gene × sample area of more than 50%.
Page 10 of 12
Serin and Vingron Algorithms for Molecular Biology 2011, 6:18 http://www.almob.org/content/6/1/18
When c1 and c2 are not in focus, we will simply speak of a frequent gene set. A gene set is maximally frequent iff it is frequent and no superset of it is frequent.
smaller than a. For this procedure the association prob-
ability pgi with the bicluster needs to be calculated for
each gene. However, we reduce the computational effort
using the monotonicity property of the hypergeometric
distribution. We precompute cut-off values on the con-
tingency table entries that yield a p-value just higher
than a. Let s1, IN and s1, OUT denote the number of 1’s
a gene-vector has in the bicluster samples and the num-
ber of 1’s a gene-vector has outside the bicluster sam-
ples, respectively. We find the minimal s1,
IN and
maximal s1, OUT at this border. Then, we apply Fisher’s
exact test only to those genes which have s1, IN >mins1,
IN and s1, OUT The simplest method for detecting maximally frequent
gene sets is a brute force approach in which each possi-
ble subset of G ={g1, g2, g3,..., gn} is a candidate frequent
set. To find the frequent sets we count the support of
each candidate set. The MAFIA algorithm is an efficient
implementation for finding maximally frequent sets with
support above a given threshold [28]. The search strat-
egy of MAFIA uses a depth-first traversal of the gene
set lattice with effective pruning techniques. It avoids
exhaustive enumeration of all candidate gene sets by a
monotonicity principle. The monotonicity principle
states that every subset of a frequent itemset is frequent.
It prunes the candidates which have an infrequent sub-
pattern using this property. | × |S(cid:2)
v . The In the last step we turn to the sometimes very compli-
cated overlap structure among biclusters. The goal is to
filter the set of biclusters such that the remaining ones
are large and overlap only little. The size of a bicluster is
defined as the number of genes times the number of
samples in the bicluster, |G(cid:2)
|. Two biclusters over-
v
lap when they share common samples and genes. The
size of the overlap is the product of the number of com-
mon samples and common genes. To filter out biclusters
that are largely contained in a bigger bicluster, we start
with the largest bicluster and compare it to the other
biclusters. Those biclusters for which the overlap to the
largest one exceeds L% (typically 50%) of the size of the
smaller one are deleted. This is then repeated starting
with the remaining second-largest bicluster and so on. (Ed(cid:2) In the first step of the DeBi algorithm, MAFIA is
iteratively applied to the binary matrix successively
reducing the support threshold. Initially, MAFIA is
applied to the full binary matrix Eu (Ed) with support
value (c1 )0 equal to support value of the gene with the
highest support. In iteration k, MAFIA is applied with
support value threshold of (c1)k = (c1)k−1 − 1
m
identified maximally frequent sets are added to the set
of seed gene sets B and the genes in B are deleted from
the binary matrix Eu (Ed). In each iteration MAFIA is
applied to the modified matrix Eu(cid:2)
). The process is
repeated until a user defined minumum support para-
meter is reached. 1, G(cid:2) l Choosing the optimum alpha parameter
To formulate an optimality criterion for a one requires
an inherent measure of the quality of a set of biclusters.
To this end, for a bicluster v, we define its score Iv as
the negative sum of the log p-values of the included
genes, where the individual pg is the p-value from the
Fisher exact test: (cid:4) Iv = − (log pg) (4) gε G(cid:2) v Extending and filtering the biclusters
In the second step of DeBi, the identified seed gene sets
G(cid:2)
2 . . .G (cid:2)
1 = {G(cid:2)
} are extended using a local search.
For each bicluster Bv = (G(cid:2)
v, S(cid:2)
v), v = 1,...,l, we have the
binary phenotype vector Cv= ∧(e1,...,ek) = (Cv1,...,Cvm).
The entries of Cv indicate the indices of the bicluster
samples. If Cvj = 1 ⇒ sj ∈ S(cid:2)
v, j = 1,...,m , i.e. that the
sample sj belongs to the bicluster bv. The gene gi, i =
1,..., n, is an element of gene set G(cid:2)
v if ei. is associated
with Cv. We evaluate the association strength between
the phenotype vector of a bicluster and another gene
using Fisher’s exact test on a 2 × 2 contingency table.
The cells of the contingency table count how often the
four possibilities of the phenotype vector containing a 1
or a 0 and the gene-vector containing a 1 or a 0 occur.
The Fisher’s exact test then tests for independence in
the contingency table and thus among the two vectors.
A gene gi, i = 1,..., n is added, to the gene set G(cid:2) However, this bicluster score Iv depends on the size
(number of genes × number of conditions) of the biclus-
ter and in order to make it comparable between biclus-
ters one needs to correct for the size. We compute the
expected bicluster score through a randomization proce-
dure. A large number, say 500, random phenotype vec-
tors having the same number of 1s as the bicluster has
conditions is generated. For these random phenotype
vectors a Fisher exact test p-value with respect to each
gene in the bicluster is computed. One obtains a ran-
dom Iv score by adding log p-values over the genes of
the bicluster. The mean of these random bicluster
scores is the desired estimator. Finally, a normalized NIv
score is definded by dividing Iv by this estimated mean v if the
pvalue pgi returned by the Fisher exact test is lower than
the parameter a. It gets deleted from bv if the probabil-
ity is higher than a and added to bv if the probability is Page 11 of 12 Serin and Vingron Algorithms for Molecular Biology 2011, 6:18
http://www.almob.org/content/6/1/18 (cid:4) score serves vε I (NIv). This Additional file 3: DeBi, BIMAX, ISA, OPSM, SAMBA and QUBIC
biclustering results and GO term, TFBS enrichment analysis of the
genes and conditions in biclusters on yeast data. and the total biclustering score CS is defined as the sum
of NIv normalized scores of all discovered biclusters
CS =
to distinguish
between different choices of a. The program is run
under a = {10-2, 10-3,..., 10-100} and we choose the
a that maximizes CS. Additional file 4: DeBi, ISA, OPSM, SAMBA, QUBIC biclustering
results and GO term, TFBS enrichment analysis of the genes on
DLBCL data. Additional file 5: DeBi and QUBIC biclustering results and GO term
and TFBS enrichment analysis of the biclusters on CMap data. Additional file 6: DeBi and QUBIC biclustering results and GO term
and TFBS enrichment analysis of the biclusters on ExpO data. Additional file 7: DeBi biclustering results and GO term and TFBS
enrichment analysis of the biclusters on MSigDB data. Authors’ contributions
AS developed and implemented the algorithm. AS drafted the versions of
the manuscript. MV supervised the work and development of ideas. MV
contributed with discussion of the draft versions and critical review. Both
authors have read and approved the final manuscript. Competing interests
The authors declare that they have no competing interests. Received: 14 February 2011 Accepted: 23 June 2011
Published: 23 June 2011 References
1. 2. 3. 4. In spite of efforts by many authors, comparing the
performance of biclustering algorithms is still a chal-
lenge [29]. Smaller biclusters have a higher chance to
yield a coherent GO annotation, while larger biclusters
would, of course, be more interesting to observe. Our
a threshold influences this behavior. The optimized
a threshold is smaller for larger number of samples
which limits the number of genes that get accepted into
a bicluster. 5. 6. 7. Andreopoulos B, An A, Wang X, Schroeder M: A roadmap of clustering
algorithms: finding a match for a biomedical application. Brief
Bioinformatics 2008, 10(3):297-314.
Sokal RR, Michener CD: A statistical method for evaluating systematic
relationships. University of Kansas Scientific Bulletin 1958, 28:1409-1438.
Hartigan JA, Wong MA: Algorithm AS 136: A k-means clustering
algorithm. Applied Statistics 1979, 28:100-108.
Hartigan JA: Direct Clustering of a Data Matrix. Journal of the American
Statistical Association 1972, 67(337):123-129.
Cheng Y, Church GM: Biclustering of expression data. Proc Int Conf Intell
Syst Mol Biol 2000, 8:93-103.
Ben-Dor A, Chor B, Karp R, Yakhini Z: Discovering local structure in gene
expression data: the order-preserving submatrix problem. J Comput Biol
2003, 10(3-4):373-384.
Bergmann S, Ihmels J, Barkai N: Iterative signature algorithm for the
analysis of large-scale gene expression data. Phys Rev E Stat Nonlin Soft
Matter Phys 2003, 67(3 Pt 1):031902. 8. Murali TM, Kasif S: Extracting conserved gene expression motifs from The binarization of the input data in order to obtain a
boolean matrix is another key decision in our approach.
In this we go along with many other authors and we
think that it helps in applying biclustering to gene
expression data coming from different labs or platforms.
The hope is that our method will further contribute to
establishing biclustering as a general purpose tool for
data analysis in functional genomics. 9. gene expression data. Pac Symp Biocomput 2003, 77-88.
Tanay A, Sharan R, Shamir R: Discovering statistically significant biclusters
in gene expression data. Bioinformatics 2002, 18(Suppl 1):S136-S144.
10. Prelic A, Bleuler S, Zimmermann P, Wille A, Buehlmann P, Gruissem W, 11. Hennig L, Thiele L, Zitzler E: A systematic comparison and evaluation of
biclustering methods for gene expression data. Bioinformatics 2006,
22(9):1122-1129.
Li G, Ma Q, Tang H, Paterson AH, Xu Y: QUBIC: a qualitative biclustering
algorithm for analyses of gene expression data. Nucl Acids Res 2009,
37(15):e101[http://nar.oxfordjournals.org/cgi/content/abstract/37/15/e101]. 12. Madeira SC, Oliveira AL: Biclustering algorithms for biological data analysis: a survey. IEEE/ACM Trans Comput Biol Bioinform 2004, 1:24-45.
13. Hughes TR, Marton MJ, Jones AR, Roberts CJ, Stoughton R, Armour CD, Additional material 14. Bennett HA, Coffey E, Dai H, He YD, Kidd MJ, King AM, Meyer MR, Slade D,
Lum PY, Stepaniants SB, Shoemaker DD, Gachotte D, Chakraburtty K,
Simon J, Bard M, Friend SH: Functional discovery via a compendium of
expression profiles. Cell 2000, 102:109-126.
Lamb J: The Connectivity Map: a new tool for biomedical research.
Nature reviews Cancer 2007, 7:54-60. 15. Rosenwald A, Wright G, Chan WC, Connors JM, Campo E, Fisher RI, Additional file 1: Description of selected biclustering algorithms,
description of MAFIA algorithm, protein protein interaction
networks. Additional file 2: DeBi results on synthetic data. Gascoyne RD, Muller-Hermelink HK, Smeland EB, Giltnane JM, Hurt EM,
Zhao H, Averett L, Yang L, Wilson WH, Jaffe ES, Simon R, Klausner RD,
Powell J, Duffey PL, Longo DL, Greiner TC, Weisenburger DD, Sanger WG, Page 12 of 12 Serin and Vingron Algorithms for Molecular Biology 2011, 6:18
http://www.almob.org/content/6/1/18 Dave BJ, Lynch JC, Vose J, Armitage JO, Montserrat E, Lopez-Guillermo A,
et al: The Use of Molecular Profiling to Predict Survival after
Chemotherapy for Diffuse Large-B-Cell Lymphoma. New England Journal
of Medicine 2002, 346(25):1937-1947[http://www.nejm.org/doi/full/10.1056/
NEJMoa012914]. 16. Basehoar AD, Zanton SJ, Pugh BF: Identification and distinct regulation of yeast TATA box-containing genes. Cell 2004, 116(5):699-709[http://www.
cell.com/retrieve/pii/S0092867404002053]. 17. MacIsaac KD, Wang T, Gordon DB, Gifford DK, Stormo GD, Fraenkel E: An
improved map of conserved regulatory sites for Saccharomyces
cerevisiae. BMC Bioinformatics 2006, 7:113[http://www.biomedcentral.com/
1471-2105/7/113]. 18. Harbison CT, Gordon DB, Lee TI, Rinaldi NJ, MacIsaac KD, Danford TW,
Hannett NM, Tagne JB, Reynolds DB, Yoo J, Jennings EG, Zeitlinger J,
Pokholok DK, Kellis M, Rolfe PA, Takusagawa KT, Lander ES, Gifford DK,
Fraenkel E, Young RA: Transcriptional regulatory code of a eukaryotic
genome. Nature 2004, 431(7004):99-104[http://www.nature.com/nature/
journal/v431/n7004/full/nature02800.html]. 19. Barkow S, Bleuler S, Prelic A, Zimmermann P, Zitzler E: BicAT: a biclustering 20. analysis toolbox. Bioinformatics 2006, 22(10):1282-1283.
Shamir R, Maron-Katz A, Tanay A, Linhart C, Steinfeld I, Sharan R, Shiloh Y,
Elkon R: EXPANDER-an integrative program suite for microarray data
analysis. BMC Bioinformatics 2005, 6:232. 21. Hochreiter S, Bodenhofer U, Heusel M, Mayr A, Mitterecker A, Kasim A,
Khamiakova T, Sanden SV, Lin D, Talloen W, Bijnens L, Göhlmann HWH,
Shkedy Z, Clevert DA: FABIA: factor analysis for bicluster acquisition.
Bioinformatics 2010, 26(12):1520-7[http://bioinformatics.oxfordjournals.org/
content/26/12/1520.long]. 23. 22. Hoshida Y, Brunet JP, Tamayo P, Golub TR, Mesirov JP: Subclass Mapping:
Identifying Common Subtypes in Independent Disease Data Sets. PLoS
ONE 2007, 2(11):e1195[http://dx.plos.org/10.1371%2Fjournal.pone.0001195].
Jensen LJ, Kuhn M, Stark M, Chaffron S, Creevey C, Muller J, Doerks T,
Julien P, Roth A, Simonovic M, Bork P, von Mering C: STRING 8-a global
view on proteins and their functional interactions in 630 organisms.
, 37 Database: D412-6.
Nucleic Acids Res 2009, 24. Ciocca DR, Calderwood SK: Heat shock proteins in cancer: diagnostic, prognostic, predictive, and treatment implications. Cell Stress Chaperones
2005, 10(2):86-103. 25. Grothaus GA, Mufti A, Murali TM: Automatic layout and visualization of 26. biclusters. Algorithms for molecular biology : AMB 2006, 1:15.
Keller JN, Hanni KB, Markesbery WR: Impaired proteasome function in
Alzheimer’s disease. J Neurochem 2000, 75:436-9[http://onlinelibrary.wiley.
com/doi/10.1046/j.1471-4159.2000.0750436.x/abstract]. 27. Ni XG, Zhou L, Wang GQ, Liu SM, Bai XF, Liu F, Peppelenbosch MP, Zhao P: The ubiquitin-proteasome pathway mediates gelsolin protein
downregulation in pancreatic cancer. Mol Med 2008, 14(9-10):582--9.
28. Burdick D, Calimlim M, Gehrke J: MAFIA: A Maximal Frequent Itemset
Algorithm for Transactional Databases. Data Engineering, International
Conference on 2001, 0:0443. doi:10.1186/1748-7188-6-18
Cite this article as: Serin and Vingron: DeBi: Discovering Differentially
Expressed Biclusters using a Frequent Itemset Approach. Algorithms for
Molecular Biology 2011 6:18. 29. Chia BKH, Karuturi RKM: Differential co-expression framework to quantify
goodness of biclusters and compare biclustering algorithms. Algorithms
for molecular biology : AMB 2010, 5:23. Submit your manuscript at
www.biomedcentral.com/submitDiscussion
We have proposed a novel fast biclustering algorithm
especially for analyzing large datasets. Our algorithm
aims to find biclusters where each gene in a bicluster
should be highly or lowly expressed over all the biclus-
ter samples compared to the rest of the samples. Unlike
other algorithms, it is not required to define the number
of biclusters a priori. We have compared our method
with other biclustering algorithms using synthetic data
and biological data. We have shown that the DeBi algo-
rithm provides biologically significant biclusters using
GO term and TFBS enrichment. We have also showed
the computational efficiency of our algorithm. It is
shown that it is a useful and powerful tool in analyzing
large datasets.
Implementation
The DeBi code is written in c++ programming language
for UNIX environment. The MAFIA algorithm c++
code is used for calculating the maximally frequent item
sets. The DeBi algorithm is freely available at http://
www.molgen.mpg.de/~serin/debi/main.html.
Submit your next manuscript to BioMed Central
and take full advantage of:
• Convenient online submission
• Thorough peer review
• No space constraints or color figure charges
• Immediate publication on acceptance
• Inclusion in PubMed, CAS, Scopus and Google Scholar
• Research which is freely available for redistribution