http://www.iaeme.com/IJM/index.asp
111
editor@iaeme.com
International Journal of Management (IJM)
Volume 8, Issue 1, January – February 2017, pp.111–118, Article ID: IJM_08_01_012
Available online at
http://www.iaeme.com/ijm/issues.asp?JType=IJM&VType=8&IType=1
Journal Impact Factor (2016): 8.1920 (Calculated by GISI) www.jifactor.com
ISSN Print: 0976-6502 and ISSN Online: 0976-6510
© IAEME Publication
A STUDY ON CHALLENGES OF MULTICULTURAL
TEAM MEMBERS OF IT SECTOR
M. Jayanthi
Research Scholar, Department of Management Studies,
Periyar Maniammai University, Vallam, Tanjavur, Tamilnadu, India
Dr. K.V.R. Rajandran
Professor, Department of Management Studies,
Periyar Maniammai University, Vallam, Thanjavur, Tamilnadu, India
ABSTRACT
The main purpose of this research paper is to identify the communication issues and conflicts
among the multicultural team members and effect of these challenge factors on cultural diversity.
The researcher developed a conceptual framework based on the review of literature and data
collected from the IT employees through interviews. Convenient sampling method adapted for this
descriptive study and 430 was the sample size. Data analysis had done using EFA, CFA, validity
analysis and SEM. The result confirmed that communication issues and conflicts exist among the
multicultural team members. The result revealed that cultural diversity had significant influences
on communication issues and conflicts.
Key words: Challenges among multicultural team members, Cross-cultural communication,
Cultural diversity, Conflicts, Multicultural teams.
Cite this Article: M. Jayanthi and Dr. K.V.R. Rajandran, A Study on Challenges of Multicultural
Team Members of IT Sector. International Journal of Management, 8(1), 2017, pp. 111–118.
http://www.iaeme.com/IJM/issues.asp?JType=IJM&VType=8&IType=1
1. INTRODUCTION
1.1. Scope of the Study
Multicultural team members may have various backgrounds like different speaking language, state,
country, social status, education etc. Members belonging to a particular culture’s perception and their
attitudes about human beings, the world and their ideas are very different from each other (Miroshnik,
2002). Multicultural environment offers both opportunities and challenges to the team members (Adler,
2000). Both forces of positive and negative dominations were evident. Experiencing challenges among the
team members had became a common problem. Main office may be in a continent or country and service
might require in some other continent or country. There by companies have to dependent local employees
for better services and requirements. Aligned working between these two groups become important task of
the company now. Hence, talented and capable people required to work on this sort of environment, where
both challenges and opportunities were apparent.

M. Jayanthi and Dr. K.V.R. Rajandran
http://www.iaeme.com/IJM/index.asp 112 editor@iaeme.com
1.2. Statement of the Problem
Multicultural team consists of different group of people with different backgrounds and culture. As the
culture has impact on every individual, it influences on the group behaviour, job behaviour, decision-
making process, and performance. All these processes need proper communication, when communication
becomes complex it affects the group and resulted conflicts. Conflicts create less cooperation and thereby
decrease group cohesion. Communication, conflicts, poor cooperation often leads to process losses, which
result in higher turnover and absenteeism rates (O’Reilly, 1989). The main purpose of this research paper
is to identify the challenges communication issues and conflicts faced by the multicultural team members
and its relationship with cultural diversity.
2. REVIEW OF LITERATURE
Campbell (2000) defines culture as a complex web of information that a person learns and which guides
each person’s perceptions, experiences and actions. It is not acceptable to proceed with the study of teams
as if its members are isolated from their cultural and national heritage (Earley and Gibson, 2002). A
Multicultural team is a group of employees selected from two or more countries who are brought together
to coordinate, develop, or manage some aspect of a firm’s global operations (Steers & Nordon, 2006). An
individual's behavior in an organization will chiefly guided by the outside society from which he or she
comes. It is impractical that individuals can have an effect of one and only culture (Schneider and Barsoux,
1997). Predominant problems in diverse team are due to communication challenges Horck (2006),
communication problems, and the effect of language or accent problem were frustration, distrust among
the participants (Ubaka, 2010). Mistrust among the participants, would slow down performance (Ubaka,
2010) and trust was more important for ensuring cooperation (Mariana, 2012). Members of multicultural
teams were less likely to trust one another (Turner, 1987) and heterogeneous group members trust less
their team member than homogeneous team members do (Rockstuhland and Ng, 2008).
3. RESEARCH METHODOLOGY
Objective of the study: To identify the communication issues and conflicts among the multicultural team
members and effect of these challenge factors on cultural diversity.
Hypothesis of the study: Every single line drawn between the variables in SEM represent hypotheses.
H1 H
0 -
There is no significant impact of cultural diversity on challenge factors.
H
1
- There is a significant impact of cultural diversity on challenge factors.
Area of the study: IT parks at Chennai
Sources of data: Primary data were collected from the employees through direct, phone and e-mail
interviews with pretested, structured questionnaire. The secondary data were collected from various
sources like library books, journals, research papers, thesis, reports, conferences, magazines, newspapers
and web sites.
Sampling technique: Convenience sampling technique adapted for this descriptive study. Sample size was
430.
4. DATA ANALYSIS AND STATISTICAL TECHNIQUES
4.1. Statistical Techniques
The researcher performed the data analysis using exploratory factor analysis, confirmatory factor analysis,
validity and reliability analysis and SEM for the study with aid of IBM SPSS20 and SPSS (AMOS23).
4.2
.
Socio-Categori
cal Background of IT employees
The Socio-Categorical background of IT employees showed that out of total respondents 430, 53.7% were
male and 46.3% were female employees. It showed that majority of the employees (60.2%) were belongs
A Study on Challenges of Multicultural Team Members of IT Sector
http://www.iaeme.com/IJM/index.asp 113 editor@iaeme.com
to age group of 41-50 years followed by 21-30 years (27.9%) and 31-40 years (11.9%). Majority (53.3%)
of the employees falling under 21-30 years of experiences followed by 34% of 2-10 years experience and
12.8% of 11-20 years of experience.
4.3. Diversity Factors that Affect Multicultural Team Members in IT Sector
Sub-scale items of cultural diversity impact were cultural diversity (CD1) influences multicultural team,
cultural diversity does have impact on (CD2) group behaviour (LaFromboise et al., 1993), (CD3) job
behaviour (Harris and Moran, 1987), (CD4) decision-making process and (CD5) influences performance
(Deresky, 2002). Communication is the major challenge (COM1) of multicultural team members
(Jarvenpaa and Leidner, 1999), communication challenges (COM2) leads to conflicts (Tian and Borges,
2011), communication influences (COM3) decision-making process (Cabrera and Soto, 2010),
communication influences (COM4) the knowledge sharing (Lauring & Selmer, 2011), communication
problems (COM5) reduces performances (Lauring & Selmer, 2011) were subscale items of communication
dimension. A conflict factor consists of cultural difference creates conflicts (CON1) among team members
(Pelled, 1996), (CON2) conflicts lead to poor performance (Pelled, 1996), (CON3) conflicts lead to poor
decision-making process (Tse, 1988), (CON4) conflicts lead to poor coordination (Herbsleb and Mockus,
2003) and (CON5) conflicts lead to poor cooperation (Karjalainen & Soparnot, 2012).
4.4. Exploratory Factor Analysis (EFA)
Exploratory factor analysis extraction was done using principal axis factoring and rotation was done using
Promax with Kaiser Normalization (Ford, MacCallum and Tait, 1986).
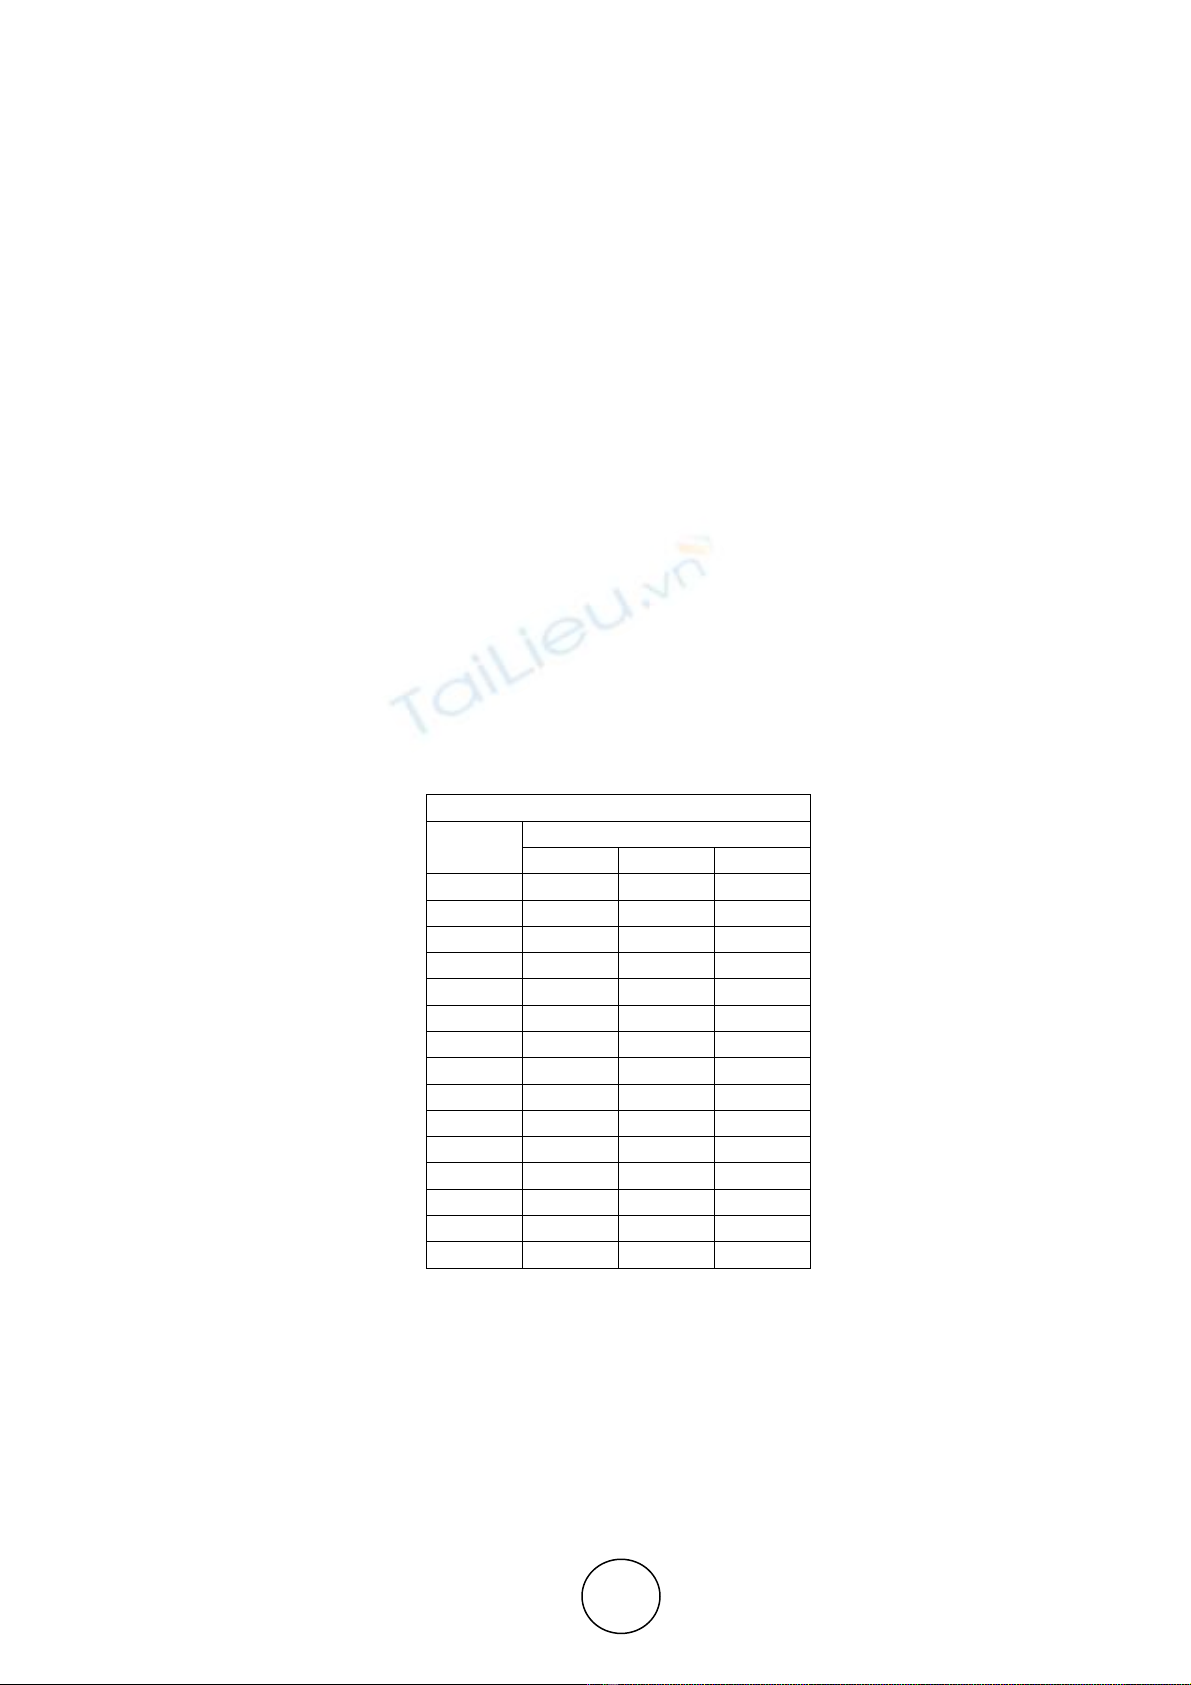
Table 1 Exploratory factor analysis
Pattern Matrix
a
Factor
1 2 3
CD1 .923
CD2 .712
CD3 .944
CD4 .632
CD5 .911
COM1 .916
COM2 .649
COM3 .955
COM4 .562
COM5 .847
CON1 .911
CON2 .589
CON3 .555
CON4 .915
CON5 .631
The percentage of the total item variance for model was explained by 70.83%. The variance value was
more than the recommended value of 60% indicated the further EFA can be done. A significant (p<0.05)
KMO value 0.755, Chi-square value 7629.237 with df 190 arrived using KMO test. A significant result
(Sig. < 0.05) of KMO value more than 0.6 indicated that variables were related to one another and
meaningful EFA could be performed. The Table 1 described the items loaded after the factor analysis. All
the items are exactly loaded to the corresponding factor shows that all the items can be retained for further
study. Ford et al., (1986) suggested that factor loadings more than 0.40 criterion levels appear to be
meaningful. As all the factor loading values are more than 0.4 and loaded to their relevant scales all these
15 items were retained for the further studies.
M. Jayanthi and Dr. K.V.R. Rajandran
http://www.iaeme.com/IJM/index.asp 114 editor@iaeme.com
4.5. Confirmatory Factor Analysis (CFA)
Confirmatory factor analysis explained the a priori relationships and distinctions among variables or scales.
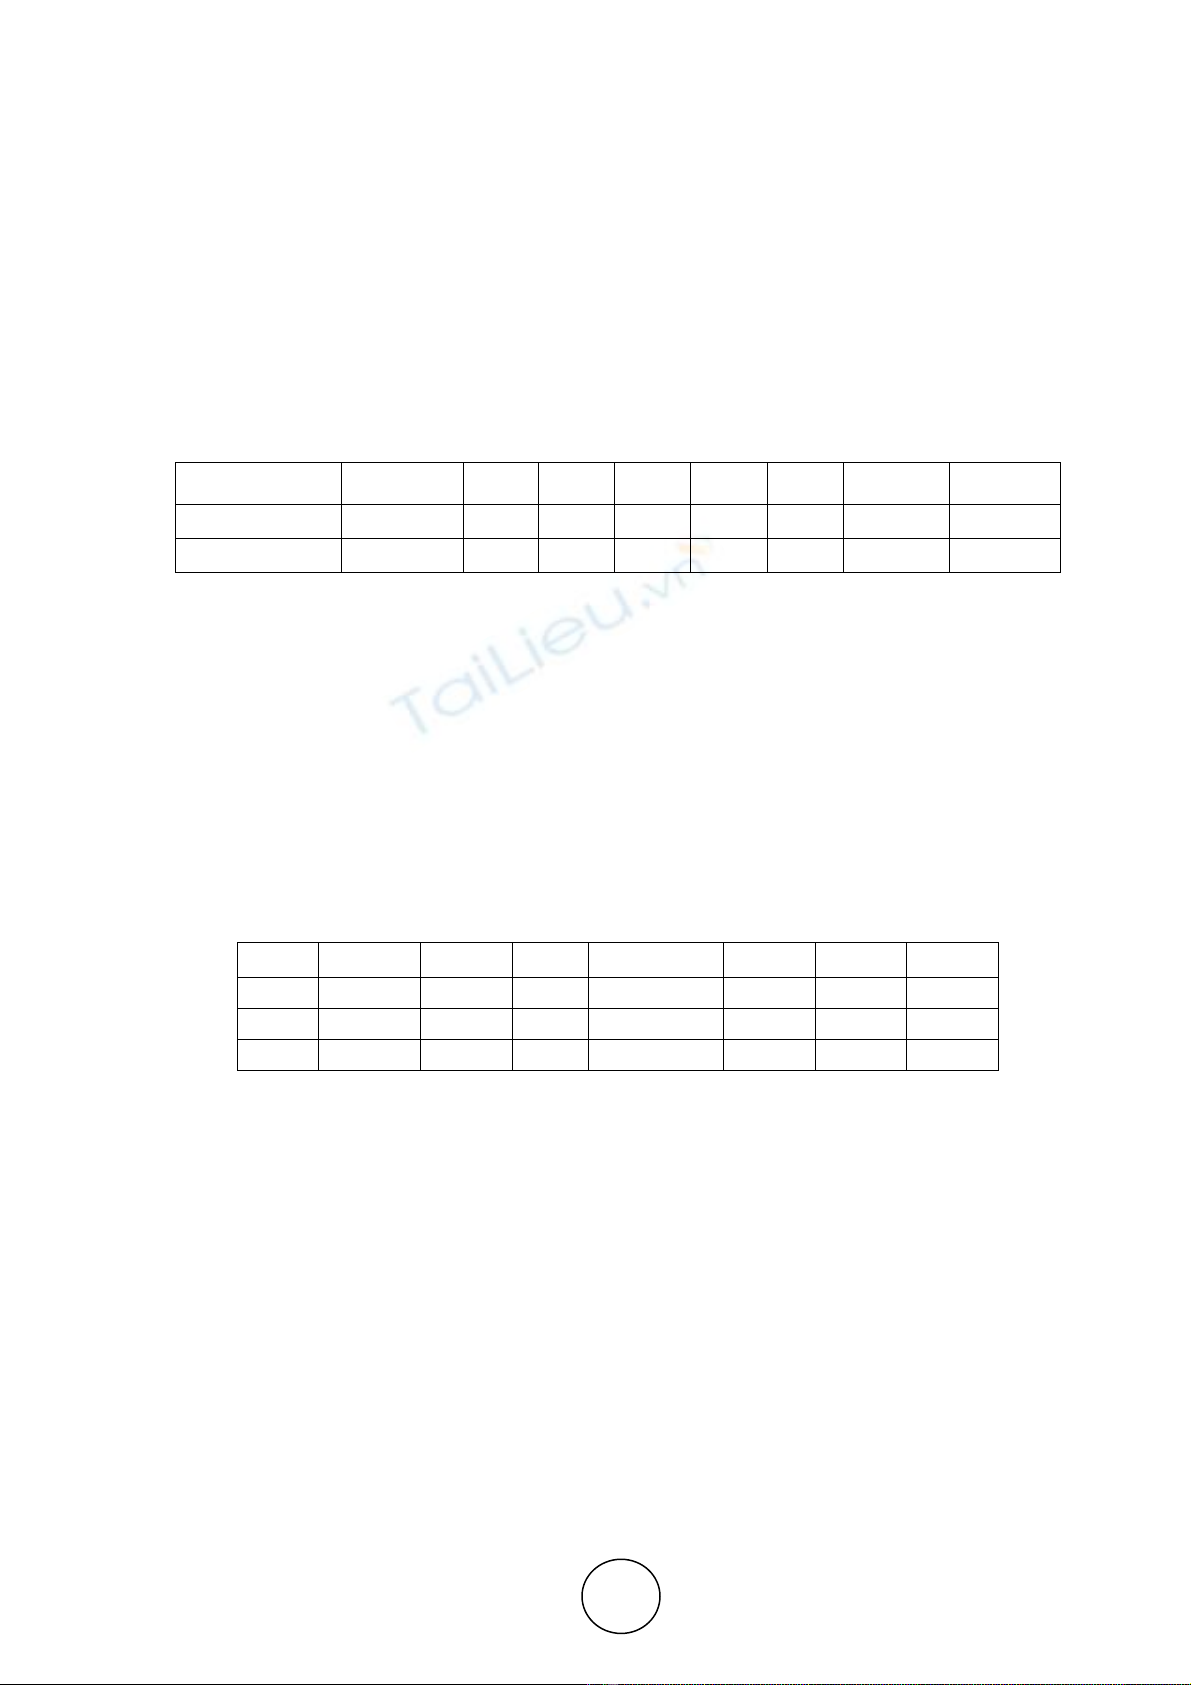
In addition, goodness of fit of items needs to be measured using confirmatory factor analysis (Gaskin,
2016). The recommended threshold values for goodness of fit are cmin/df<3, p-value >.05, CFI>.95,
GFI>.95, AGFI>.80 RMR<.09 RMSEA<.05 or .08 and PCLOSE>.05 (Hu and Bentler (1999). Table 2
described the confirmatory factor analysis result. CFA values for the structural equation model was
cmin/df=1.288, p-value=0.043, CFI=0.996, GFI=0.970, AGFI=0.954 RMR=0.015, RMSEA=0.027 and
PCLOSE= 0.999. Insignificant p value (p>0.001) with all other values satisfied the required threshold
values showed that model had goodness of fit.
Table 2 Fit statistics of Measurement Model
Fit statistic CMIN/DF P CFI GFI AGFI RMR RMSEA PCLOSE
Recommended <3 >.05 >.95 >.95 >.80 <.09 <.05 >.05
Model fit 1.288 0.043 0.996 0.970 0.954 0.015 0.027 0.999
4.6. Validity and Reliability
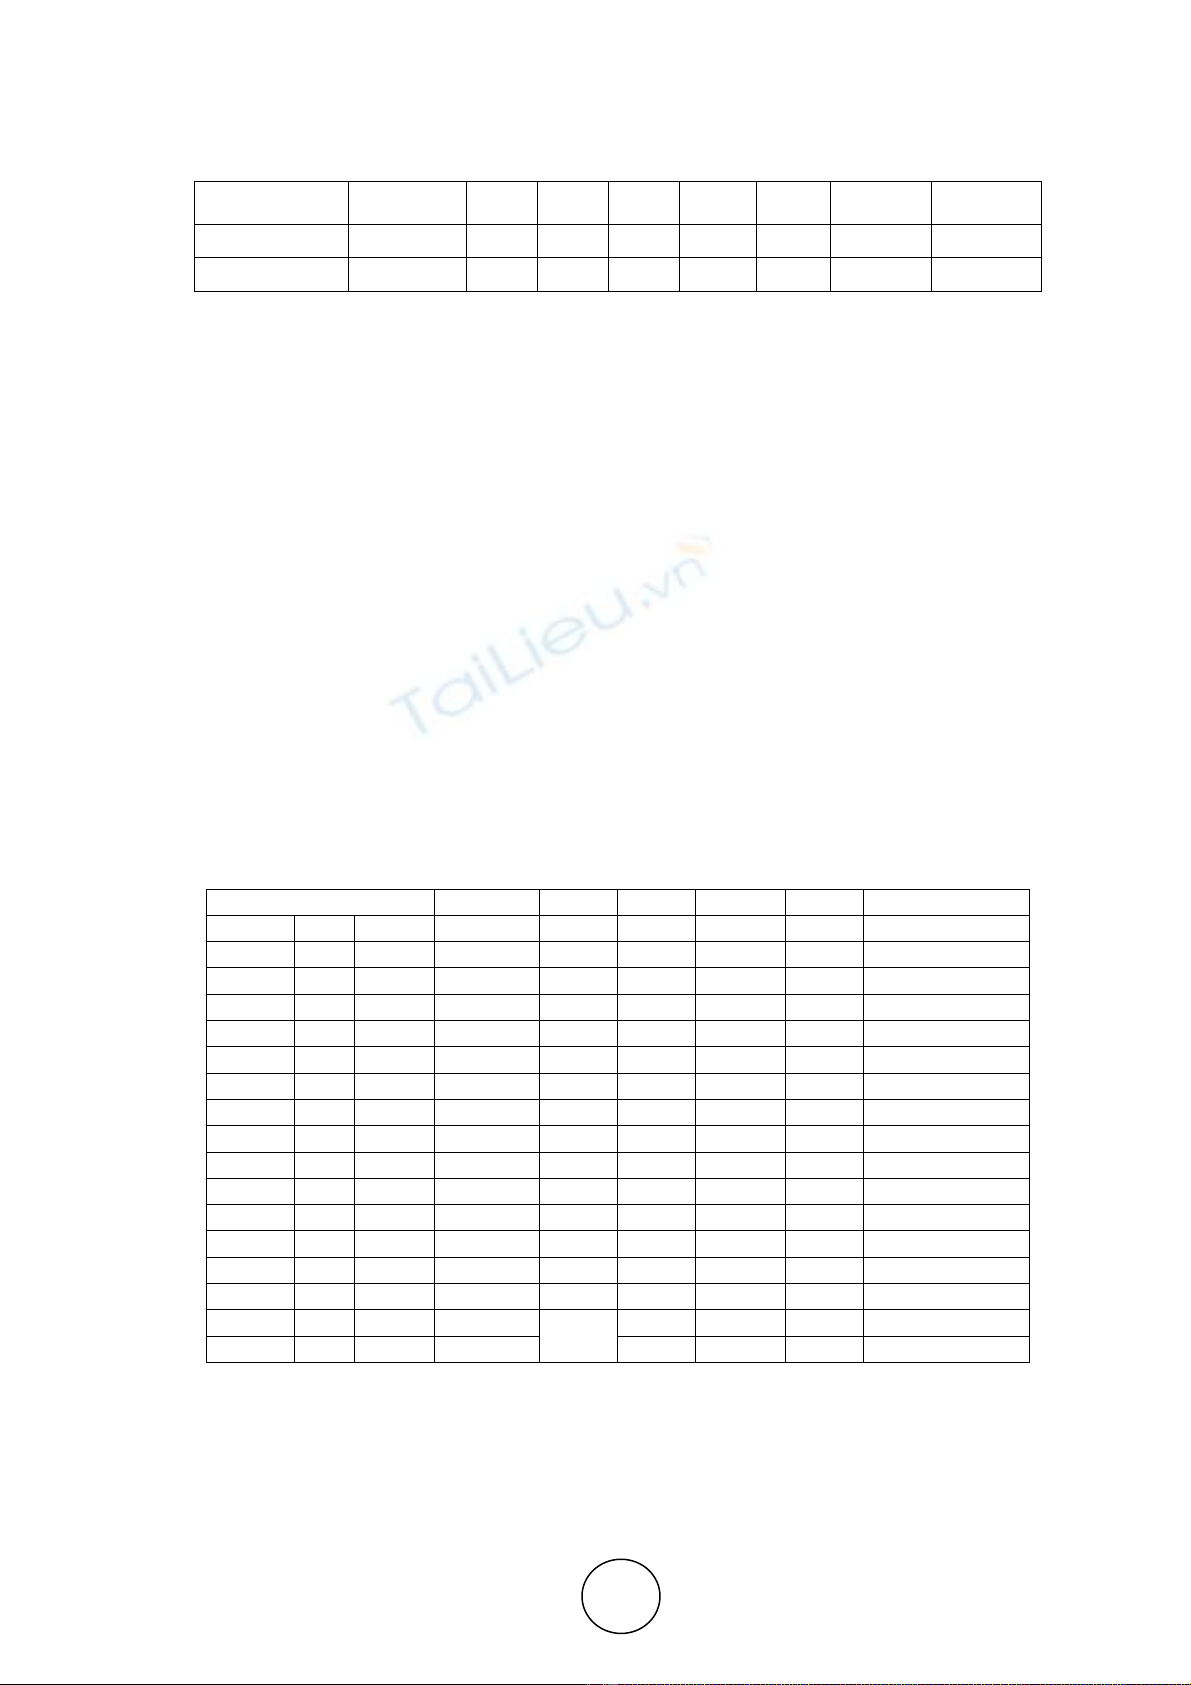
The Table 3 shows the result of validity and reliability test. Reliability of the variables was tested using
Cronbach’s alpha method. Nunnally (1978) suggested that value more than 0.7 shows good internal
consistency. As the entire alpha values are more than 0.7, it confirmed the good internal consistency of the
variables corresponding to their construct. Convergent validity is arrived when all AVE values are more
than 0.5 (Hair et.al, 2010). The Table 3 showed that AVE for all the constructs was more than 0.5 and
established the convergent validity. Discriminant validity was arrived using inter- construct correlations. If
square root of AVE greater than inter-construct correlations then it establishes discriminate validity
(Malhotra and Dash, 2011). Table 3 showed that square root of AVE is greater than all other values.
Hence, reliability, convergent validity and discriminant validly supported the establishment of model.
Table 3 Validity and Reliability table
CR AVE MSV MaxR(H) CD CON COM
CD 0.907 0.674 0.017 0.996 0.821
CON 0.836 0.530 0.017 0.997 0.131 0.728
COM 0.886 0.625 0.002 0.998 0.048 -0.010 0.790
4.7. Structural Equation Model
Measurement model was converted into structural model. Keeping cultural diversity as a dependent
variable and challenges factors as independent variables structural equation model was developed using
AMOS 23. All lines connecting all the latent variables are indicating hypothesis. Using SEM proposed
hypothesis were tested. The full structural equation model was measured and the hypotheses to be tested
related to the pattern of causal structure linking with latent variables were done.
4.7.1 Fit statistics of structural equation model
Structural model’s validity was established as it was done for the measurement model. A new
covariance matrix was computed for SEM. Measurement model is different from the SEM, since the
measurement model constructs are correlated, where as for structural model the relationships were
assumed zero. Table 6 shows the fit indices of the structural model. As all the values are satisfying the
prerequisite of threshold values, it shows that model has goodness of fit. Hence, it confirms that the
proposed research model fits the data well.
A Study on Challenges of Multicultural Team Members of IT Sector
http://www.iaeme.com/IJM/index.asp 115 editor@iaeme.com
Table 4 Fit statistics of SEM
Fit statistic CMIN/DF
P CFI GFI AGFI
RMR
RMSEA
PCLOSE
Recommended
<3 >.05 >.95 >.95 >.80 <.09 <.05 >.05
SEM Fit 1.314 0.032
0.996
0.970
0.954 0.015 0.027 0.999
CFA values for the structural equation model was cmin/df=1.314, p-value=0.032, CFI=0.996,
GFI=0.970, AGFI=0.954 RMR=0.015, RMSEA=0.027 and PCLOSE= 0.999. Insignificant p value
(p>0.001) with all other values satisfied the required threshold values showed that model had goodness of
fit.
4.8. Hypothesis Testing
The hypothesized research model revealed good fit with observed data. Standardised regression weights
with significance at p< 0.001 provided support to the hypotheses proposed. The Table 5 described the
standardized regression weights and hypotheses results. The Table 5 described the path coefficient of
cultural diversity impact with (CD1) cultural diversity influences multicultural team (0.964), (CD2)
cultural diversity does have impact on group behaviour (573), (CD3) job behaviour (0.999), (CD4)
decision-making process (0.511) and (CD5) influences performance (0.909) were with a high significance
P-value (P<0.001). Highly significant positive direct effect of cultural diversity impact on its subscale
items showed that multicultural team members had impact of cultural diversity on the team members. The
Table 5 described the path coefficient of communication issues with (COM1) major challenges (0.951),
(COM2) leads to conflicts (0.558), (COM3) influences decision-making (0.996), (COM4) influences
knowledge sharing (0.489) and (COM5) reduces performances (0.822) are with a high significance P-value
(P<0.001). Highly significant positive direct effect of communication issues on its subscale items showed
that multicultural team members had experienced communication issues.
Table 5 Standardised Regression Weights, P-values, and null hypotheses
Hypothesis paths Estimate
R2 S.E. C.R. P H
0
CD1 <--- CD 0.964 0.93 Rejected
CD2 <--- CD 0.573 0.328 0.039 13.992 *** Rejected
CD3 <--- CD 0.999 0.998 0.015 67.913 *** Rejected
CD4 <--- CD 0.511 0.261 0.045 12.131 *** Rejected
CD5 <--- CD 0.909 0.826 0.023 38.734 *** Rejected
COM1 <--- COM 0.951 0.905 0.045 27.017 *** Rejected
COM2 <--- COM 0.558 0.312 0.052 13.438 *** Rejected
COM3 <--- COM 0.996 0.993 0.044 28.487 *** Rejected
COM4 <--- COM 0.489 0.239 0.056 10.797 *** Rejected
COM5 <--- COM 0.822 0.676 Rejected
CON1 <--- CON 0.959 0.92 0.100 14.752 *** Rejected
CON2 <--- CON 0.524 0.274 0.088 9.666 *** Rejected
CON3 <--- CON 0.423 0.179 0.070 9.188 *** Rejected
CON4 <--- CON 0.956 0.914 0.103 14.752 *** Rejected
CON5 <--- CON 0.603 0.364 Rejected
CD <--- COM 0.048 0.019 0.060 0.991 0.321 Not Rejected
CD <--- CON 0.130 0.069 2.617 0.009 Not Rejected
The Table 5 showed the path coefficient of cultural difference conflicts with (CON1) interpersonal
conflicts (0.959), (CON2) poor performance (0.524), (CON3) decision-making process (0.423), (CON4)
poor coordination (0.956) and (CON5) poor cooperation (0.603) were with a high significance P-value
(P<0.001). Highly significant positive direct effect of cultural difference conflicts on its subscale items
showed that multicultural team members had experienced cultural difference conflict issues.