Table of Contents
1.
EFFECT OF OCR AND CONFINING PRESSURE ON
SOIL PROPERTIES
Following gives the effect of OCR on the strength parameters of the cohesive soil and confining pressure on the non cohesive soil.
1.1 Effect of OCR on Soil Strength Parameter ( c
Φ SOIL )
1 | P a g e
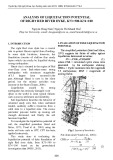
OCR of soil is defined as the highest stress experienced by the soil divided by the current stress. Following are the chart showing the effect of OCR on the ratio of the maximum deviator stress to the confining stress, angle of internal friction and cohesion of the soil (fig. 1.1).
In the present study, all soil samples were tested after being subjected to different initial consolidation pressure. The initial consolidation pressures (σ0’) applied to the soil sample were 50kPa, 200kPa and 400kPa. It was found that with increase of over consolidation ratio increases, the maximum deviator Stress/σc’ ratio (σc’=confining pressure), angle of internal friction and cohesion value increases.
This effect is verified by two separate experiments. Experiments were carried on the normally consolidated soil and Over consolidated soil.
Please note that for Normally consolidated soil OCR value is 1 and for over consolidated soil the OCR >1.
2 | P a g e
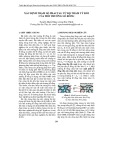
Figure 1.2 represents Triaxial Test results on normally consolidated and over consolidated soil.
fig 1.2 Failure envelope for (a) Normally consolidated and (b) overconsolidated clay from consolidated drained triaxial test. (Das B.M., “Advanced Soil Mechanics”)
The value of c is obtained by drawing a common tangent to Mohr’s circle which is Mohr coulomb’s envelope. In figure 1.2(a), it is clear that in normally consolidated clay the cohesion is zero. But when over consolidated clay as shown in figure 1.2(b) the failure envelope makes an intercept with the vertical giving cohesion value. Thus as the OCR value increase, the increase in the cohesion value is observed.
3 | P a g e
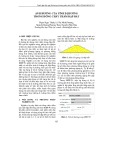
Fig 1.3 Failure envelope of soil with a preconsolidation pressure σc’. (Das B.M., “Advanced Soil Mechanics”)
The change in the angle of internal friction is verified in the following experimental observation. Please refer figure1.3. If a soil is initially consolidated by an encompassing chamber pressure of σc=σc’, and allowed to swell under reduced chamber pressure of σ3=σ3’, the specimen will be overconsolidated. The failure envelope obtained from the consolidated drained triaxial tests of this type of specimen has two distinct branches. Portion ‘ab’ of the envelope has flatter slope with a cohesion intercept and portion ‘bc’ represent the normally consolidated soil with zero cohesion. Thus as the soil turns from overconsolidated to normally consolidated or the OCR value decreases, the angle of internal friction of the soil is increasing.
Effect of OCR on the Elastic modulus of soil:
The following correlation gives relation between the soil elastic modulus and undrained shear strength of soil:
Es = Kc.Cu
4 | P a g e
Kc = correlation factor (Figure 1.4) Cu = undrained shear strength, tsf
5 | P a g e
Fig. 1.4: Correlation factor based on OCR (www.geotechnicalinfo.com/youngs_modulus.html)
1.2 Effect of confining Pressure on StressStrain Behaviour
(Cohesionless Soil)
Fig. 1.5. Stress Ratio ~ Axial Strain and volumetric Strain ~ Axial strain relationship from h =σ constant tests starting from isotropic Stress State (Sheared Airdried; ε0=0.125% per minute) (Yasin, S.J.M and Tatsuoka, F., March16&17, 2006 “StressStrain Behaviour of a Micacious Sand in plane Strain condition”, Geotechnical Symposium in Roma )
6 | P a g e
Figure 1.5 shows the effect of initial density and confining stress on the stressstrain behavior of soil where σh’ or σh = minor principal stress or confining pressure = constant’. The starting point
1. Test J319C with dense initial state and low confining stress show sharp peak in ‘axial
of each curve correspond to isotropic stress state of either (σh)c = 100 KPa or (σh)c = 400 KPa. The specimens were air dried. The continuous lines represent the curve obtained for the test on dense sand and the dotted for loose sand. Following are the observation:
2. On the other hand test J318C with dense initial state and high confining pressure showed a more ductile behavior without any sign of dilation even at peak state that resemble the volume change behavior of loose specimens.
stress~axial strain’ relation and sample also starts dilating at peak stress level and still εvol is positive (i.e. the volume is lower than the initial volume).
Fig 1.6 Deviator Stress and Axial Strain confining Pressure of 50 kPa, 200 kPa and 400 kPa Sivadass, T., Lee, C.Y. & Karim M.S.A, 2003, “ Behavior of a tropical residual soil”, ISBN 90 5809 604
7 | P a g e
Thus dense sand at high confining stress may behave like a loose sand at low confining stress. Figure 1.6 verifies the observation.
Effect of confining pressure on the Elastic modulus of soil:
Fig 1.7 Relation between the initial elastic modulus and confining pressure (JuiPin Wang and Hoi I. Ling, Mohri, L., 16 & 17 March 2006, “Stress Strain Behaviour Of Compacted Sand Clay Mixture”, Geotechnical Symposium in Roma)
8 | P a g e
Figure 1.7 shows that Elastic modulus of unsaturated specimen at higher confining pressure has high elastic modulus. Generally the initial elastic modulus increased logarithmically with increase of confining pressure.
2.
YOUNG'S MODULUS OF SOIL
2.1 Introduction
The modulus of elasticity or Young's modulus of a soil is an elastic soil is useful for a variety of applications within geotechnical engineering including shallow foundations, deep foundations and slope stability or retaining structures
Young's soil modulus, Es, may be estimated from empirical correlations, laboratory test results on undisturbed specimens and results of field tests. Laboratory tests that may be used to estimate the soil modulus are the triaxial unconsolidated undrained compression or the triaxial consolidated undrained compression tests. Field tests include the plate load test, cone penetration test, standard penetration test (SPT) and the pressuremeter test.
2.2 Factors influencing Elastic Modulus of soil
Soil with closely packed particles tends to have a higher modulus. This can be determined by looking at the soil's dry density or porosity. However, two soil samples can have the same dry density but different structures, like loose or dense, and thus have different moduli.
Water content also impacts moduli. At low water contents the water binds the particles, increases the stress and suction between the particles and leads to a high soil moduli. This is especially apparent when considering the stiffness of dried clay. However, this does not hold true for coarse grain soils. If water content rises too much, the particles are pushed apart and the modulus is reduced.
If the soil has been subjected to stress in the past, it will impact the modulus. An over consolidated soil will generally have a higher modulus than the same normallyconsolidated soil.
9 | P a g e
Soils may see cementation, or a glue effect, between particles from either low water content or chemical cementation developed at contacts. This cementation leads to an increase in modulus.
2.3 Assessment of Elastic Modulus of soil
1. California Bearing Ratio (CBR)
2. Standard Penetration Test (SPT)
3. Static Cone Penetration Test (SCPT)
2.3.1 California Bearing Ratio (CBR)
The most useful geotechnical data with which the Elastic modulus of soil can be derived by correlation are as follow:
Fig 2.1 Approximate correlation between CBR and long term Elastic modulus
(Design applications of raft foundation By J.A. Hemsley)
Figure 2.1 gives correlation between CBR and long term Elastic modulus. The short term elastic modulus may be derived from the equation
Es (Long Term) = Es (Short Term) x β
10 | P a g e
β Where the value of is as found from the table below:
Soil Type Gravel Sand Silt, Silty clay Stiff clay Soft clay Factor β 0.9 0.8 0.7 0.6 0.4
Alternatively the value of Subgrade modulus E value, in MPa, may be found using the following convention formula:
E = 10.3 CBR
To find E based on modulus of Subgrade reaction, k, the equation is:
E = 26 k1.284
2.3.2 Standard Penetration Test (SPT)
The above conversation is provided by the FAA.
Fig 2.2 Correlation between short term young’s modulus, SPT value and plasticity index
11 | P a g e
(Design applications of raft foundation By J.A. Hemsley)
Figure 2.2 gives correlation between young’s modulus of soil, SPT values and plasticity index. For sands and Gravel PI = 0.
NAVFAC DM7.1, 1892 proposed following approximate correlation between soils young’s modulus and SPT value for cohesionless soil (Geotechnical Engineers Portable Handbook, Robert W. Day):
100 kPa) Es/N ≈ (tsf 4
7
10
12 Cohesion less soil type Nonplastic silty sand or silt sand mixtures Clean, fine or medium sands Coarse sand and sand with little gravel Sandy gravel and gravel
Fig 2.3 Correlation between blow count and modulus of sand Geotechnical and Geoenvironmental engineering handbook by R.K. Rowe
ν
12 | P a g e
The above correlation is suggested by D’Appolonia et al (1970), ’ is the Poisson’s ratio of the soil.
2.3.3 Static Cone Penetration Test (SCPT)
The correlation between short term young’s modulus and SCPT/CPT value is given by
Es = qcα
α is modulus correlation factor as given in the
Where, qc static cone penetration resistance and table below:
Sand
Soil type loose medium dense dense
highly plastic Factor ( )α 5 8 10 12 15 20 Silt Silty clay Clay
Geotechnical and Geoenvironmental engineering handbook by R.K. Rowe suggests following simple correlation between SCPT value and Youngs modulus:
For Long and Strip footing L/B > 10, Es = 3.5 qc. For Axisymmetric footings or L/B = 1, Es = 2.5 qc
13 | P a g e
Following correlation is suggested between SPT, CPT and elastic modulus (Table 56, Foundation Analysis and Design, Bowels J.E. ) :
Following range of values are proposed for the Poisson’s ratio and Elastic modulus (Das, Braja M., “Principles of Foundation Engineering”)
Poisson’s Ratio 0.2–0.4 Soil Soft Clay
Soil Loose Sand Medium Sand 0.25–0.4 Hard Clay
Dense Sand 0.3–0.45
Loose Sand Dense Sand 0.2–0.4 Es (kPa) 1725–3450 5860– 13,800 10,350– 27,600 34,400– 69,000
14 | P a g e
Silty Sand Soft Clay 0.15–0.25
Medium Clay 0.2–0.5
CPT (Unit of qc) Es=(2 to 4)qc Es=2(1+Dr2)qc
Es=(3 to 6)qc Es=(1 to 2)qc
SPT (KPa) Es = 500(N + 15) Es = 18,000 + 750N Es = (15,000 to 22,000) lnN Es = 320 (N+15) Es = 300 (N+6) Es = 1,200 (N+6) Es = (6 to 8)qc
Clayey sand Silty sand Gravelly sand Soft clay
A separate and simplified relation between SPT, CPT and elastic modulus is provided in “Practical Foundation Engineering Handbook”, McGrawHill: SOIL Sand
2.4 Relation Between soil Elastic Modulus (Es) and Depth
As per Gibson Method the Elastic Soil modulus increases linearly with depth in the form:
Es = E0 + kE . Z
Where, E0 KE Z : : : Value of soil modulus directly beneath the foundation base (z = 0) Rate of increase of modulus with depth (units of E per unit depth) and Depth
This relation holds good for both vertical and lateral soil elastic coefficient.
15 | P a g e
Cohesionless soil and normally consolidated clay are two cases where the stiffness is zero at the surface and increases rather linearly with depth. The value is Es for some overconsolidated clay and rocks are approximately constant throughout the depth (Section 3.2.3, “Single pile and pile group under lateral loading”, Reese, L.C. and Van Impe W.F.). in Table 3.7 is suggested the following range for Kpy (KE for lateral load) for laterally loaded piles in sand.
Relation between horizontal soil elastic Modulus and soil Young’s Modulus (as per Section 3.2.4.1, “Single pile and pile group under lateral loading”, Reese, L.C. and Van Impe W.F.) is given below:
Where,
Elastic modulus
horizontal soil Soil Elastic modulus Poisson’s ratio Influence coefficient (approximately 1.2) Epy Es ν Ip : : : :
ξ ≈ Es.
The value of can be approximated to 1.0 on the conservative side. Hence, Epy Hence same relation as mentioned above in table 3.7 can be assumed for soil elastic modulus as well. Thus Kpy in the above table can be assumed to be equal to Ks on the conservative side.
The weighted average Es of the soil can be obtained using formula:
Where,
16 | P a g e
E1, E2, E3, E4.. En are the Elastic modulus of different Layer of soil. H1, H2, H3, H4.. Hn are the thickness of each Layer of soil. H is the total thickness of the soil.
3.
REFERENCES
8. Hoe I. Ling, Luigi Callisto, Dov Leshchinsky, Junichi Koseki, “Soil stressstrain
1. Bowels J.E. , “Foundation Analysis and Design”. 2. Das B.M., “Advanced Soil Mechanics”. 3. Das, Braja M., “Principles of Foundation Engineering”. 4. Day, R. W., “Geotechnical Engineers Portable Handbook”. 5. eHow . com (http://www.ehow.com/list_7590255_elasticmodulussoils.html) 6. Geotechnical Info . com (http://www.geotechnicalinfo.com/youngs_modulus.html) 7. Hervé Di Benedetto, “Deformation characteristics of Geomaterials”.
behavior: measurement, modeling and analysis”.
9. J.A. Hemsley, “Design applications of raft foundation”. 10. JuiPin Wang and Hoi I. Ling, Mohri, L., 16 & 17 March 2006, “Stress Strain Behaviour
Of Compacted Sand Clay Mixture”, Geotechnical Symposium in Roma
11. NAVFAC DM7.1, 1892. 12. Paul W. Mayne, Harry G. Poulos (June, 1999), “Approximate displacement influence
factors for elastic shallow foundations”, Journal Of Geotechnical And Geoenvironmental Engineering, 453460.
5809 604.
18. Yasin, S.J.M and Tatsuoka, F., March16&17, 2006 “StressStrain Behaviour of a Micacious Sand in plane Strain condition”, Geotechnical Symposium in Roma
17 | P a g e
13. “Practical Foundation Engineering Handbook”, McGrawHill. 14. Robert W. Day , “Geotechnical Engineers Portable Handbook”. 15. Reese, L.C. and Van Impe W.F., “Single pile and pile group under lateral loading”. 16. R.K. Rowe, “Geotechnical and Geoenvironmental engineering handbook”. 17. Sivadass, T., Lee, C.Y. & Karim M.S.A, 2003, “ Behavior of a tropical residual soil”, ISBN 90


![Bộ câu hỏi lý thuyết Vật lý đại cương 2 [chuẩn nhất/mới nhất]](https://cdn.tailieu.vn/images/document/thumbnail/2025/20251003/kimphuong1001/135x160/74511759476041.jpg)
![Bài giảng Vật lý đại cương Chương 4 Học viện Kỹ thuật mật mã [Chuẩn SEO]](https://cdn.tailieu.vn/images/document/thumbnail/2025/20250925/kimphuong1001/135x160/46461758790667.jpg)