Nong Lam University, Ho Chi Minh City 139
The Journal of Agriculture and Development 23(Special issue 1) www.jad.hcmuaf.edu.vn
Evaluating and predicting the impact of land use and land cover change on land surface
temperature in Lac Duong district, Lam Dong province, Vietnam
Phuong T. Nguyen*, Vuong K. Trinh, Hien T. D. Tran, Trinh N. T. Ton, Lan T. T. Nguyen,
& Anh N. Nguyen
Faculty of Land Resource and Agricultural Environment, University of Agriculture and Forestry, Hue Univer-
sity, Hue, Vietnam
ARTICLE INFO ABSTRACT
Research Paper
Received: August 06, 2024
Revised: October 04, 2024
Accepted: October 07, 2024
Keywords
CA-ANN model
Lac Duong district
Land surface temperature
Land use land cover
Landsat
*Corresponding author
Nguyen Thuy Phuong
Email:
ntphuong.huaf@hueuni.edu.vn
Land use and land cover (LULC) change is a key factor influencing
land surface temperature (LST) dynamics. This change reflects
partly global warming and climate change at local and regional
scales. This study aimed to evaluate the effect of LULC on LST
change in Lac Duong mountainous district, Lam Dong province
in the past 10 years (2013 - 2023), and predict the LST change in
2030. The study used satellite image data from Landsat 8 and 9
OLI to build LULC and LST maps and used the CA-ANN model
to predict the LST map. The results showed that the forest land
had the LST below 25Β°C, with the below 20Β°C LST area correlated
negatively with the forest land area, while 20 - 25Β°C LST correlated
positively, especially at the temperature of 22 - 25Β°C (R2 = 0.97).
The 22 - 25Β°C and 30 - 35Β°C temperature levels (R2 = 0.76 and R2
= 0.86) correlated sharply with the crop land area. The LST levels
between 30 - 40Β°C reflected the built-up land and bare land with
the highest correlation of R2 = 0.68 and 0.88, respectively. The LST
level 20 - 22Β°C represented the water body area (R2 = 0.87). The
LULC changes had an impact on the LST change in the past 10
years in Lac Duong district. While the forest land area decreased
slightly by 0.5%, the cool LST area fell considerably by 10.5%
compared to 10 years ago. An almost doubling of the cropland area
also led to a doubling in the 25 - 35Β°C LST areas. In addition, the
35 - 40Β°C LST level started to happen in several regions. The LST
change was predicted to keep increasing in 2030. The temperature
was predicted to increase by 2 - 3Β°C with a maximum temperature
of 42Β°C.
Cited as: Nguyen, P. T., Trinh, V. K., Tran, H. T. D., Ton, T. N. T., Nguyen, L. T. T., & Nguyen, A.
N. (2024). Evaluating and predicting the impact of land use and land cover change on land surface
temperature in Lac Duong district, Lam Dong province, Vietnam. The Journal of Agriculture and
Development 23(Special issue 1), 139-154.
140 Nong Lam University, Ho Chi Minh City
The Journal of Agriculture and Development 23(Special issue 1) www.jad.hcmuaf.edu.vn
the future LULC trends to 2050 was increasing
urban and crop land.
Increasing temperature occurs not only in
urban areas but also in rural and mountainous
areas. However, research on LST changes
in these areas is still limited. Assessing the
impacts of LULC changes on LST changes
helps to predict the increasing trend of LST.
Thus, managers can evaluate past decisions,
and better understand the impacts of current
decisions before implementation (NOAA, 2024).
It helps managers develop strategies to balance
conservation, and handling conflicts between
usage and development pressures. LULC and
LST maps can be produced by satellite imagery
data. Seyam et al. (2023) identified LULC
using remote sensing and GIS approach in
Mymensingh, Bangladesh with good accuracy
from 87.2% to 89.6%.
Lam Dong is located in the Central Highlands
and has favorable climate and land conditions
for agricultural and forestry development and
tourism development. However, Lam Dong is
facing some environmental problems related to
urban planning and development, deforestation,
and landscape destruction. As a mountainous
district in the north of Lam Dong, Lac Duong has
forest land accounting for 89% of the total natural
area, thus, it plays a major role in regulating the
climate and creating landscapes for the whole
province. The massive use of greenhouse systems
on agricultural and forestry lands, and land use
change are becoming more and more complicated
in Lac Duong district. Therefore, to provide a
more scientific basis and properly assess the
ongoing negative environmental impacts, this
study aims to assess the impact of LULC changes
on LST in Lac Duong district during the 2013 -
2023 period and forecast LST changes in 2030.
1. Introduction
Changes in land use and land cover (LULC)
impact directly on the surface biomass - the
largest source and sink of terrestrial carbon (Pan
et al., 2011), which helps to balance atmospheric
CO2. Therefore, LULC is one of the main drivers
for limiting global warming and other aspects of
climate change (Sudhakar & Kameshwara, 2010).
Land surface temperature (LST) is the skin
temperature of the ground derived from solar
radiation (Li et al., 2023). The LST measures the
radiative temperature of the vegetation canopy
and the ground (Weng et al., 2004; Carrillo-
Niquete et al., 2022). The LST is a crucial
geophysical parameter of climate and biosphere
related to surface energy, ecosystem health, and
agricultural production (Bhunia et al., 2021; Li
et al., 2023). Global temperature varies from
-25 to 45Β°C (NASA, 2024). Monitoring LST
dynamics helps assess atmosphere-land surface
exchange processes in models and provides
valuable surface condition data when combined
with other physical properties such as vegetation
and soil moisture (ESA, 2024). Land surface
temperature is directly affected by LULC.
The LULC change is an inevitable activity of
urbanization and socio-economic development.
It has been happening worldwide (Rahman et al.,
2017; Chang et al., 2018; Baig et al., 2022) and in
Vietnam (Trinh & Cao, 2014; Hoang, 2016; Lai &
Pham, 2018), leading to an increase in LST at the
regional and global scales. Nyatuame et al. (2023)
assessed an increase in settlement and cropland
in the past and predicted a decrease in crop land
and vegetation cover in Ghana in 2030 and 2050.
Selmy et al. (2023) used Landsat images and CA-
Markov Hybrid to analyze and predict LULC
changes in arid regions. The results indicated that
the accuracy of LULC categories was quite high
with Kappa coefficients > 0.7. The simulation of
Nong Lam University, Ho Chi Minh City 141
The Journal of Agriculture and Development 23(Special issue 1) www.jad.hcmuaf.edu.vn
temperate climate with temperatures ranging
from 11 - 27Β°C and an average total rainfall
of 1,700 - 1,800 mm, so it is mild and cool all
year round. High mountain terrain (> 1,600 m)
accounts for about 80 - 85% of the natural area of
the whole district (PCLDD, 2023). The position
of Lac Duong district in Lam Dong province is
shown in Figure 1.
2. Materials and Methods
2.1. Study site and data
Lac Duong district has administrative
boundaries of 5 communes and one town
including Lac Duong town, Lat commune, Da
Sar commune, Da Nhim commune, Da Chais
commune, and Dung K’No commune. It has a
Figure 1. The geographical location of Lac Duong district.
Landsat 8 and 9 OLI satellite imagery data
were downloaded from the United States
Geological Survey - USGS website. Two satellite
imageries (124/051 and 124/052) captured in
May 2013 and in March 2015, 2017, 2019, 2021,
and 2023 are used to build LULC and LST maps
in this study. The satellite imageries meet cloudy
conditions (< 10%) and have a spatial resolution
of 30 x 30 m.
2.2. LULC and LST maps
2.2.1. LULC map
This study classifies land use and land cover
into five types: Forest land, Crop land, Built-up
land, Bare land, and Water body. LULC maps
are constructed from satellite image data sources
combined with a supervised classification
method - Maximum Likelihood Classification
(MLC) algorithm. The MLC method constructs
probability density functions for each class. Each
class is characterized by two features including
mean vector and covariance matrix, from which
the statistical likelihood is calculated for each
class. The algorithm will then identify each
remaining pixel and will be assigned to the class
that it is most likely to be a member of according
to the Bayesian formula (Sun et al., 2013).
142 Nong Lam University, Ho Chi Minh City
The Journal of Agriculture and Development 23(Special issue 1) www.jad.hcmuaf.edu.vn
number of samples in row i (positive error) and
total number of samples in column i (negative
error), respectively; N - the total number of
observations.
The coefficient K < 0.40 is low accuracy,
0.41 - 0.60 is moderate accuracy; 0.61 - 0.80
is substantial accuracy, and > 0.81 is perfect
accuracy (Li, 2010).
For LULC maps, the study compared the
classification results using the MLC method and
real classification, which is examined based on
the high-resolution images from Google Earth
(Islami et al., 2022; Mehra & Swain, 2024).
The accuracy of LST maps built on remote
sensing data can be assessed by three methods:
temperature-based (T-based), radiance-based
(R-based), and cross-validation (Li et al., 2013).
Nevertheless, due to the restrictions of time and
research finance, this study could not assess the
accuracy using the three methods mentioned.
Therefore, the reliability of the LST maps is
based on the high accuracy of several published
studies (Kafy et al., 2021; OnačillovÑ et al., 2022;
Nugraha et al., 2024).
Where, is the vector of each pixel; is the likelihood function of x belonging to class k; and are the
vector and covariance matrix of class k.
2.2.2. LST map
The LST is calculated using spectral reflectance and correction formulas depending on the image
type. The process includes six computation steps: Top of Atmospheric (TOA) spectral radiance, TOA
to Brightness Temperature conversion, NDVI, the proportion of vegetation, Emissivity, and Land
Surface Temperature. Its formula can be shown as follows (Sajib et al., 2020):
Where, π‘₯π‘₯ = [π‘₯π‘₯1, π‘₯π‘₯2, . . . , π‘₯π‘₯π‘šπ‘š]𝑇𝑇 is the vector of each pixel; π‘€π‘€π‘˜π‘˜(π‘₯π‘₯) is the likelihood function 114
of x belonging to class k; πœ‡πœ‡π‘˜π‘˜ and π‘†π‘†π‘˜π‘˜ are the vector and covariance matrix of class k.115
2.2.2. LST map116
The LST is calculated using spectral reflectance and correction formulas depending on 117
the image type. The process includes six computation steps: Top of Atmospheric (TOA) 118
spectral radiance, TOA to Brightness Temperature conversion, NDVI, the proportion of 119
vegetation, Emissivity, and Land Surface Temperature. Its formula can be shown as follows 120
(Sajib et al., 2020):121
𝐿𝐿𝑆𝑆𝐿𝐿 = 𝐢𝐢2
πœ†πœ†
𝑒𝑒𝑒𝑒𝑒𝑒,𝑇𝑇𝑇𝑇𝑇𝑇10
.𝑙𝑙𝑙𝑙(
𝐢𝐢1.πœπœπ‘‡π‘‡π‘‡π‘‡π‘‡π‘‡10.𝐿𝐿𝐿𝐿𝐿𝐿𝑇𝑇𝑇𝑇𝑇𝑇10
πœ†πœ†π‘’π‘’π‘’π‘’π‘’π‘’
5
.(𝐿𝐿𝑇𝑇𝑇𝑇𝑇𝑇10 βˆ’ 𝐿𝐿𝑒𝑒𝑒𝑒 βˆ’ πœπœπ‘‡π‘‡π‘‡π‘‡π‘‡π‘‡10(1βˆ’πΏπΏπΏπΏπΏπΏπ‘‡π‘‡π‘‡π‘‡π‘‡π‘‡10).𝐿𝐿𝑑𝑑𝑑𝑑𝑑𝑑𝑑𝑑)+1
(2)122
Where, πœ†πœ†π‘’π‘’π‘’π‘’π‘’π‘’,𝑇𝑇𝑇𝑇𝑇𝑇10 is the effective wavelength of band Thermal Infrared (TIR); 𝐿𝐿𝑇𝑇𝑇𝑇𝑇𝑇10 is the 123
Top-of-Atmosphere thermal radiance; πœπœπ‘‡π‘‡π‘‡π‘‡π‘‡π‘‡10 is the band TIR average atmospheric 124
transmittance; 𝐿𝐿𝑆𝑆𝐿𝐿𝑇𝑇𝑇𝑇𝑇𝑇10 is the emissivity of the band TIR; C1 and C2 are Planck’s first and 125
second radiation constants (C1 = 1.19104 x 10⁸ W m4 m-2 sr-1 and C2 = 1.43877 x 10⁴ m 126
K); Lup and Ldown are the upwelling and downwelling radiance in the atmosphere obtained in 127
band TIR.128
2.2.3. Map accuracy assessment129
The accuracy of the LULC maps was evaluated using the Kappa coefficient (K) 130
according to the formula 3 (Cohen, 1960). This coefficient presents the measurement of rater 131
reliability, which is computed based on the error matrix of the class identified at 500 132
randomly selected plots, which were created by Create Random Points in ArcToolbox in 133
ArcMap.134
𝐾𝐾 = π‘π‘βˆ‘π‘₯π‘₯π‘–π‘–π‘–π‘–βˆ’ βˆ‘ (π‘₯π‘₯𝑖𝑖+.π‘₯π‘₯+𝑖𝑖)
π‘Ÿπ‘Ÿ
𝑖𝑖=1
π‘Ÿπ‘Ÿ
𝑖𝑖=1
𝑁𝑁2βˆ’ βˆ‘ (π‘₯π‘₯𝑖𝑖+.π‘₯π‘₯+𝑖𝑖)
π‘Ÿπ‘Ÿ
𝑖𝑖=1 (3)135
Where, r - the number of rows in matrix; xkk - the number of observations in row i and 136
column i respectively; xi+ and x+i - the total number of samples in row i (positive error) and 137
total number of samples in column i (negative error), respectively; N - the total number of 138
observations.139
The coefficient K < 0.40 is low accuracy, 0.41 - 0.60 is moderate accuracy; 0.61 - 0.80 140
is substantial accuracy, and > 0.81 is perfect accuracy (Li, 2010).141
Where, π‘₯π‘₯ = [π‘₯π‘₯1, π‘₯π‘₯2, . . . , π‘₯π‘₯π‘šπ‘š]𝑇𝑇 is the vector of each pixel; π‘€π‘€π‘˜π‘˜(π‘₯π‘₯) is the likelihood function 114
of x belonging to class k; πœ‡πœ‡π‘˜π‘˜ and π‘†π‘†π‘˜π‘˜ are the vector and covariance matrix of class k.115
2.2.2. LST map116
The LST is calculated using spectral reflectance and correction formulas depending on 117
the image type. The process includes six computation steps: Top of Atmospheric (TOA) 118
spectral radiance, TOA to Brightness Temperature conversion, NDVI, the proportion of 119
vegetation, Emissivity, and Land Surface Temperature. Its formula can be shown as follows 120
(Sajib et al., 2020):121
𝐿𝐿𝑆𝑆𝐿𝐿 = 𝐢𝐢2
πœ†πœ†π‘’π‘’π‘’π‘’π‘’π‘’,𝑇𝑇𝑇𝑇𝑇𝑇10.𝑙𝑙𝑙𝑙( 𝐢𝐢1.πœπœπ‘‡π‘‡π‘‡π‘‡π‘‡π‘‡10.𝐿𝐿𝐿𝐿𝐿𝐿𝑇𝑇𝑇𝑇𝑇𝑇10
πœ†πœ†π‘’π‘’π‘’π‘’π‘’π‘’
5.(𝐿𝐿𝑇𝑇𝑇𝑇𝑇𝑇10 βˆ’ 𝐿𝐿𝑒𝑒𝑒𝑒 βˆ’ πœπœπ‘‡π‘‡π‘‡π‘‡π‘‡π‘‡10(1βˆ’πΏπΏπΏπΏπΏπΏπ‘‡π‘‡π‘‡π‘‡π‘‡π‘‡10).𝐿𝐿𝑑𝑑𝑑𝑑𝑑𝑑𝑑𝑑)+1 (2)122
Where, πœ†πœ†π‘’π‘’π‘’π‘’π‘’π‘’,𝑇𝑇𝑇𝑇𝑇𝑇10 is the effective wavelength of band Thermal Infrared (TIR); 𝐿𝐿𝑇𝑇𝑇𝑇𝑇𝑇10 is the 123
Top-of-Atmosphere thermal radiance; πœπœπ‘‡π‘‡π‘‡π‘‡π‘‡π‘‡10 is the band TIR average atmospheric 124
transmittance; 𝐿𝐿𝑆𝑆𝐿𝐿𝑇𝑇𝑇𝑇𝑇𝑇10 is the emissivity of the band TIR; C1 and C2 are Planck’s first and 125
second radiation constants (C1 = 1.19104 x 10⁸ W m4 m-2 sr-1 and C2 = 1.43877 x 10⁴ m 126
K); Lup and Ldown are the upwelling and downwelling radiance in the atmosphere obtained in 127
band TIR.128
2.2.3. Map accuracy assessment129
The accuracy of the LULC maps was evaluated using the Kappa coefficient (K) 130
according to the formula 3 (Cohen, 1960). This coefficient presents the measurement of rater 131
reliability, which is computed based on the error matrix of the class identified at 500 132
randomly selected plots, which were created by Create Random Points in ArcToolbox in 133
ArcMap.134
𝐾𝐾 = π‘π‘βˆ‘π‘₯π‘₯π‘–π‘–π‘–π‘–βˆ’ βˆ‘ (π‘₯π‘₯𝑖𝑖+.π‘₯π‘₯+𝑖𝑖)
π‘Ÿπ‘Ÿ
𝑖𝑖=1
π‘Ÿπ‘Ÿ
𝑖𝑖=1
𝑁𝑁2βˆ’ βˆ‘ (π‘₯π‘₯𝑖𝑖+.π‘₯π‘₯+𝑖𝑖)
π‘Ÿπ‘Ÿ
𝑖𝑖=1
(3)135
Where, r - the number of rows in matrix; xkk - the number of observations in row i and 136
column i respectively; xi+ and x+i - the total number of samples in row i (positive error) and 137
total number of samples in column i (negative error), respectively; N - the total number of 138
observations.139
The coefficient K < 0.40 is low accuracy, 0.41 - 0.60 is moderate accuracy; 0.61 - 0.80 140
is substantial accuracy, and > 0.81 is perfect accuracy (Li, 2010).141
96
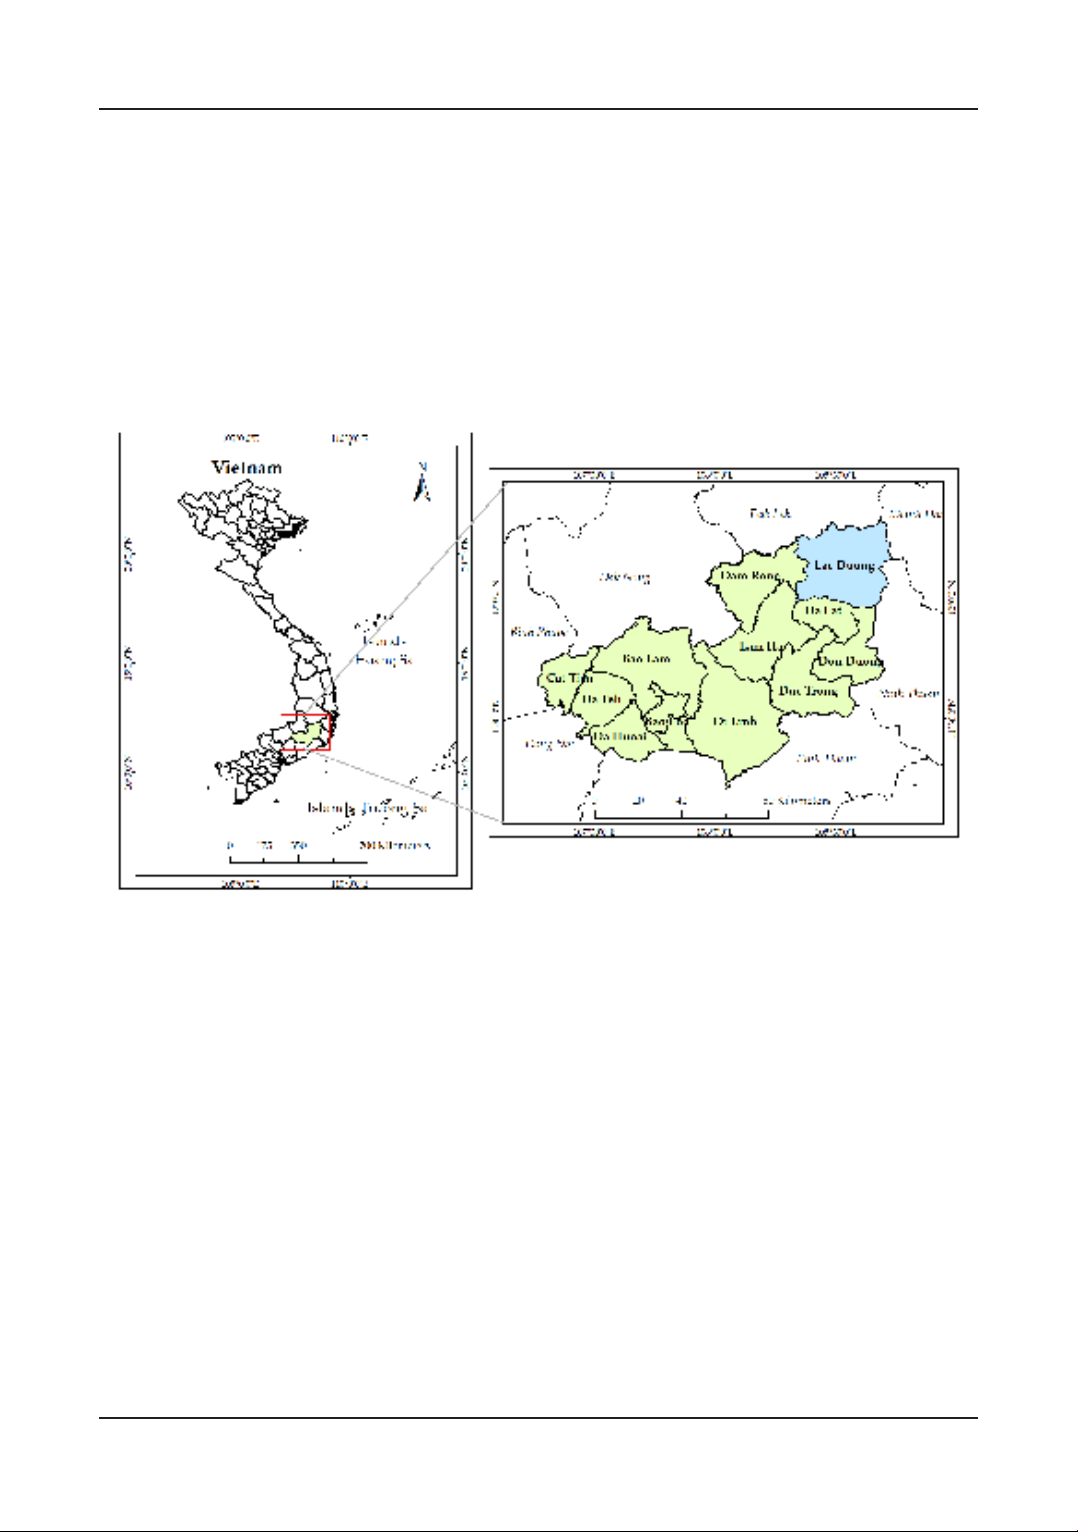
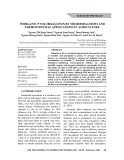
Figure 1. The geographical location of Lac Duong district.97
Landsat 8 and 9 OLI satellite imagery data were downloaded from the United States 98
Geological Survey - USGS website. Two satellite imageries (124/051 and 124/052) captured 99
in May 2013 and in March 2015, 2017, 2019, 2021, and 2023 are used to build LULC and 100
LST maps in this study. The satellite imageries meet cloudy conditions (< 10%) and have a 101
spatial resolution of 30 x 30 m.102
2.2. LULC and LST maps103
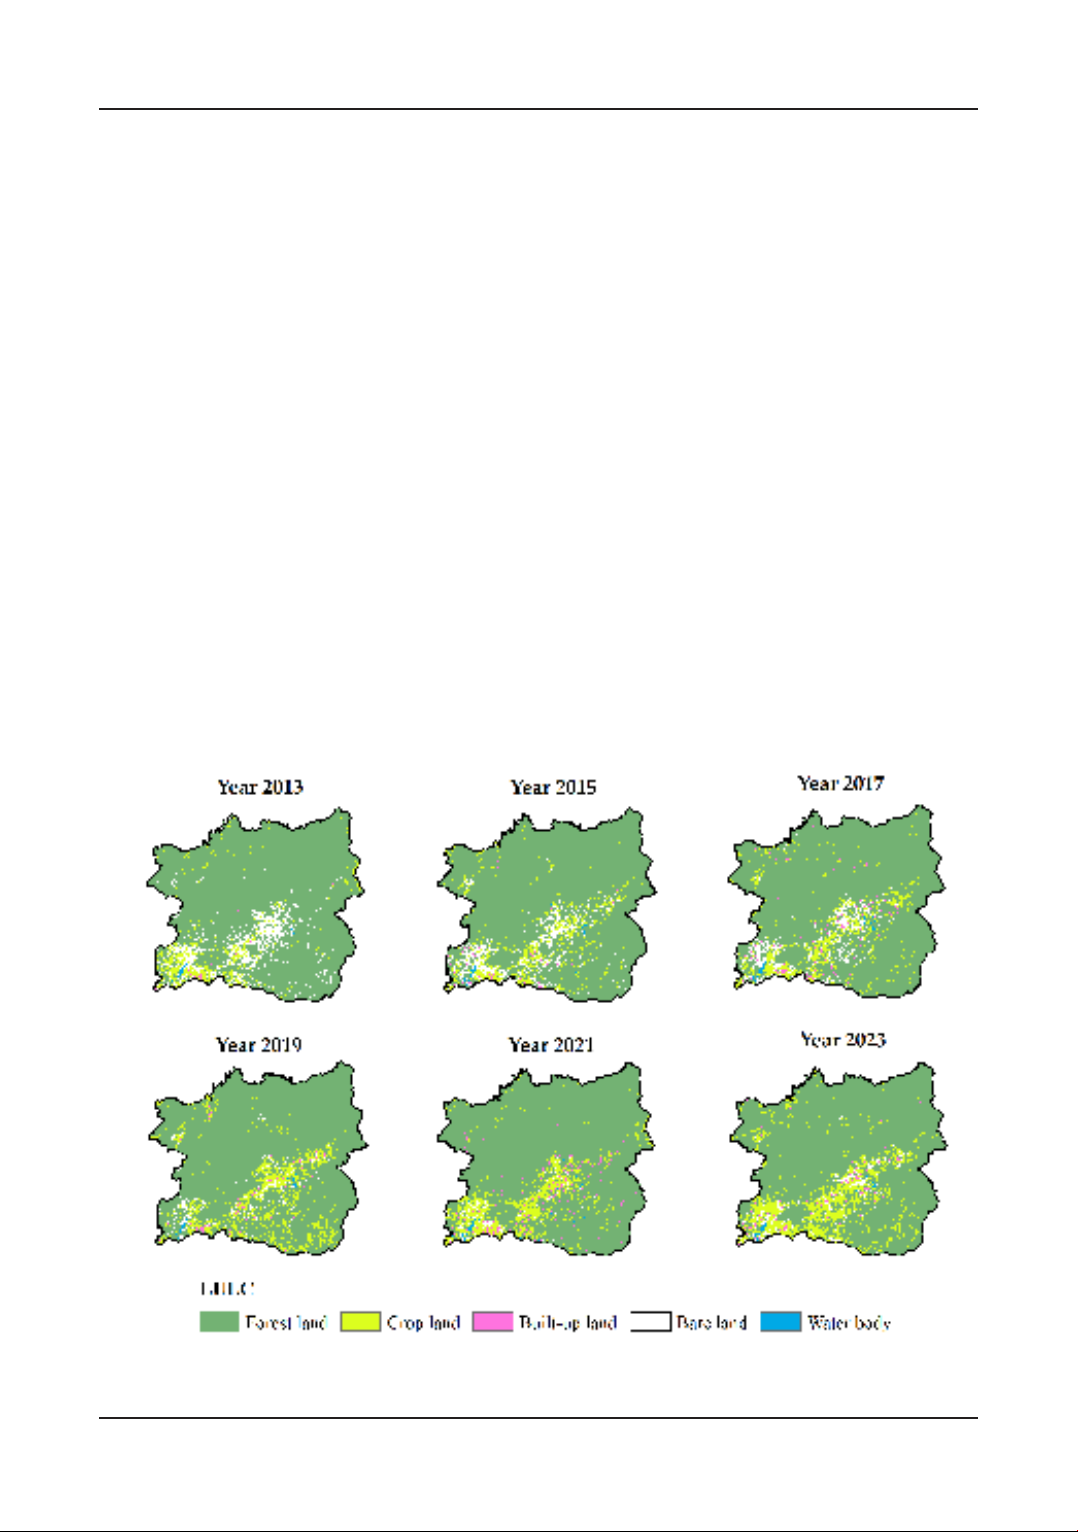
2.2.1. LULC map104
This study classifies land use and land cover into five types: Forest land, Crop land, 105
Built-up land, Bare land, and Water body. LULC maps are constructed from satellite image 106
data sources combined with a supervised classification method - Maximum Likelihood 107
Classification (MLC) algorithm. The MLC method constructs probability density functions 108
for each class. Each class is characterized by two features including mean vector and 109
covariance matrix, from which the statistical likelihood is calculated for each class. The 110
algorithm will then identify each remaining pixel and will be assigned to the class that it is 111
most likely to be a member of according to the Bayesian formula (Sun et al., 2013).112
π‘€π‘€π‘˜π‘˜(π‘₯π‘₯)=ln P( πΊπΊπ‘˜π‘˜) + ln |π‘†π‘†π‘˜π‘˜
βˆ’1|1/2
2πœ‹πœ‹π‘šπ‘š/2 βˆ’ 1
2(π‘₯π‘₯ βˆ’ πœ‡πœ‡π‘˜π‘˜)π‘‡π‘‡π‘†π‘†π‘˜π‘˜
βˆ’1(π‘₯π‘₯ βˆ’ πœ‡πœ‡π‘˜π‘˜) (1)113
(1)
(2)
Where, is the effective wavelength of
band Thermal Infrared (TIR); is the Top-of-
Atmosphere thermal radiance; is the band
TIR average atmospheric transmittance; is
the emissivity of the band TIR; C1 and C2 are
Planck’s first and second radiation constants (C1
= 1.19104 x 10⁸ W mm4 m-2 sr-1 and C2 = 1.43877
x 104 mm K); Lup and Ldown are the upwelling
and downwelling radiance in the atmosphere
obtained in band TIR.
2.2.3. Map accuracy assessment
The accuracy of the LULC maps was evaluated
using the Kappa coefficient (K) according to
the formula 3 (Cohen, 1960). This coefficient
presents the measurement of rater reliability,
which is computed based on the error matrix
of the class identified at 500 randomly selected
plots, which were created by Create Random
Points in ArcToolbox in ArcMap.
Where, r - the number of rows in matrix;
xkk - the number of observations in row i and
column i respectively; xi+ and x+i - the total
(3)
Nong Lam University, Ho Chi Minh City 143
The Journal of Agriculture and Development 23(Special issue 1) www.jad.hcmuaf.edu.vn
3. Results and Discussion
3.1. LULC changes
The LULC maps from 2013 to 2023 are
shown in Figure 2. The LULC maps built had
high and very high accuracy with the Kappa
coefficients ranging from 0.76 to 0.85 (Table
1). The Kappa coefficients of the LULC maps
were approximately the same as some published
studies using different satellite image data
sources. Specifically, the study by Islami et
al. (2022) constructed LULC maps in Sadar
Watershed, Mojokerto Regency, Indonesia using
Landsat 5 and Sentinel-2 images, with Kappa
coefficients ranging from 0.74 - 0.80. Therefore,
they are suitable and reliable for assessing the
LULC changes in Lac Duong district.
2.3. LST prediction
The study uses the Cellular Automata - Artificial
Neural Network (CA-ANN) model to predict LST
changes by analyzing the trends of land surface
temperature changes. The CA-ANN model is a
combination of the spatial operation of the cellular
automata model and the artificial neural network
system. The prediction of LST changes uses three
types of input data: (1) NDVI fluctuations over the
years; (2) LST data transfer matrix; and (3) land
use planning in 2030. This model is run on the
MOLUSCE plugin software in QGIS 2.8.9.
The analysis results of LST changes in the
period 2015 - 2023 are a basis for predicting LST
map in 2030. To ensure the reliability of predictive
modelling, the study was first used the CA-ANN
model to estimate the LST map in 2023, and then
evaluated the accuracy of this map by comparing
it with the LST map calculated from remote
sensing images through the Kappa coefficient.
Figure 2. Land use and land cover (LULC) maps from 2013 to 2023.