HPU2. Nat. Sci. Tech. Vol 03, issue 02 (2024), 10-17.
HPU2 Journal of Sciences:
Natural Sciences and Technology
Journal homepage: https://sj.hpu2.edu.vn
Article type: Research article
Received date: 28-02-2024 ; Revised date: 03-4-2024 ; Accepted date: 10-4-2024
This is licensed under the CC BY-NC 4.0
10
Structure, magnetic properties and magnetocaloric effect of
Fe
81-x
Cr
x+4
B
2
Zr
10
Nd
3
rapidly quenched alloys
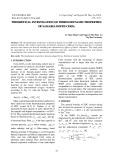
Hai-Yen Nguyen
a
*
, Huy-Ngoc Nguyen
a
, Xuan-Hau Kieu
a
, Thi-Thanh Pham
a
,
Viet-Anh Truong
a
, Dinh-Thang Duong
b
, Van-Duong Nguyen
b
, Huy-Dan Nguyen
a
a
Institute of Materials Science - VAST, Hanoi, Vietnam
b
Hanoi Pedagogical University 2, Vinh Phuc, Vietnam
Abstract
This paper presents, we present the structure, magnetic properties, and magnetocaloric effect of the Fe
81-
x
Cr
x+4
B
2
Zr
10
Nd
3
(x = 0, 1, 2, and 3) alloy ribbons. The alloy ribbons were prepared by using the melt-
spinning method. Structural analysis by X-ray diffraction shows that the obtained alloy ribbons are
almost amorphous. Curie temperature of the alloy ribbons decreases from 310 to 275 K when x increases
from 0 to 3. Under a magnetic field change of 12 kOe, the maximum magnetic entropy change (|S
m
|
max
)
of the Fe
80
Cr
5
B
2
Zr
10
Nd
3
alloy ribbon is found to be 1.05 J.kg
-1
.K
-1
at 302 K. In addition, the large
refrigerant capacity (RC > 80 J∙kg
-1
with H = 12 kOe) at room temperature is obtained in the alloy
ribbon. Thus, the alloy ribbons can be considered a potential magnetic refrigerant in the room
temperature range.
Keywords: Magnetocaloric effect, magnetic entropy change, refrigerant capacity, magnetic refrigerant,
melt-spinning method
1. Introduction
Today, global warming and rising energy costs of energy require the development of new cooling
technologies to replace conventional gas-compression/expansion refrigeration. In response to this demand,
the magnetic refrigeration (MR) technology based on the magnetocaloric effect (MCE) of the material, which
is characterized by an isothermal magnetic entropy change (S
m
(T)), an adiabatic temperature change
(T
ad
(T)) and a refrigerant capacity (RC), is a good candidate. This technology has attracted more and more
attention because the MR has greater cooling efficiency, lower energy consumption, and higher
*
Corresponding author, E-mail: yennh@ims.vast.ac.vn
https://doi.org/10.56764/hpu2.jos.2024.3.2.10-17

HPU2. Nat. Sci. Tech. 2024, 3(2), 10-17
https://sj.hpu2.edu.vn 11
environmental safety than conventional gas refrigeration [1]–[2]. Therefore, magnetocaloric materials have
been increasingly interested in research and development over the past few decades [1]–[10].
The magnetocaloric materials can be divided into two categories: the materials that undergo first-order
magnetic phase transition (FOMPT) usually have a giant Sm over a narrow temperature range [3]–[11]; the
materials undergoing the second-order magnetic phase transition (SOMPT) show that the Sm(T) peak
expands around the phase transition temperature [10], [12–15]. The SOMPT material is considered more
suitable for application in the MR because of its wide working temperature range (usually greater than 50 K)
[12]–[14]. Among SOMPT materials, Fe-Zr-based amorphous alloys display almost all features of an ideal
magnetic refrigerant in the room temperature region, such as large Sm(T) peak over a wide temperature
range, good mechanical properties, low price, adjustable magnetic transition Curie temperature (TC). To
improve the glass forming ability (GFA), MCE, and tune TC and for these materials, other elements such as
Co, B, Cr, Mn, and Nd have been incorporated [12]–[16]. For example, the TC phase transition temperature
of the alloy (Fe0.95 M0.05)0.9Zr0.1 was adjusted to the region room temperature by adding elements [1]. The
saturation magnetization (Ms), the TC, and the MCE of Fe92-xZr8Bx alloy ribbons were significantly improved
by the addition of B [14]. The TC of these alloy ribbons increased from 291 K (for x = 3) to 306 K (for x = 5)
with increasing B-concentration. The maximum magnetic entropy change (|Sm|max) of the Fe87Zr8B4 alloy
ribbon reaches 0.88 J.kg-1.K-1 at 291 K [14]. The replacement of a small amount of Co for Fe gives more
increment in the TC and the |Sm|max of the Fe88-xZr11B1Cox (x = 1, 2) amorphous alloys [16]. For an applied
field of 15 kOe, the sample with x = 2 exhibits a large |Sm|max of 1.73 J.kg-1.K-1, and a high refrigerant
capacity (RC) of 124 J.kg-1 at 300 K [16]. In addition, The TC of Fe-Zr-based amorphous alloys can be
reduced to room temperature with the substitution of Cr for Fe [17], [18]. GFA of Fe-Zr-based alloys also
considerably improves with the addition of Cr. With a magnetic field change of 15 kOe, the Fe80Cr4B10Zr5Gd1
alloy with 4 at% Cr-concentration presented high RC (110 J.kg-1) [17]. Thus, one can see that the influence
of the additional elements on the TC, GFA, and MCE of the Fe-Zr-based alloys is widely varied. Therefore,
to improve their GFA, MCE and adjust the TC of the alloy to room temperature region, we investigated the
influence of Cr on structure, magnetic properties and MCE of Fe81-xCrx+4B2Zr10Nd3 (x = 0, 1, 2, and 3) alloy
ribbons.
2. Experimental section
The bulk alloys with Fe81-xCrx+4B2Zr10Nd3 (x = 0, 1, 2, and 3) compositions were prepared from
pure metals of Fe, Cr, Nd, B, and Zr (> 99%) by using an arc-melting method. To prevent oxidation, the
alloy ingots were prepared in an arc furnace in Ar gas. Each sample was remelted and turned five times
to ensure the homogeneity of the alloys. The alloy ingots were then fabricated on a single-wheel melt-
spinning system in a purified Argon atmosphere. The obtained ribbons had thicknesses and widths of
about 50 m and 3 mm, respectively. The structure of the samples at room temperature was examined
by using X-ray diffraction (XRD). The magnetization versus temperature and magnetic field were
carried out on the ribbon samples using a vibrating sample magnetometer (VSM).
3. Results and discussion
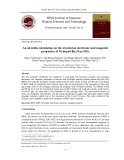
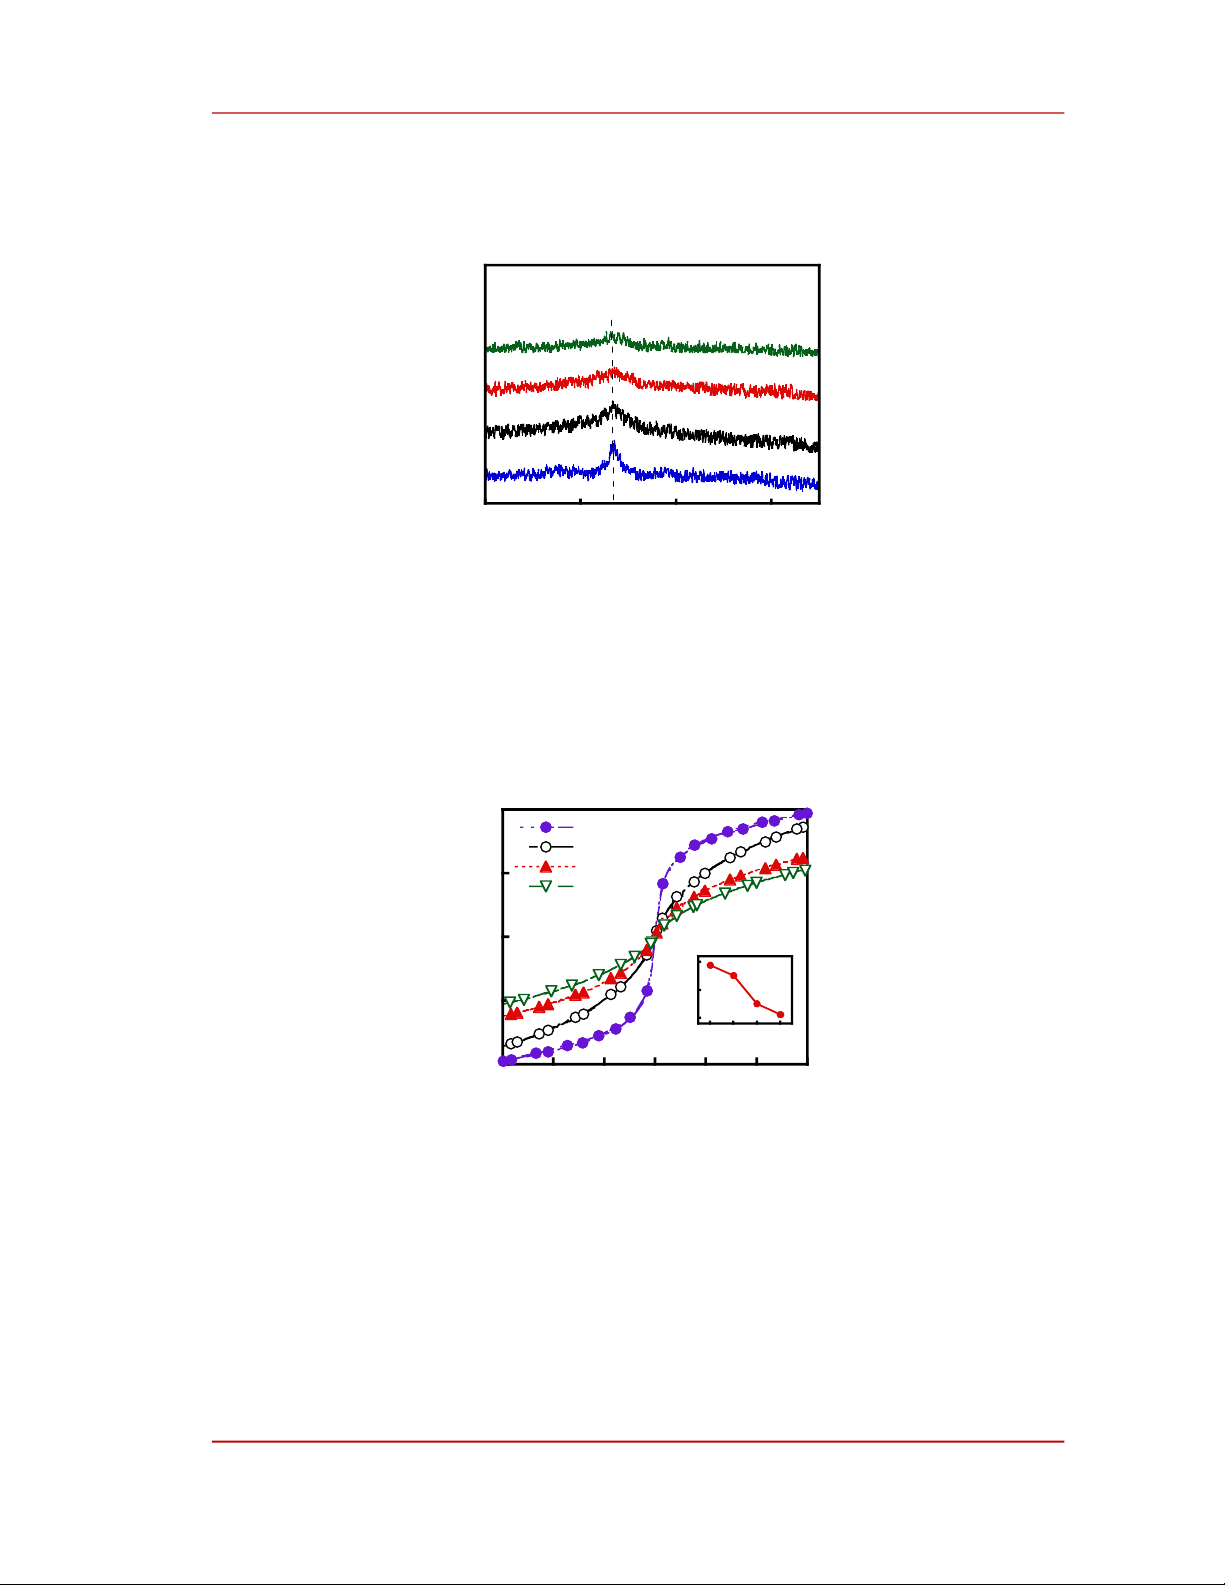
Structure of Fe81-xCrx+4B2Zr10Nd3 (x = 0, 1, 2, and 3) alloy ribbons are analyzed by using XRD.
From the XRD pattern (Figure 1), we observe only one diffraction peak around 2θ ≈ 43o. By qualitative
analysis of the crystal phase, we see that this diffraction peak is similar to the (110) lattice plane of the
α-Fe phase. This can be a demonstration of the existence of a nanocrystalline phase whose structure is
close to that of α-Fe is dispersed on the Fe81-xCrx+4B2Zr10Nd3 alloy ribbons. However, the intensity of
HPU2. Nat. Sci. Tech. 2024, 3(2), 10-17
https://sj.hpu2.edu.vn 12
this peak is relatively weak and decreases when x increases. This means that the GFA of the alloy ribbons
is significantly improved with the increase of the concentration of Cr. The alloy ribbons are almost
amorphous. Similar results were observed in the other Fe-Zr-based alloys such as Fe-Ni-Zr [19], Fe-B-
Zr [14], and Fe-Sn-Zr [20].
Figure 1. Room-temperature XRD pattern of Fe81-xCrx+4B2Zr10Nd3 (x = 0, 1, 2, and 3) alloy ribbons.
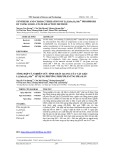
Figure 2. shows hysteresis loops measured at room temperature for Fe81-xCrx+4B2Zr10Nd3 (x = 0, 1,
2, and 3) alloy ribbons. One can see that all the alloy ribbons exhibited soft magnetic. This is good for
magnetic refrigeration because the magnetic hysteresis loss should be very small or negligible. Besides,
the maximum magnetization at the magnetic field of 12 kOe (M12 kOe) of the samples is reduced with
increasing Cr concentration. The value M12 kOe is 38.8, 35.1, 25.1, and 21.3 emu/g for x = 0, 1, 2, and 3,
respectively.
Figure 2. Hysteresis loops at room temperature of Fe81-xCrx+4B2Zr10Nd3 (x = 0, 1, 2, and 3) alloy ribbons.
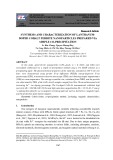
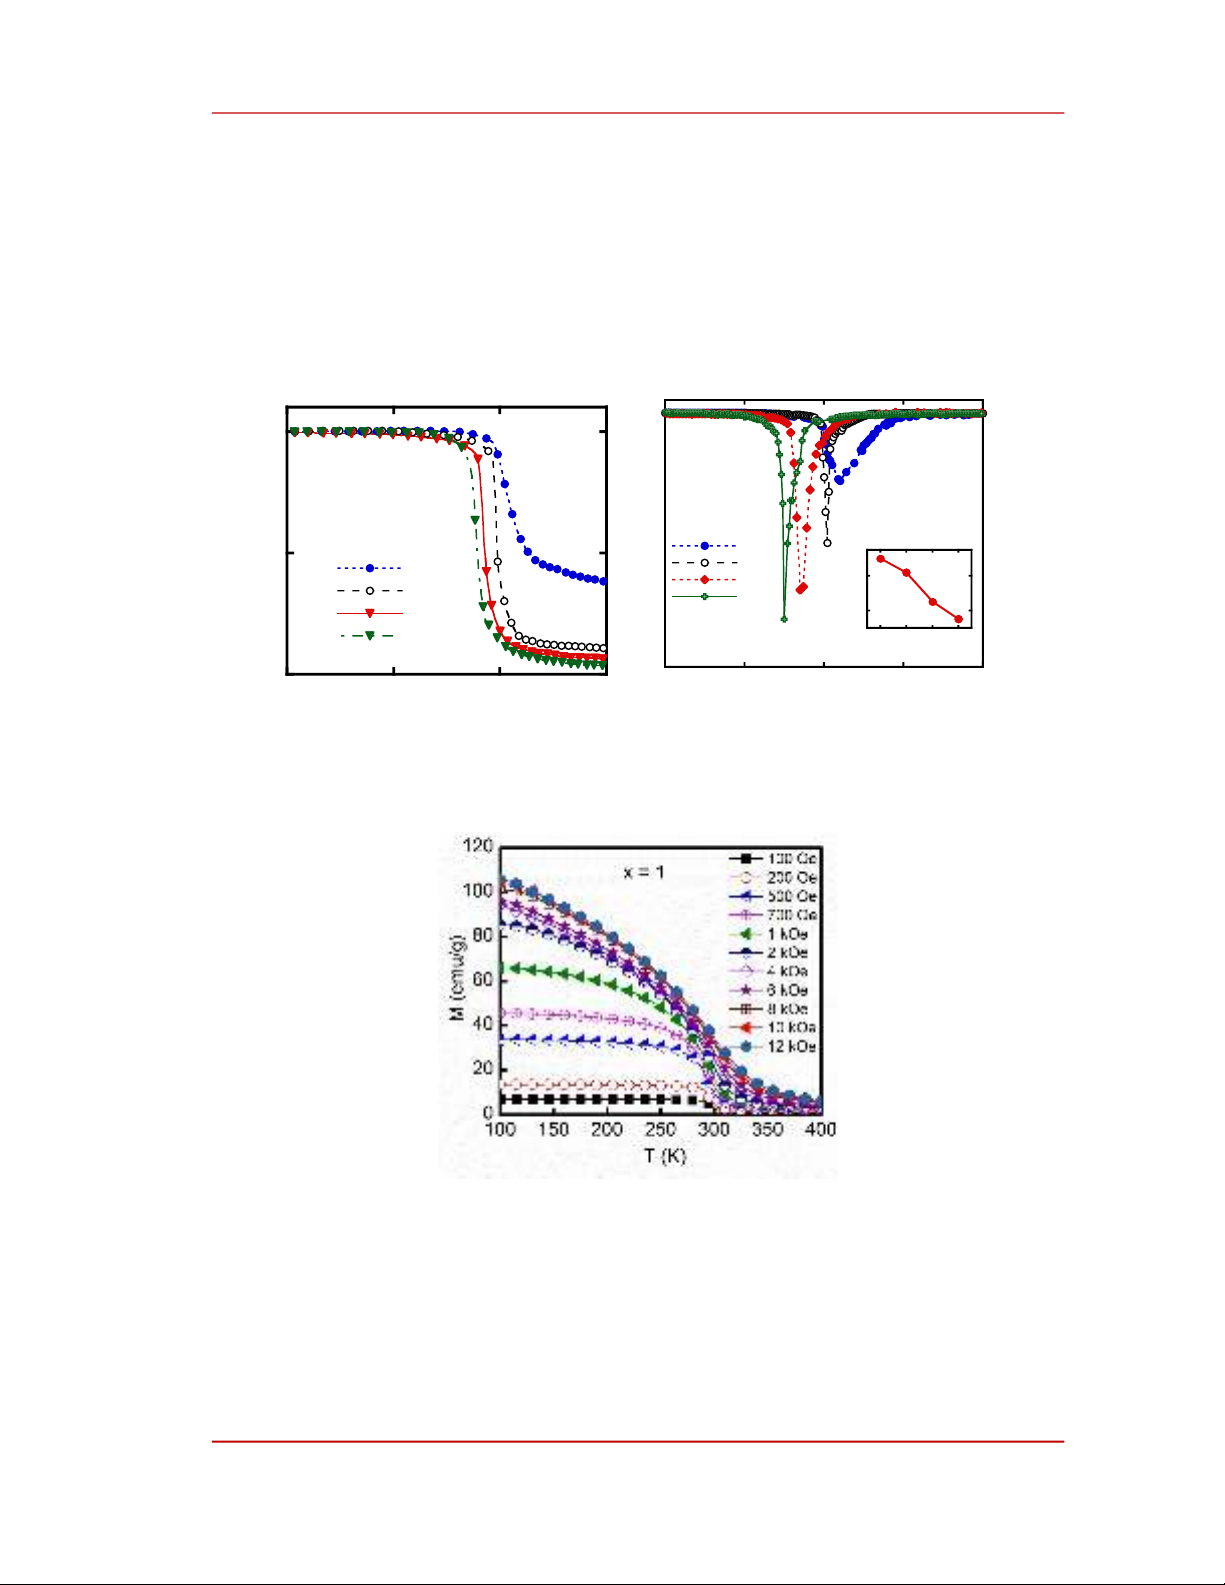
The magnetic phase transition temperatures are an important factor for choosing the magnetocaloric
material because the MCE of a material achieves its maximum value around these temperatures. Figure
3.a presents the reduced thermomagnetic curves M(T) of Fe81-xCrx+4B2Zr10Nd3 (x = 0, 1, 2, and 3) alloy
ribbons measured in an applied magnetic field of 100 Oe. The samples have a fairly sharp magnetic
phase transition. This phase transition corresponds to the amorphous phase in the alloy ribbons. After
the magnetic phase transition, except for sample x = 0, the magnetization of other samples decreased
nearly to zero. This proves that the sample x = 0 is not monophasic. This is in agreement with the
structural analysis above. On the other hand, we can see that as in the previous section, the concentration
of Cr has a significant effect on the TC of the alloy ribbons. The TC of the samples is determined from
30 40 50 60
Intensity (a.u.)
2(o)
x = 0
x = 1
x = 2
x = 3
(110)
o
-40
-20
0
20
40
-12 -8 -4 0 4 8 12
x = 0
x = 1
x = 2
x = 3
M (emu/g)
H (kOe)
20
30
40
0 1 2 3
M (emu/g)
x
HPU2. Nat. Sci. Tech. 2024, 3(2), 10-17
https://sj.hpu2.edu.vn 13
the minimum of the dM/dT versus T curves (Figure 3.b). The TC of samples ranges from 275 to 310 K,
depending on the concentration of Cr. This value decreases with increasing Cr concentration. According
to previous studies [17], [18], it has been assumed that an antiferromagnetic coupling exists between Fe
and Cr. This antiferromagnetic coupling causes to weaken the ferromagnetic coupling. Hence, the TC of
the alloy ribbons reduces with increasing the concentration of Cr (see the inset of Figure 3.b). The TC
value determined for samples x = 0, 1, 2, and 3 is 310, 302, 285, and 275 K, respectively. Thus, the TC
of the alloy ribbons has been gradually adjusted to room temperature when the concentration of Cr
increases.
Figure 3. Temperature dependences of a) magnetization M and b) dM/dT of Fe81-xCrx+4B2Zr10Nd3 (x = 0, 1, 2, and 3)
alloy ribbons in the applied magnetic field of 100 Oe. The inset shows the Curie temperature TC versus Cr
of these samples.
Figure 4. Thermomagnetization curves in various magnetic fields of Fe80Cr5B2Zr10Nd3 alloy ribbon.
According to the results of the above analyses, the sample with x = 1 is quite monophasic and has a
phase transition temperature at room temperature. Therefore, we have selected this sample to investigate
the MCE of the alloy. The MCE of the alloy ribbons is evaluated using their magnetic entropy change,
Sm. Figure 4. presents the thermomagnetization curves of Fe80Cr5B2Zr10Nd3 ribbon at different magnetic
fields in the range of 100 Oe to 12 kOe. We can observe that the magnetization of the alloy ribbons
0
0.5
1
100 200 300 400
x = 0
x = 1
x = 2
x = 3
M/M
100K
(a.u.)
T (K)
a)
200 250 300 350 400
x = 0
x = 1
x = 2
x = 3
dM/dT (a.u.)
T (K)
b)
280
300
0 1 2 3
T
C
(K)
x (%)
HPU2. Nat. Sci. Tech. 2024, 3(2), 10-17
https://sj.hpu2.edu.vn 14
increases with increasing the magnetic field. All the thermomagnetization curves have an almost
unchanged TC phase transition temperature of around 300 K.
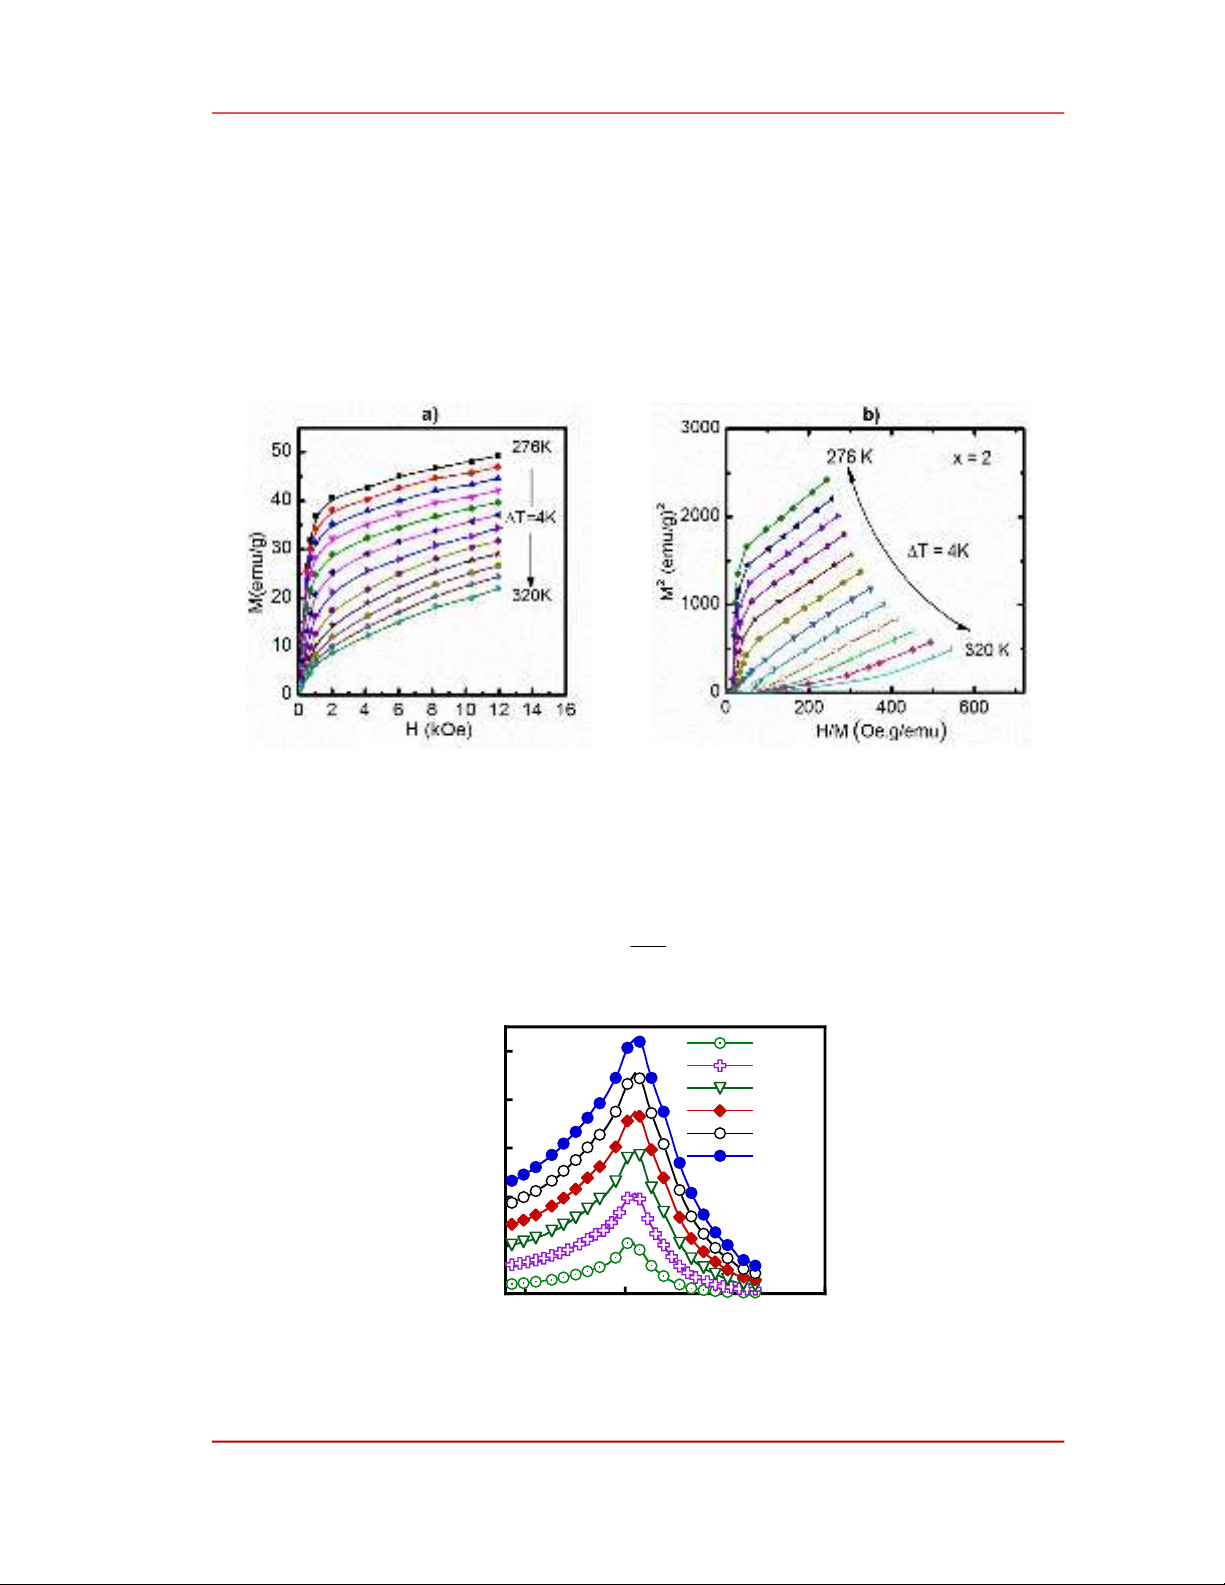
To better understand the nature of the magnetic phase transition and the magnetic order in the alloy
ribbons, the Arrott plots (M2-H/M) were constructed from M(H, T) data (Figure 5.a). According to
Banerjee’s criteria [1]–[2], the sign of the slope of the M2-H/M curves (Figure 5.b) tells us the nature of
the phase transition. The negative slope corresponds to the first-order magnetic phase transition
(FOMPT), and the positive slope corresponds to the second-order magnetic phase transition (SOMPT).
From Figure 5.b, we see that all the M2-H/M curves of these samples have positive slopes. This proves
that the magnetic phase transition occurring on the sample belongs to the SOMPT.
Figure 5. Magnetization vs. the magnetic field (a) and the M2-H/M plots (b) at various temperatures ranging
from 276 K to 320 K with temperature step (T) of 4 K of the representative Fe80Cr5B2Zr10Nd3 alloy ribbon.
The Sm values of the Fe80Cr5B2Zr10Nd3 alloy ribbon are indirectly calculated from the M(H, T) data
(Figure 5.a) using the following Maxwell equation [1] –[2]:
dH
T
M
S
H
H
m
0
Figure 6. The -Sm(T) plots in various magnetic field changes of Fe80Cr5B2Zr10Nd3 alloy ribbon.
0
0.2
0.4
0.6
0.8
1
250 300 350 400
2 kOe
4 kOe
6 kOe
8 kOe
10 kOe
12 kOe
T (K)
-S
m
(J. Kg
-1
. K
-1
)
x = 1
(1)