Journal of Science and Transport Technology Vol. 3 No. 1, 44-52
Journal of Science and Transport Technology
Journal homepage: https://jstt.vn/index.php/en
JSTT 2023, 3 (1), 44-52
Published online 30/03/2023
Temperature effect on the characteristic
quantities of microstructure and phase
transition of the alloy Ag0.25Au0.75
Ștefan Țălu1, Tuan Quoc Tran2,*, Hoang Van Ong2, Ha Thi Vu2, Thi Duyen
Tran2, Thu-Cuc Thi Nguyen2.
1Technical University of Cluj-Napoca, Cluj-Napoca, 400020, Cluj County,
Romania
2University of Transport Technology, Hanoi 100000, Vietnam
Article info
Type of article:
Original research paper
DOI:
https://doi.org/10.58845/jstt.utt.2
023.en.3.1.44-52
*Corresponding author:
E-mail address:
tranquoctuan1181@gmail.com
Received: 8/03/2023
Revised: 22/03/2023
Accepted: 24/03/2023
Abstract: In this research, Molecular Dynamics (MD) simulations were
conducted to explore the temperature effect on the microstructure and phase
transition of the Ag0.25Au0.75 alloy. The findings reveal that as the temperature
rises, the material's phase transition switches from crystalline to liquid and vice
versa. Notably, during the phase transition, significant changes occur in the
link length (r), the total energy of the system (Etot), and the number of structural
units FCC, HCP, BCC, and Amor. The microstructural features of the models
were analyzed using the radial distribution function (RDF), a number of
structural units, shape, size (l), and total energy of the system (Etot). In
addition, the length of the link Ag-Ag, Ag-Au, Au-Au, the size of the material
has a very small change value and is considered almost constant, and the
height of the radial distribution function (RDF) decreases. The number of
structural units FCC, HCP decreased, BCC, Amor increased, and the total
energy of the system increased, thereby confirming that the influence of
temperature on the microstructure and phase transition of the Ag0.25Au0.75 alloy
is very large. Besides, the micro-structural characteristics of the Ag0.25Au0.75
alloy can be applied as a basis for future experimental studies.
Keywords: Ag0.25Au0.75 alloy, microstructure, molecular dynamics, phase
transition, temperature.
1. INTRODUCTION
Gold and silver alloy (AuAg) is an alloy of two
precious metals including gold and silver. Both
metals are materials with very good electrical and
thermal conductivity and are widely used in fields
such as photocatalysis, sensors [1], optics [2],
electronics [3], medical research [4], sensing [5],
and energy storage and conversion [6]. Studies on
this alloy have been carried out since about 1920,
concerning corrosion and stress cracking [7]. After
that, studies of mechanical properties began to
work on structural evolution [8]. To study and
fabricate this alloy, researchers have applied a lot
of methods. Based on the experimental methods,
researchers have successfully studied the
formation and growth of nanostructures during
processing [9]. With the metal reduction method,
the doping ratio from 25% to 55% has been
successfully determined in the AgAu alloy [10]. In
different studies, researchers have proposed and
discovered to improve the electrocatalytic
performance of metals by modifying the
composition, size [11], morphology [12], and
arrangement of surface atoms [13].

JSTT 2023, 3 (1), 44-52
Tran et al
45
The probabilistic simulation method for
investigating physical quantities using molecular
dynamics is a commonly used approach for
approximate simulations that involves treating
physical parameters as random variables or
classical random processes, and then performing
numerical simulations using classical equations.
This probabilistic simulation method was frequently
employed in Molecular Dynamics (MD), a
microscopic analysis [14] technique developed in
the 1920s. In MD simulations, Newton's equations
of motion are used with randomly generated initial
conditions. An early precursor of MD is the
classical ionization model for two-electron atoms in
a high-intensity laser beam, which was analyzed
and detailed in a paper (referenced as [16]) and
mentioned in [15]. This paper delves into the
classical ionization model and highlights its
significance in developing the MD method.
In this paper, we apply the MD simulation
method, but some aspects need to be considered
carefully, such as the stability of the computational
code, the accuracy of the integral method, the
sensitivity dependence sensitivity of the initial
conditions and the appropriate selection of the
pairwise interactions between the components
involved [17]. We use phenomenological criteria to
evaluate the validity of the results obtained. Recent
studies have succeeded in studying the electronic
structure, phase transition, and crystallization of
alloys such as AuCu [18], and NiAu [18]. The
obtained results show that when increases the
temperature and heating rate, the bond length
decreases, and when the number of atoms
increases, and the annealing time increases, the
bond length, and g(r) function increase. From
there, it raises the question of whether when
changing the temperature, there is a phenomenon
that the length of the link AgAu changes. To answer
the question, we continue to study the temperature
effect on the microstructure of the Ag0.25Au0.75 alloy.
The reason for choosing AgAu alloy with the
doping rate of 25% Ag, and 75% Au is because
previously, by the experimental method,
successfully mixed Au doping ratio from 25% to
50% obtained results quite positive. At the same
time, we will answer why researchers do not
perform with Au doping concentration with a doping
rate higher than 50% with the experimental
method.
Significant Changes in Physical Parameters
during Phase Transition of AgAu Material. The
study reveals that numerous physical parameters
undergo significant changes during the phase
transition of AgAu materials. These include bond
length, total energy, size, and the number of FCC,
HCP, and Amor structural units. These findings are
essential for advancing research and fabrication of
AgAu materials for future photocatalytic
applications.
2. METHOD OF CALCULATION
First, we randomly seed a material system
consisting of Ag0.25Au0.75 4000 atoms with an Ag:Au
ratio of 1:3, equivalent to 1000 Ag atoms and 3000
Au atoms. These atoms have been initialized in a
cube with the size (l) calculated by the following
formula (1)
Ag Ag Au Au
3(m .n + m .n )
l = ρ
(1)
where: ρ is density; m is the atomic molar
mass, n is the atomic number of the metal Ag and
is similar to Au.
All simulations were performed using
LAMMPS code [21,22] using the potential
Embedded Atomic Method (EAM) [23]. To study
microstructural characteristics and phase
transitions by using molecular dynamics (MD)
simulation with Sutton-Chen (SC) embedded
interaction potential (2) [20,24-27], under periodic
boundary conditions.
In that, the values of the coefficient of the
bulk Ag0.25Au0.75 materials are shown in Table 1
[21,22]. Set of the MEAM potential parameters for
single elements. The reference structures for Ag,
Au are FCC. Ei is the cohesive energy, a is the
equilibrium lattice parameter, Ai is the scaling factor
for the embedding energy, αi is the exponential

JSTT 2023, 3 (1), 44-52
Tran et al
46
decay factor for the universal energy, βi(0−3) are
the exponential decay factors for the atomic
densities, ti(0−3) are the weighting factors for the
atomic densities.
( )
( )
tot ij ij i i
ij i
1
E = V r + F ρ
2
,
( )
0
i i i
Fρ = A E ρlnρ
,
( )
n
ij i
ij
a
V r E r
=
,
(2)
( )
( ) ( )
( )
32
2ll
i i i
l=0
ρ = t ρ
,
( )
( )
*
al -b * (l)
ii
0
i
R
ρ R = e , b = β ,
R -1
Table 1. The parameters of the bulk AgAu material
Ag
Coefficient
0
i
E
(eV)
0
i
R
(Ǻ)
αi
Ai
βi(0)
βi(1)
a
2.850
3.000
5.892
0.940
4.730
2.200
4.080
Coefficient
βi(2)
βi(4)
ti(0)
ti(1)
ti(2)
ti(4)
rc
2.200
6.000
1.000
3.400
3.000
1.500
4.8
Au
Coefficient
0
i
E
(eV)
0
i
R
(Ǻ)
αi
Ai
βi(0)
βi(1)
a
3.930
1.640
6.341
1.000
5.770
2.200
4.070
Coefficient
βi(2)
βi(4)
ti(0)
ti(1)
ti(2)
ti(4)
rc
2.200
6.000
1.000
2.900
1.640
2.000
4.7
After creating the alloy model Ag0.25Au0.75, we
run all samples for recovery statistics with 2×10⁴
steps of molecular dynamics (MD) simulation to
prevent aaplied. between atoms. Then, increase
the temperature from 300 K to 4500 K by running
42×104 MD steps to convert the material from the
initial crystalline state to the liquid state with a
heating step of 1fs. The temperature is then
reduced from the liquid state at T = 4500 K to T =
1200, 1100, 1000, 900, 800, 700, 600, 500, 400,
and 300 K to convert the material from the liquid
state to the condensed state. new crystal. Then, all
the sample values are determined using the Velet
algorithm [28]. To study the characteristic
quantities of microstructure through material
shape, size (l), energy, and radial distribution
function (RDF), calculated according to formula (3):
( ) ( )
i
i
22
nr
V
g r = N4πr Δr
(3)
The lengths of the link, the coordinates, the
volume, and the radial distribution function (RDF)
were denoted as r, ni(r), V, and g(r) respectively.
The Common Neighbor Analysis (CNA) method
[29] was employed to determine the number of
structural units. The crystallization process was
carried out using the Nosé law [30], while the
heating process was performed using the Hoover
method [31].
3. RESULTS AND DISCUSSION
3.1. Structural characteristics
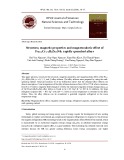
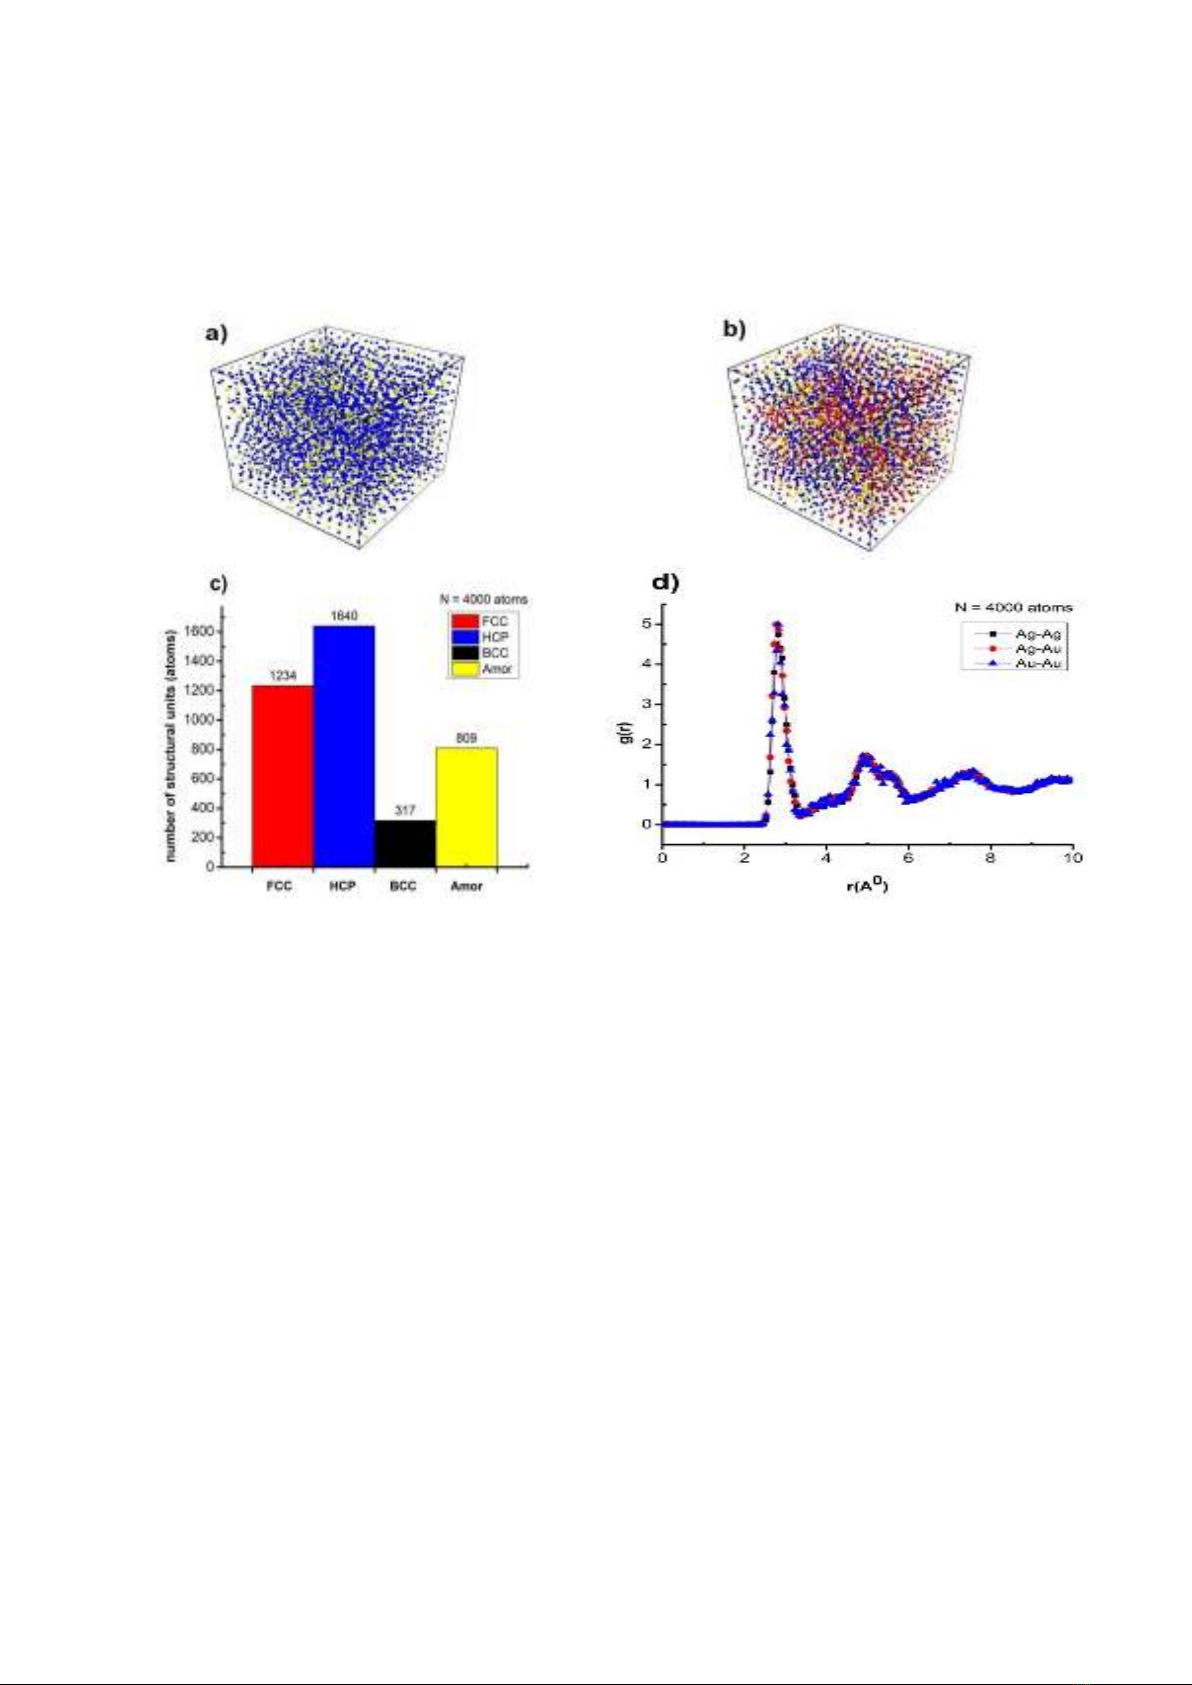
Figure 1 illustrates the characteristic
quantities of the microstructure and phase
transition of Ag0.25Au0.75 alloy at T = 300 K with a
heating rate of 4×10¹² K/s and a time step of 1fs.
Figure 1a shows a particular shape of the
alloy Ag0.25Au0.75 at 300 K temperature. The
structural shape (Figure 1b) is determined by the
number of structural units 1234 FCC, 1640 HCP,
317 BCC, 809 Amor (Figure 1c), the radial
distribution function (RDF) has the lengths of link
Ag-Ag, Ag-Au, Au-Au is r = 2.83, 2.78, 2.83 Å with
the function height, respectively, radial distribution
g(r) = 4.73, 5.00, 4.99 (Figure 1d). The obtained
results are in complete agreement with the
simulation results of Ag-Ag is 2.78 Å [18], Au-Au is
3.17 Å [19].
JSTT 2023, 3 (1), 44-52
Tran et al
47
The obtained results show that the lengths of
the link Ag-Ag and Au-Au have equal values, but
with g(r) of Au being larger than g(r) of Ag, it is
confirmed with the ratio. The high doping ratio of
Au leds to a higher probability density of the Au
atom than that of the Ag atom. This is the initial
result as well as the basis for us to continue to
study the influence of temperature on the
microstructure and phase transition of Ag0.25Au0.75
alloy.
Figure 1. Alloy shape Ag0.25Au0.75 (a), structure shape (b), number of structural units (c), radial
distribution function (d) of Ag0.25Au0.75 alloy at 300 K temperature
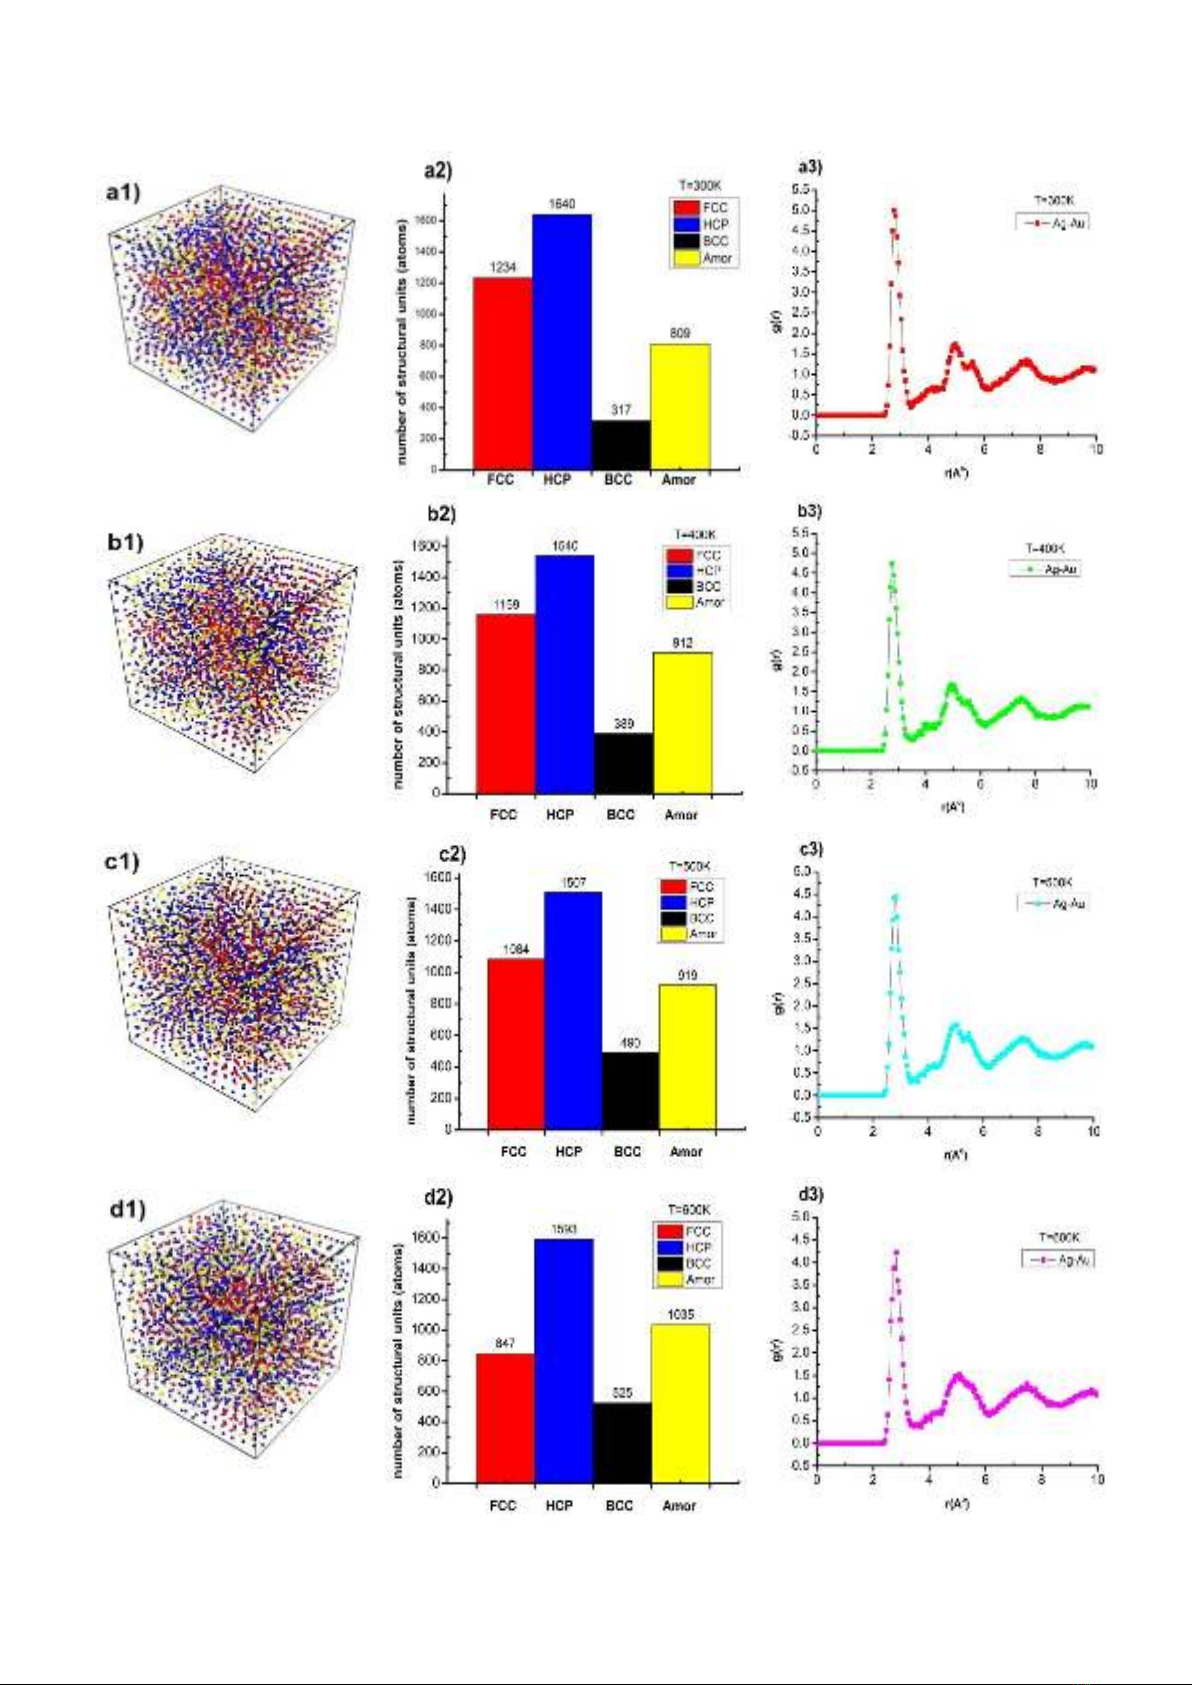
3.2. Effect of temperature
Observation in Figure 2 shows, the alloy
Ag0.25Au0.75 at 300 K temperature has a structural
shape (Figure 2a1) determined by the number of
structural units 1234 FCC, 1640 HCP, 317 BCC,
809 Amor (Figure 2a2), the radial distribution
function (RDF) has the lengths of the link Ag-Ag,
Ag-Au, Au-Au respectively r = 2.83, 2.78, 2.83 Å
with the height of the radial distribution function g(r)
= 4.73, 5.00, 4.99 (Figure 2a3). When increasing
the temperature from T = 300 K to T = 400, 500,
600, 700, 800, 900, 1000, 1100, 1200 K, the
structure shape changes (Figure 2a1, 2b1, 2c1, ..,
2k1), number of structural units FCC, HCP, Amor
architecture changes. FCC decreased from 1234
FCC to 109 FCC, HCP decreased from 1640 HCP
to 1211 HCP, BCC increased from 317 BCC to 767
BCC, Amor increased from 809 Amor to 2004 Amor
(Figure 2a2, 2b2, 2c2, .., 2k2), and the radial
distribution function changed as the Ag-bond
lengths increased. Au has a constant value r = 2.78
Å, and the height of the radial distribution function
from g(r) = 5.0 to g(r) = 3.1 (Figure 2a3, 2b3, 2c3,..,
2k3),. Through the obtained results, when the
temperature is increased, the number of structural
units FCC, HCP decreases, then BCC, Amor
increases, which shows that when the alloy
changes from solid state to a liquid state, the alloy
Ag0.25Au0.75 tends to gradually shift to BCC
structure, Amor is also the characteristic color of
Ag0.25Au0.75 alloy at high temperature. In addition to
the characteristics such as shape, structure shape
and radial distribution function, there are other
influencing factors that are the alloy size and the
energy of the material changes, the results are
shown in Table 2.
JSTT 2023, 3 (1), 44-52
Tran et al
48