VNU Journal of Science: Mathematics – Physics, Vol. 41, No. 1 (2025) 34-48
34
Original Article
Optical, Photocatalytic and Magnetic Properties
of ZnO Nanostructures Prepared by Thermal Decomposition
Kim Thi Hue My1, Vu Xuan Son1, Do Duc Tien1, Nguyen Dinh Lam1,
Do Thi Huong Giang1, Do Danh Bich2, Luu Manh Quynh3,
Pham Duc Thang3, Dang Ngoc Toan4, Phan The Long1,*
1VNU University of Engineering and Technology, 144 Xuan Thuy, Cau Giay, Hanoi, Vietnam
2Hanoi National University of Education, 136 Xuan Thuy, Cau Giay, Hanoi, Vietnam
3VNU Hanoi University of Science, 334 Nguyen Trai, Thanh Xuan, Hanoi, Vietnam
4Institute of Research and Development, Duy Tan University, Da Nang, Vietnam
Received 5th October 2024
Revised 18th November 2024; Accepted 17th February 2025
Abstract: ZnO nanostructures have been fabricated by annealing zinc acetate dihydrate at different
temperatures (Tan). Thermogravimetric analysis, and XRD and Raman studies indicate ZnO crystals
formed at above 250 oC. An increase of Tan would enhance the XRD intensity and number of Raman
modes characteristic of hexagonal ZnO. Below 700 oC, the samples are mainly nanorods with the
diameters and lengths of 50 –100 nm and 250 – 500 nm, respectively. As Tan increases from 700 to
1,200 oC, nanorods transform to irregular particles with average sizes of 0.2 – 2 m. This influences
the intensity ratio of UV-to-visible emissions. Though all the samples exhibit diamagnetism, several
samples with Tan = 500 – 700 oC have additionally weak ferromagnetic order. Assessing RhB
photodegradation has demonstrated the Tan = 300 oC sample showing the best photocatalyticity.
Keywords: ZnO nanoparticles, thermal decomposition, optical/photocatalytic behaviors.
1. Introduction*
Nanostructured materials with particle sizes smaller than 100 nm have been widely utilized in
various fields of modern life, particularly in smart electronic devices, energy conversion/storage,
environmental protection, healthcare and biomedical fields. Over the past decades, it has been
________
* Corresponding author.
E-mail address: ptlong2512@vnu.edu.vn
https//doi.org/10.25073/2588-1124/vnumap.4970

K. T. H. My et al. / VNU Journal of Science: Mathematics – Physics, Vol. 41, No. 1 (2025) 34-48
35
introduced numerous chemical and physical methods to synthesize and control the size, dimension,
structure, and morphology of nanomaterials. Unlike counterparts in bulk, nanomaterials have the large
surface-area-to-volume ratio (SAVR), and possible hetero-epitaxial growth structure. A size decrease
of nanomaterials not only enhances SAVR, but also causes the quantum confinement and surface-related
effects that would modify electronic/energy band structures, leading to strong electron-phonon
scatterings and intriguing physicochemical properties [1-3].
Among nanomaterials, ZnO nanostructures have attracted much more especial attention from the
scientific and technological community. This comes from the following facts that ZnO locates at the
boundary between ionic and covalent bonds, and possesses noble physical properties. Typically, it has
a high transparency, high-electron mobility, large exciton binding energy, and large bandgap energy,
high thermal/mechanical stability, high piezoelectricity, and excellent photocatalyticity [4]. Apart from
conventional n-type characters, it is possible to manufacture ZnO-based p-type, core/shell, flexible and
ferromagnetic semiconductors [5-8]. Such characters and advantages make ZnO surpassing other oxides
to become one of potential candidates suitable for many technological applications in
optoelectronic/electronic devices, UV/blue lasers, nanogenerators, and biosensors [9].
Basically, nanostructured ZnO materials can be manufactured by using co-precipitation,
hydrothermal synthesis, sol-gel, aqueous solution, chemical vapor deposition, and atomic layer
deposition methods. Depending on techniques and fabrication conditions, various ZnO nanostructures
could be facilely obtained [10, 11]. For the thermal decomposition method, though it has been widely
used to prepare ZnO nanocrystals with different sizes, systematically comparative investigations about
their morphological, structural, optical, magnetic and photocatalytic properties versus the annealing
temperature (Tan) have not been carried out yet. These problems will be considered with care in the
current work through experimental investigations of thermogravimetric analysis, scanning electron
microscopy, X-ray diffraction, energy-dispersive X-ray spectroscopy, micro-Raman/UV-
Vis/photoluminescence spectroscopy, and photocatalytic performance.
2. Experimental Details
ZnO nanostructures with nanorod- and/or irregular-shaped crystals were manufactured by the
thermal decomposition method using zinc acetate dihydrate, Zn(CH3COO)22H2O of Sigma-Aldrich®
as a precursor. This chemical was taken with equal masses of ~2 g. They were loaded in uncovered
alumina crucibles and in turn annealed in air for 2 h at temperatures Tan = 200 – 1,200 oC. Parallel with
the annealing process, thermogravimetric analysis (TGA, Shimadzu) measurement under normal
atmospheric conditions was also performed to learn about the decomposition of Zn(CH3COO)22H2O
and the formation of ZnO. After annealed at these temperatures, surface morphology and purity of the
obtained products were examined by an electron microscope and an energy-dispersive X-ray
spectrometer (EDS), respectively. An X-ray diffractometer (Philips X'Pert, λ = 1.5406 Å) was also
employed to monitor the formation of ZnO. Micro-Raman scattering spectroscopy (XploRA PLUS,
Horiba) in the backscattering model operating with an excitation wavelength (λexc) of 532 nm and the
10 optical objective was used to examine characteristic vibration modes associated with the ZnO
structure. Because Raman signals of ZnO are very strong, we scanned the whole spectra for about 5
minutes. Herein Raman data presented are average values of three measurement times. Optical
absorption spectra were recorded by a UV-Vis spectrophotometer (Jasco) while photoluminescent (PL)
spectra were recorded by a fluorescence spectrometer (Horiba) using λexc = 325 nm from a mercury-
vapor lamp (Hg lamp). Photocatalytic activity of the samples was also evaluated upon the degradation
of rhodamine-B (RhB) dye under UV irradiation. In this investigation, 100 mg of each catalyst sample
K. T. H. My et al. / VNU Journal of Science: Mathematics – Physics, Vol. 41, No. 1 (2025) 34-48
36
was dispersed into a 200-ml solution containing 10 ppm of RhB dye, which was then stirred in dark for
10 min. The solution containing ZnO catalysts was then photocatalyzed by a UV lamp (Hg lamp),
counted from 0 to 10 min. Every 2 min, an amount of the photocatalytic solution was poured out to
assess RhB degradation via recording its UV-Vis absorbance after ZnO catalysts were filtered. Finally,
the magnetic properties were studied through magnetic-field-dependent magnetization, M(H), measurements
using a vibrating sample magnetometer (Lake Shore).
3. Results and Discussion
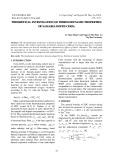
Fig. 1 shows TGA data of zinc acetate dihydrate Zn(CH3COO)22H2O recorded at temperatures
T = 25 - 700 oC with a heating rate fixed at 10 oC/min. The variation of these data can be divided into
characteristic regions. In the first region with a temperature increase from 25 to ~150 oC, about 20%
initial chemical weight is reduced due to water evaporation, forming anhydrous zinc acetate -
Zn(CH3COO)2. In the second range of 150 - 350 oC, a phase transition corresponding to the zinc-acetate
decomposition in order to constitute ZnO is observed that causes a weight loss of ~45%. At temperatures
above 350 oC, the third region, the weight loss is insignificant because the thermal stability of constituted
ZnO crystals. The total weight loss owing to thermal decomposition is about 65%, corresponding to the
residual ZnO product being ~35%, as shown in Fig. 1.
0100 200 300 400 500 600 700
0
20
40
60
80
100
45% 20%
35%
ZnO
Zn(CH3COO)2
T (oC)
Weight (%)
Zn(CH3COO)2.2H2O
Figure 1. TGA analysis in air of zinc acetate dihydrate at temperatures T = 25~700 oC.
Employing X-ray photoelectron spectroscopy, Mar et al. [13] found that the chemical transformation
of the precursor was complete at temperatures above 350 °C, and there was an incorporation of C into
the samples. Based on the TGA results, we selected and annealed the samples at Tan = 200 - 1,200 oC,
with temperature increments of 50 and 100 oC for the ranges 200~400 and 400~1,200 oC, respectively.
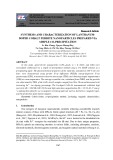
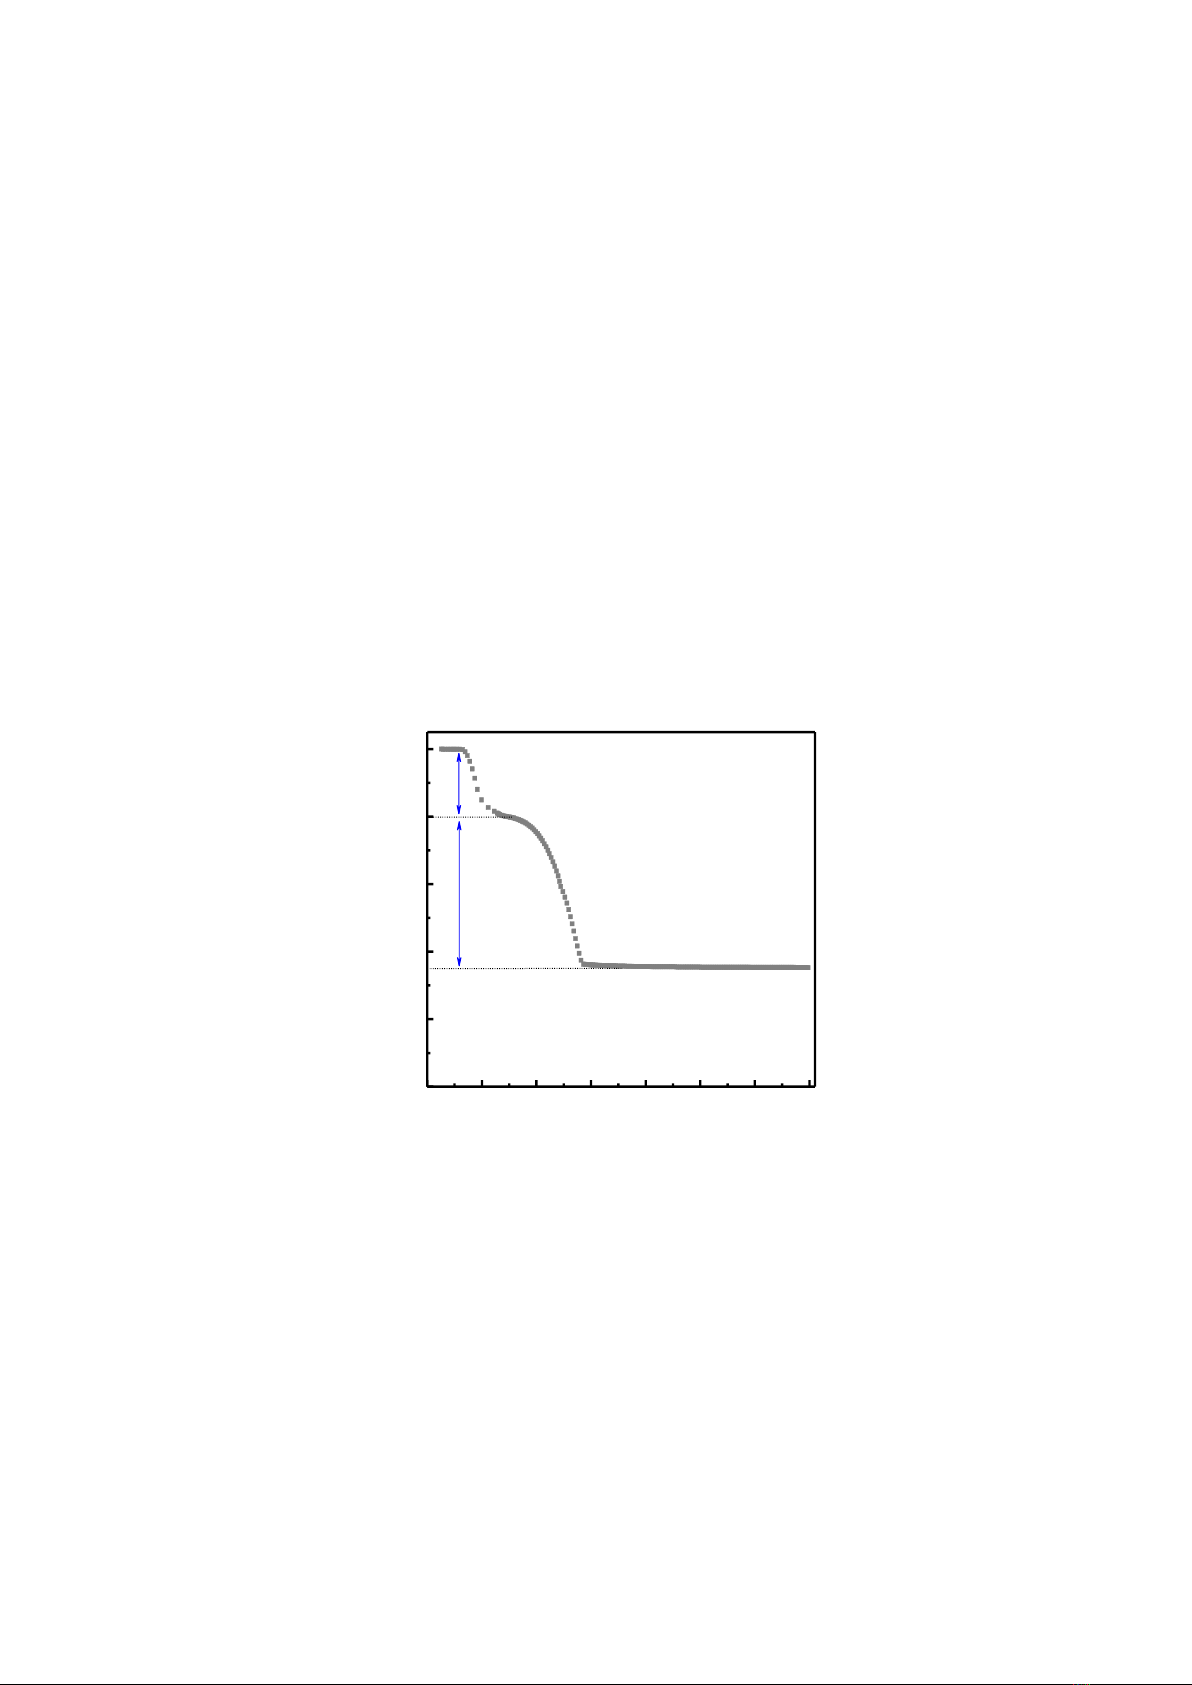
After fabricated, particle-morphological and size changes of the samples were checked by scanning
electron microscopy (SEM) under the same magnification scale. Figures 2(a-h) show SEM images of
typical samples, indicating that the annealing influenced strongly the surface morphology and particle
size. While the sample with Tan = 200 oC has an unclear resolution image, Fig. 2(a), since it mainly
contains anhydrous zinc acetate, the annealing at higher temperatures constitutes particles with their
K. T. H. My et al. / VNU Journal of Science: Mathematics – Physics, Vol. 41, No. 1 (2025) 34-48
37
gradually increased size. At Tan < 700 oC, the samples are mainly nanorods with the diameters and
lengths being 50~100 nm and 250~500 nm, respectively, see Figs. 2(b-d) and 2(e). When Tan 700 oC,
nanorods tend to change into irregular-shaped particles with the average size varying from 200 nm to
~2 m, see Figs. 2(f-h). Those nanorods and/or irregular particles cohere together to form large clusters,
especially clear grain boundaries are observed for the sample annealed at Tan = 1,200 oC. Herein, the
morphological variation tendency observed is fairly similar to that reported by Saravanan and Katekaew
et al., [14, 15]. To yield uniform nanorods, Lin et al., [12] recommended to anneal zinc acetate salts in
a lid-covered alumina crucible. This could be to maintain a stable ambience for chemical reactions and
ZnO-crystal development.
Figure 2. SEM images of the samples with Tan = 200 oC (a), 300 oC (b), 400 oC (c), 500 oC (d), 600 oC (e),
700 oC (f), 800 oC (g), and 1,200 oC (h).
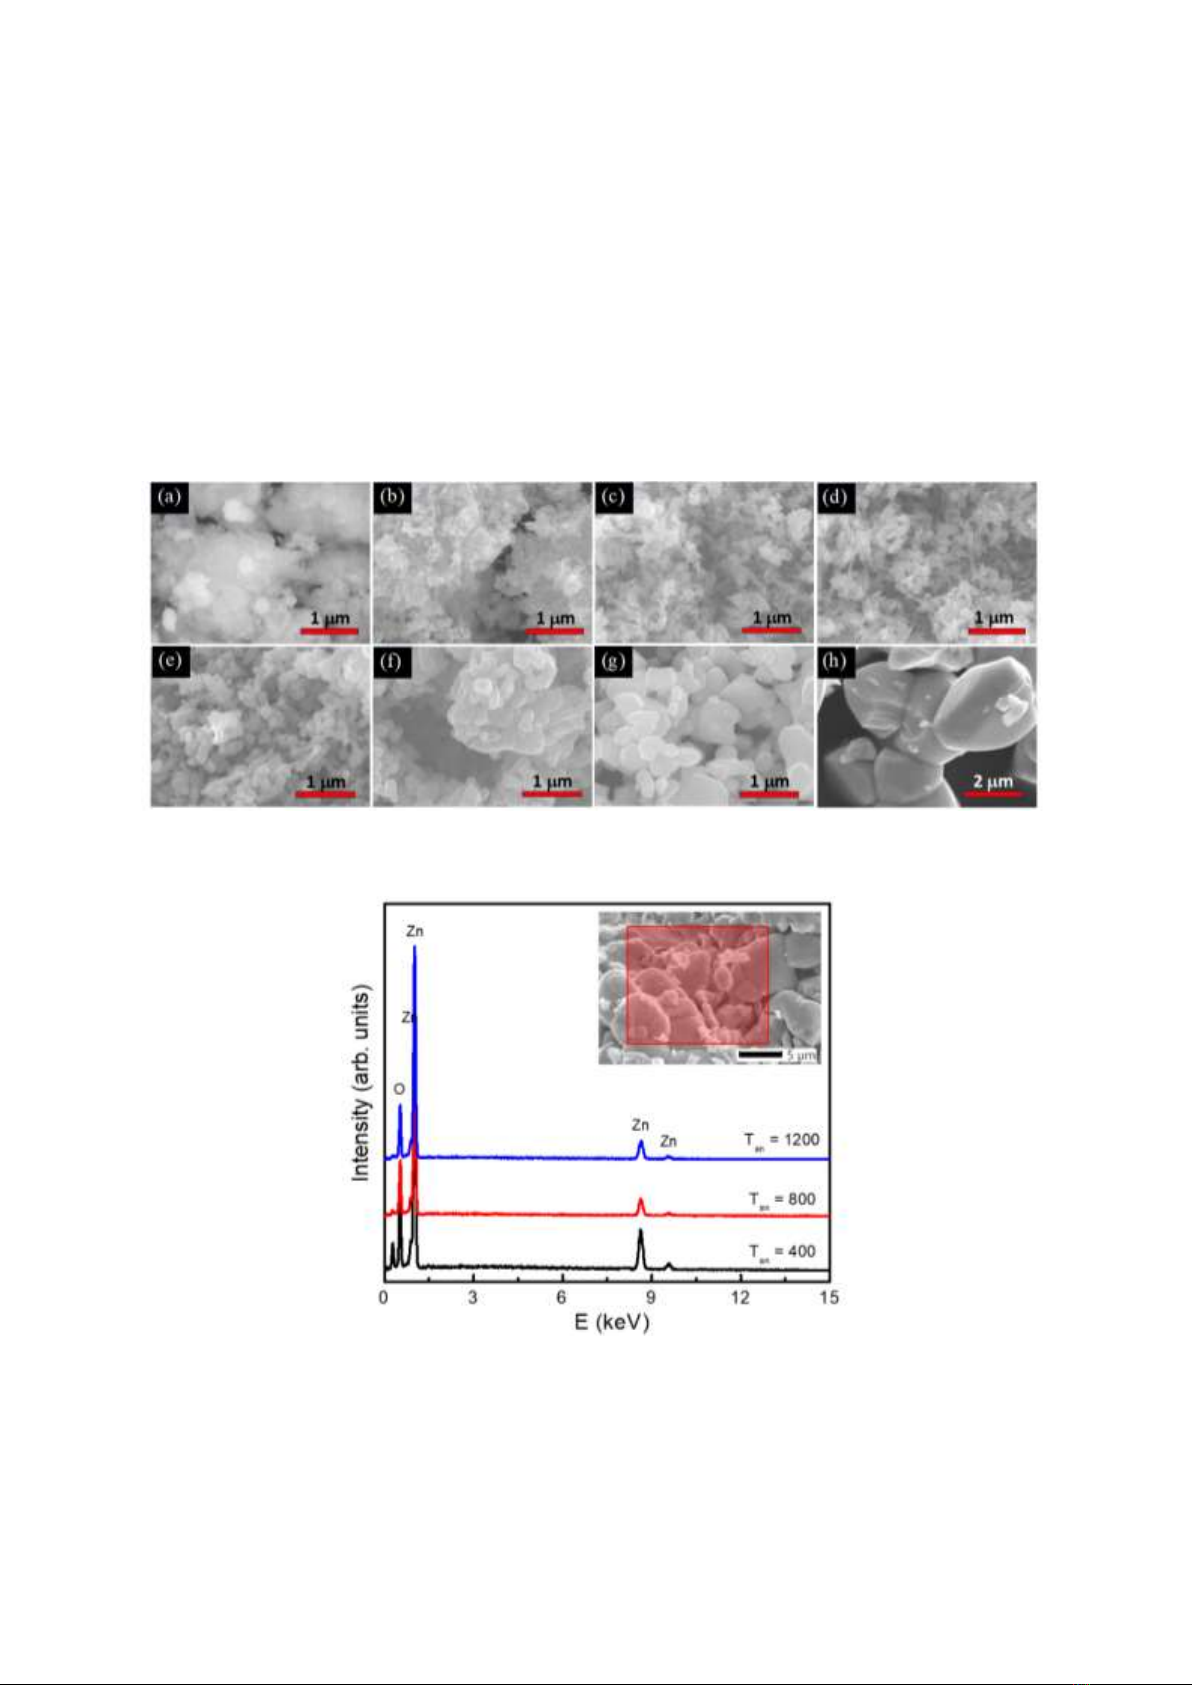
Figure 3. EDS spectra of typical samples with Tan = 400, 800 and 1,200 oC recorded for an inserted area.
K. T. H. My et al. / VNU Journal of Science: Mathematics – Physics, Vol. 41, No. 1 (2025) 34-48
38
Together with micrographs analysis, EDS spectra of representative samples with Tan = 400, 800 and
1,200 oC in the energy range E = 0~15 keV were also recorded. The data graphed in Fig. 3 indicate the
presence of O and Zn at ~0.52 and 8.6 keV, respectively. There is also an additional peak associated
with C at the energy region below O. With the same measurement conditions, we have found a gradual
decrease of the EDS-peak intensity of C when Tan increases, see Fig. 3. This reflects that C incorporated
into ZnO samples (consistent with the results reported by Mar et al., [13]), and C content in ZnO crystals
reduces as raising Tan to high values. Apart from this circumstance, C could be from air persisting in a
vacuum chamber and absorbed on the surface of ZnO nanostructures.
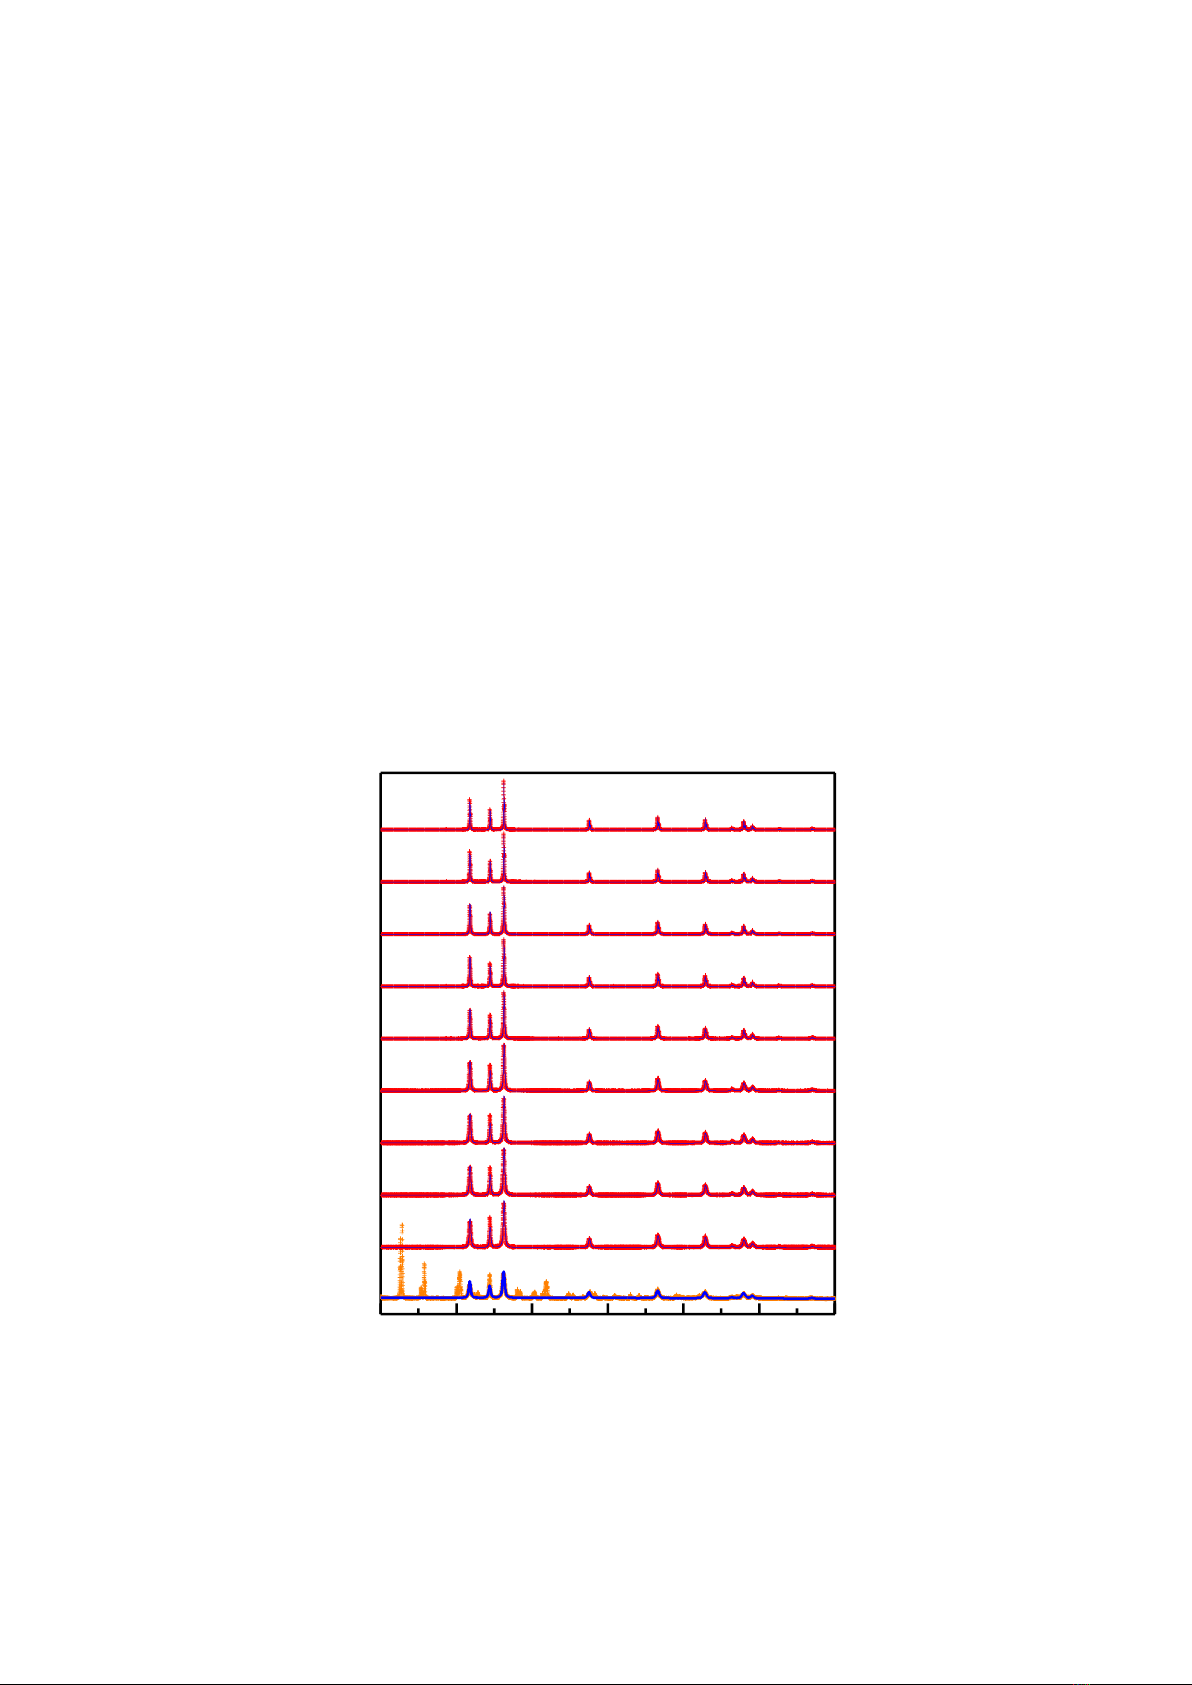
We have also considered the crystal structure of the samples using the powder X-ray diffraction
(XRD) technique combined with Rietveld refinement. Fig. 4 presents the XRD data of zinc acetate
dihydrate annealed at different temperatures. In addition to the diffraction peaks of the initial salt, the
sample annealed at Tan = 200 oC displays diffraction peaks at 31.75°, 34.46°, 36.32°, 41.49°, 56.56°,
62.79°, 67.89°, and 69.04°, indicating the formation of the ZnO wurtzite/hexagonal phase (JCPDS card
No. 36-1451) [7]. Having increased Tan ≥ 250 oC, the samples exhibit only the ZnO wurtzite peaks,
indicating their single-phase nature, as verified by the data refinement using the Rietveld method (Fig.
4). Another notable feature of the XRD data is the unusually high intensity of the (002) peaks, which
cannot be fully described by the wurtzite phase structural model. This effect is more prominent in the
samples with Tan ≤ 400 oC and diminishes as Tan increases and almost disappears in the samples annealed
at Tan ≥ 700 °C. It is can be attributed to the preferential orientation of nanorods developing along the c-
axis direction [16].
20 30 40 50 60 70 80
(201)
(112)
(200)
(103)
(110)
(102)
(101)
(002)
1000 ºC
1200 ºC
700 ºC
800 ºC
600 ºC
200 ºC
500 ºC
400 ºC
300 ºC
250 ºC
2q (degree)
Intensity (arb. units)
(100)
Figure 4. XRD data the samples annealed at Tan = 200 – 1,200 oC. Miller-indexed peaks
are from hexagonal ZnO.