HPU2. Nat. Sci. Tech. Vol 03, issue 01 (2024), 78-87
HPU2 Journal of Sciences:
Natural Sciences and Technology
journal homepage: https://sj.hpu2.edu.vn
Article type: Research article
Received date: 25-9-2023 ; Revised date: 27-02-2024 ; Accepted date: 13-3-2024
This is licensed under the CC BY-NC 4.0
78
Investigation of structural and electronic properties of ZnO using
first principle calculations
Quoc-Van Duong*
Hanoi National University of Education, Hanoi, Vietnam
Abstract
In this research, first-principle calculations have been performed to study the geometry structure and
electronic properties of ZnO. All possible exchange-correlation energy functionals were used to
perform geometry optimization of ZnO in order to find the efficient calculation conditions. Bandgap
energy, density of states (DOS), projected DOS (PDOS); and other properties of ZnO were also
calculated and discussed. The calculated band-gap value of ZnO is less than 1.0 eV, much smaller than
experimental value of 3.37 eV; while the PDOS results indicate the important roles of O 2p and Zn 3d
orbitals in ZnO band structures. The well-known limitation of band-gap value calculations using
Density Functional Theory (DFT) was solved by applying Hubbard potential on Zn 3d and O 2p
orbitals. A full investigation with Hubbard value varying from 0.5 to 10 eV has been performed and
the selected value is 8.0 eV for both Zn 3d and O 2p electrons.
Keywords: ZnO, DFT, pseudopotential, Hubbard potential, electronic structure
1. Introduction
ZnO is an attractive semiconductor due to its interesting physical properties: wide and direct
band-gap value (3.37 eV), high electron mobility and high thermal conductivity [1], [2]. ZnO has been
used in many products such as medicine, cosmetics, food, rubber and solar cells [3]. In photocatalytic
application, ZnO has shown the high efficiency on photodegradation of different organic compounds
like methyl orange [4] or methylene blue [5], [6]. The photocatalytic activity of ZnO can be affected
by various parameters like purity, particle sizes and shapes [7], [8] or light absorbance ability. The
wide band-gap value and high electron-hole recombination rate can also decrease the efficiency of
* Corresponding author, E-mail: vandq@hnue.edu.vn
https://doi.org/10.56764/hpu2.jos.2024.3.1.78-87

HPU2. Nat. Sci. Tech. 2024, 3(1), 78-87
https://sj.hpu2.edu.vn 79
photocatalytic process of ZnO [9]. The two common ways to improve ZnO photocatalytic activity are
doping with other elements or compositing it with other materials. A variety of elements have been
doped into ZnO for this purpose such as Fe [10], Co [11], Ni [12], Al or Ga [13], Ti or V [14]. ZnO is
also composited, with other materials such as CNTs [15], Fe3O4 [16] or perovskite like SrTiO3 [17].
The results show that the photocatalytic activity of ZnO has been improved, suggesting that these
solutions are applicable for real life application. This improvement can be predicted by first-principle
calculations in order to guide the sample fabrication process, which has been done by both free or
commercial software packages like SIESTA [18], VASP [19], [20], WIEN2k [21], [22], Quantum
ESPRESSO [23], CASTEP [24]–[29] and more [30].
ZnO lattice constants can be achieved using geometry optimization, which has been performed
using various software packages and codes based on Density Functional Theory (DFT), but the
calculation conditions are not coincident. Two possible approximation for exchange-correlation were
investigated along with different parameterizations. Using CASTEP, Adnan et al. [29] suggested that
Local Density Approximation (LDA) with Perdew-Zunger parameterization (PZ) should be used for
calculating properties of ZnO, consistent with results of Alharshan et al. [31] and other studies [32]–
[34]. On the other hand, Haffad et al. [18] used SIESTA to show that Generalized Gradient
Approximation (GGA) parameterized with Perdew-Burke-Ernzerhof (PBE) functional gives the best
calculated lattice parameter of ZnO, agreed with experimental result [1] and calculations [24], [27],
[35] while Hamzah et al. [25] indicate that PBESol is a better option when calculating with CASTEP.
Recently, Arfaoui et al. [36] proved that both GGA-PBE and GGA-PBESol can be used for
calculating the structural, electronic and optical properties of ZnO in the framework of Quantum
ESPRESSO while Ali [28] uses CASTEP to indicate that Wu-Cohen (WC) parametrization exhibit
better results for same purpose.
For electronic properties calculation, the well-known limitation of DFT is that the calculated
band-gap energy of ZnO is smaller than the expected value, which is consequence of ignoring the
electron-electron interactions in the materials [37]. To overcome this limitation, Hubbard potential can
be applied to valence electrons, Zn 3d and O 2p for the case of ZnO. Hamzah et al. [25] show that the
acceptable Hubbard potentials for Zn and O are Ud = 5 and Up = 9 eV, respectively. Harun et al. [33]
prove that Hubbard potentials Ud = 5 eV and Up = 7 eV need to be applied to 3d- and 2p-state
electrons of ZnO to achieve a bandgap value of 3.10 eV using Materials Studio while the
corresponding values of Ud = 10.57 eV and Up = 7.1 eV were presented by Qiao et al. [38]. When
using ABINIT, Goh et al. [30] show that there are 2 possible pairs of Hubbard potentials - Ud = 9.5 eV
and Up = 7.86 eV or Ud = 10.0 eV and Up = 7.74 eV - can be used depending on the other calculate
parameters. Thang et al. [20] show that a Hubbard value of 4.7 eV can be used for Zn 3d electrons
when calculated with VASP.
The obtained results show a conflict in the determination of calculation conditions, leading to a
confusion for researchers to select. In this research, a complete investigation on the effects of
pseudopotentials and Hubbard values on the properties of this material has been done using Materials
Studio software. The obtained parameters can be used for latter calculation in order to explain and
predict the physical properties of ZnO-based materials.
HPU2. Nat. Sci. Tech. 2024, 3(1), 78-87
https://sj.hpu2.edu.vn 80
2. Experimental Methods
The calculations were performed using Cambridge Serial Total Energy (CASTEP) [1], [2] - a first
principle program based on density functional theory (DFT) to calculate the properties for a wide
range of materials such as alloys, compounds, ceramics, semiconductors, metals and more, which was
embedded in Materials Studio [3] - a commercial software used for material science. Both Local
Density Approximation (LDA) and Generalized Gradient Approximation (GGA) were used for the
exchange-correlation functional with the different parametrizations: Perdew-Zunger (CA-PZ) [4],
Perdew-Burke-Ernzerhof (PBE) [5], Revised PBE (RPBE) [6] and Perdew-Wang (PW91) [7].
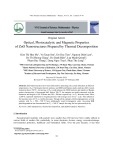
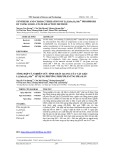
The calculations were executed on a pure ZnO unit cell, containing 2 Zn atoms and 2 O atoms, as
shown in Figure 1. The Monkhorst-Pack scheme k-point grid sampling [8] was sets at 2×2×1 in the
supercell. The interactions between the core and valence electrons (3d104s2 for Zn and 2s22p4 for O)
are described by Vanderbilt ultrasoft pseudopotential [9]. The Hubbard potentials [10], representing
for electron-electron interactions, were both applied to 3d-state electrons of Zn and 2p-state of O with
the values in the range of 0 to 10 eV. The energy change, maximum force, maximum stress and
maximum displacement tolerances in the geometry optimization processes were set at 5×10⁻⁶
eV/atom, 0.01 eV/Å, 0.02 GPa and 0.005 Å, respectively.
3. Results and discussion
3.1. Structural Properties
Figure 1. Unit cell of ZnO.
Table 1. Optimized structures of ZnO.
Functional
a = b (Å)
c (Å)
LDA-PZ
3.1861
5.1497
GGA-PBE
3.2841
5.2960
GGA-RPBE
3.3146
5.3463
GGA-PW91
3.2896
5.2913
Calculated [11]
3.2340
5.2720
Experiment [12]
3.2490
5.2040
JCPDS 36-1451
3.2498
5.2066
Table 1 shows the lattice constants of ZnO calculated using Materials Studio with different
functionals, previous work and experiment. All optimized structures have hexagonal lattice system
where a = b ≠ c and = = 90o, = 120o. It can be seen that GGA-PBE gives the best results in
geometry optimization with the lattice constants of a = 3.2841 Å and c = 5.2960 Å, in good agreement
with experimental values [12] and previous theoretical works [13]–[15].
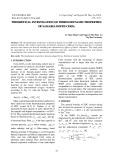
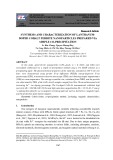
Figure 2 shows the band structures of ZnO calculated using different functionals: LDA-PZ, GGA-
PBE, GGA-RPBE and GGA-PW91. All obtained results show that ZnO is a direct band-gap
semiconductor, the smallest band-gap value originated at G-G transition, in good agreement with
previous studies [11], [16]. The values of band-gap calculated using LDA, PBE, RPBE and PW91 are
1.076 eV, 0.800 eV, 0.824 eV and 0.793 eV, respectively. These values are larger than the calculated
𝑎
𝑏
𝑐
Zn
O
HPU2. Nat. Sci. Tech. 2024, 3(1), 78-87
https://sj.hpu2.edu.vn 81
results of Mohamad et al. [16] or Haffad et al. [11], close to the work of Hassan [17] but much smaller
than the experimental value 3.37 eV [12]. The deviation in band-gap values is the consequence of
ignoring interaction between valence electron in the material, similar to the calculated band-gap for
TiO2 [18], is the consequence of well-known limitations related to the basis of DFT [19]. This
deviation can be solved by adding Hubbard potential [10] to the corresponding valence electrons – 3d
and 4s for Zn and 2p for O in the case of ZnO.
3.2. Electronic Structures
Figure 2. Band structures of ZnO calculated using (a) LDA-PZ, (b) GGA-PBE, (c) GGA-RPBE and (d)
GGA-PW91.
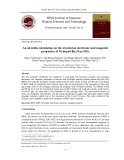
Figure 3 presents the density of states (DOS) of ZnO calculated using GGA-PBE in the range of
-10 eV to 15 eV. Both valence bands, from -0 eV to 0 eV, and conduction band, from 1 eV to 15 eV
result almost from the hybridization of Zn 3d and O 2p orbitals, consistent with previous calculations
[16], [20]. The projected density of states of Zn and O in Figure 3b and 3c also indicates that Zn 4s
electrons contribute an insignificant part in the formation of ZnO band structure from -10 eV to 15 eV,
details can be seen in the work of Bakhtiar et al. [21]. The negligible contribution of Zn 4s suggest that
Hubbard potential can be considered for Zn 3d and O 2p valence electrons only.
HPU2. Nat. Sci. Tech. 2024, 3(1), 78-87
https://sj.hpu2.edu.vn 82
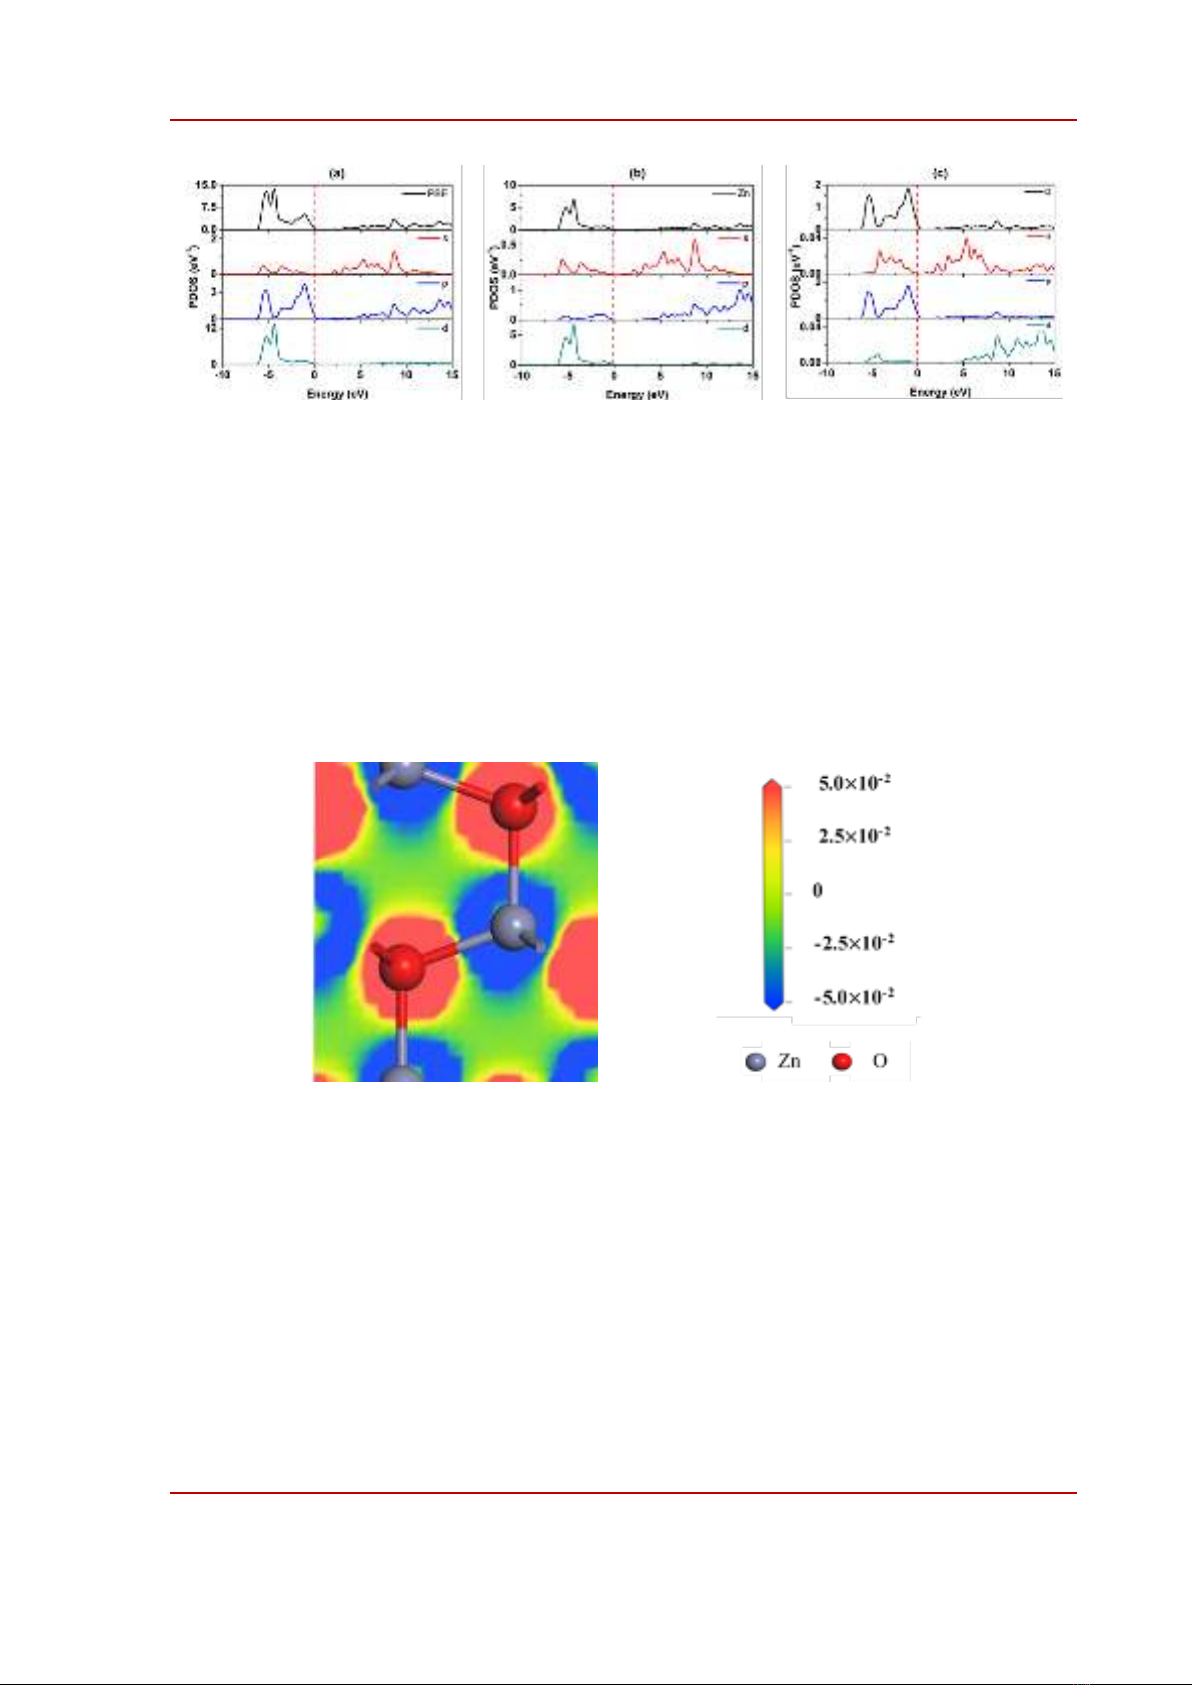
Figure 3. Partial Density of State (PDOS) of (a) ZnO, (b) Zn and (c) O in ZnO.
3.3. Zn-O bondings
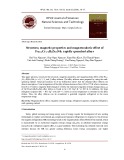
The electron deformation density of ZnO can be calculated 𝚫𝝆(𝒓)= 𝝆𝒁𝒏𝑶 − 𝝆𝒁𝒏 − 𝝆𝑶 whereas
𝝆𝒁𝒏𝑶 is the electron density of ZnO, 𝝆𝒁𝒏 and 𝝆𝑶 are the electron densities of Zn atoms and O atoms
only [36]. Figure 4 shows the electron deformation density of a ZnO unit cell calculated using GGA-
PBE at the isosurface of ±0.05. The red color indicates the accumulation while the blue color
represents the depletion of electron in the region. In ZnO, the electron density of Zn decreases while
the electron density of O decreases, suggests that valence electrons have transferred from Zn to O to
form the covalence bonds, in good agreement with experiment [37].
Figure 4. Electron deformation density of ZnO.