
Open Access
Available online http://ccforum.com/content/11/4/R88
Page 1 of 8
(page number not for citation purposes)
Vol 11 No 4
Research
Longitudinal increases in mitochondrial DNA levels in blood cells
are associated with survival in critically ill patients
Hélène CF Côté1, Andrew G Day2 and Daren K Heyland3
1Department of Pathology and Laboratory Medicine, University of British Columbia, Vancouver, Canada V6T 2B5
2Clinical Research Centre, Kingston General Hospital, Kingston, Canada K7L 2V7
3Department of Medicine, Queen's University and Critical Care Program, Kingston General Hospital, Kingston, Canada K7L 2V7
Corresponding author: Hélène CF Côté, helene.cote@ubc.ca
Received: 29 Jun 2007 Revisions requested: 19 Jul 2007 Revisions received: 10 Aug 2007 Accepted: 15 Aug 2007 Published: 15 Aug 2007
Critical Care 2007, 11:R88 (doi:10.1186/cc6096)
This article is online at: http://ccforum.com/content/11/4/R88
© 2007 Côté et al.; licensee BioMed Central Ltd.
This is an open access article distributed under the terms of the Creative Commons Attribution License (http://creativecommons.org/licenses/by/2.0),
which permits unrestricted use, distribution, and reproduction in any medium, provided the original work is properly cited.
See related commentary by Deutschman and Levy, http://ccforum.com/content/11/4/158
Abstract
Background Mitochondrial dysfunction may be causally related
to the pathogenesis of organ failure in critically ill patients.
Decreased mitochondrial DNA (mtDNA) levels have been
associated with mitochondrial dysfunction and were
investigated here in relation to short-term (31-day) survival.
Methods This was a prospective longitudinal cohort study of 28
mechanically ventilated critically ill adults admitted to a single
center tertiary care intensive care unit (ICU) with hypotension
secondary to cardiogenic (N = 13), septic (N = 14) or
hypovolemic (N = 1) disease processes. Clinical data and blood
were collected at baseline and patients were followed until they
expired or left the ICU. Blood was collected every Monday,
Wednesday and Friday, and the buffycoat relative mtDNA/
nuclear DNA (nDNA) ratio was determined. An archived pool of
healthy controls was also studied.
Results At baseline, the patients' mtDNA/nDNA ratio was 30%
lower than a pool of 24 healthy controls (0.76 versus 1.09) and
was not different between short-term survivors and non-
survivors (0.74 ± 0.05 (N = 16) versus 0.79 ± 0.06 (N = 12), p
= 0.49). By day 4, the percent mtDNA/nDNA change from
baseline in survivors was significantly different from that in non-
survivors (+29.5% versus -5.7%, p = 0.03). It also tended to be
higher in survivors at last measurement (+38.4% versus +7.1%,
p = 0.06). There was a weak correlation between within patient
mtDNA/nDNA and platelet count (r = 0.20, p = 0.03) but not
with Sequential Organ Failure Assessment (SOFA) scores (r =
0.12, p = 0.23). The mtDNA associations remained after
adjustment for platelet.
Conclusion Blood mtDNA levels appeared initially low,
increased over time in patients who ultimately survived, and
remained low in those who did not. This is consistent with
mitochondrial recovery being associated with survival and
warrants further investigation as a marker of mitochondrial
alterations and outcome in critical illness.
Introduction
It is well known that oxygen consumption appears reduced in
critically ill patients [1]. The primary oxygen consumer in
human cells is the mitochondrial respiratory chain, which is
responsible for 90% of oxygen consumption under normal
conditions, and accounts for most of the cellular ATP produc-
tion. The facts that optimized tissue oxygenation does not pre-
vent organ failure and death [2] and that mitochondrial
damage occurs in the absence of hypoxia [3,4] indicate that
impaired oxygen utilization by the mitochondria and not only
oxygen availability is at play in critical illness.
This bioenergetics failure has been hypothesized as part of the
mechanism underlying multiple organ failure and death [5,6]
and is supported by several lines of evidence. For example,
several animal models of sepsis have demonstrated inhibition
of mitochondrial function [7] as well as depletion of the
number of heart [8] and liver [9] mitochondria that were not
due to cell death. In a rat model of sepsis, mitochondrial DNA
APACHE II = Acute Physiologic and Chronic Health Evaluation II score; ICU = intensive care unit; mtDNA = mitochondrial DNA; nDNA = nuclear
DNA; SOFA = Sequential Organ Failure Assessment; TLR4 = toll-like receptor 4.

Critical Care Vol 11 No 4 Côté et al.
Page 2 of 8
(page number not for citation purposes)
(mtDNA) damage and depletion, accompanied by decreased
mtDNA transcription, preceded bioenergetics failure while
restoration of mtDNA integrity appeared linked to mitochon-
drial biogenesis [10]. In human volunteers, systemic inflamma-
tion following in vivo endotoxin administration was associated
with widespread transcriptional down-regulation of the mito-
chondrial energy production machinery [11]. In critically ill
patients, strict glucose control with insulin has been associ-
ated with reduced mortality [12] and, interestingly, was also
shown to prevent hepatic mitochondrial ultrastructural dam-
age [13]. In septic patients, skeletal muscle ATP concentra-
tions and mitochondrial complex I activity were both
significantly reduced in individuals who subsequently died
compared to septic patients who survived and controls [5].
Finally, another group also found decreased muscle mitochon-
dria content in critically ill patients with sepsis-induced multi-
ple organ failure [14].
In other settings such as HIV antiretroviral therapy, clinically
symptomatic mitochondrial dysfunction has been associated
with mtDNA depletion [15]. Each tissue contains more or less
mitochondria depending on its energy requirement, translating
into several hundred to several thousand copies of mtDNA per
cell. In sepsis, it has been suggested that excessive oxidative
stress in the mitochondria may effect changes in mtDNA quan-
tity [16]. It could also decrease mtDNA quality by causing
mutations or deletions. Of note, damaged mitochondria can
still replicate, even in the absence of cellular division, and elim-
ination of mitochondria (also termed mitoptosis) can occur,
presumably in response to damage at the mitochondrial level,
while the cells remain viable [17,18]. Hypothetically, if organ
failure was driven by mitoptosis, then a concurrent decrease in
mtDNA could be expected while the cells and tissues remain
apparently alive yet dysfunctional, up to a point of no return.
The aim of this study was to describe blood cell mtDNA levels
in critically ill patients and evaluate their association with inten-
sive care unit (ICU) survival and admission diagnosis. We
hypothesized that persistent low blood mtDNA levels are
associated with mortality.
Materials and methods
Study population
This study is a sub-study of a single center, open-label, phase
I, prospective, optimal dose-finding clinical trial of glutamine
and antioxidants conducted at the Kingston General Hospital,
Kingston, Canada, the details of which were recently pub-
lished [19]. Consecutive eligible adult patients admitted to
ICU within the last 24h, requiring mechanical ventilation, with
clinical evidence of hypotension, and expected to stay more
than 48h were enrolled. We defined clinical evidence of hypo-
tension as the need for vasopressor agents (norepinephrine,
epinephrine, neosynephrine, vasopressin, or ≥5 mg/kg/minute
of dopamine) for more than 1h or a systolic blood pressure
≤90 mmHg or mean arterial pressure <70 mmHg for more
than 1h despite adequate fluid challenge. Patients were ineli-
gible if they had no gastrointestinal tract access, severe head
trauma, cirrhosis, were severely underweight (<50 kg) or preg-
nant, or if they were already enrolled in another ICU interven-
tional study. Upon enrolment, age, sex, co-morbidities,
admission diagnosis, APACHE II [20], and Sequential Organ
Failure Assessment (SOFA) [21] scores were recorded.
Study participants were part of four groups (N = 7 each) who
were all given various doses of antioxidant in the form of
glutamine dipeptides (Dipeptiven®) and selenium (MicroSel®)
(see [19] for details). The patients were followed closely, and
organ dysfunction was calculated daily using SOFA score.
Written informed consent was obtained from next of kin to
enable participation of eligible patients. This study protocol
was approved by the Research Ethics Board at Queen's
University.
Blood sample collection
Venous blood was collected in EDTA at study entry and every
Monday, Wednesday, and Friday over the following 28 days,
until death or discharge from the ICU. The tubes were spun at
2,500 g for 10 minutes to separate plasma and buffycoat cell
pellet. The latter was stored frozen at -70°C until used.
Assays
Total DNA was extracted from 0.1 ml of buffycoat using a
QiaAMP DNA kit (Qiagen Mississauga, Ontario, Canada) from
a total of 159 samples collected from 28 individuals. The rela-
tive mtDNA/nuclear DNA (nDNA) ratios were determined by
real-time PCR with fluorescent probes, as described else-
where [12,22]. All quantifications were performed on a Light-
Cycler 1.2 (Roche, Laval, Quebec, Canada). The mtDNA
content of the cells is expressed as a relative mtDNA/nDNA
ratio: the nuclear DNA copy number per cell being considered
constant, alteration of the ratio can be attributed to changes in
mtDNA content. No control samples from healthy patients
were collected as part of this study. However, for the sake of
comparison, the mtDNA/nDNA ratio of a DNA pool containing
buffycoat DNA from 24 healthy males (average age 39 years
old) and used as internal control for the assays showed a
mean ± standard deviation relative mtDNA/nDNA ratio of 1.09
± 0.17. The mtDNA/nDNA ratios or platelet count of the 24
individual blood samples used to generate the pool was not
available.
Of note, platelets contain an average of four copies of mtDNA
per platelet, but no nDNA [23]. As such, their number and
mtDNA content could influence the mtDNA/nDNA ratio in
blood [24]. In addition, although there have been conflicting
reports about changes in muscle mtDNA content over time
[25,26], there have been no reports about changes in blood
mtDNA content with age in adults.

Available online http://ccforum.com/content/11/4/R88
Page 3 of 8
(page number not for citation purposes)
Statistical analyses
Baseline, early (4 ± 1 days), and late (last measurement
recorded) values of the mtDNA/nDNA ratio are described in
this population. Spearman's partial correlation (controlling for
subject) was used to measure within subject correlation
between mtDNA and platelet count, as well as mtDNA and
SOFA scores. Spearman's correlation was used for baseline
mtDNA versus baseline APACHE score correlation. All com-
parisons between 31-day survivors and non-survivors used the
two-sample t-test, except for ICU duration and number of sam-
ples collected, which used the Wilcoxon-Mann-Whitney non-
parametric test due to their strong positive skew. Analysis of
covariance was used to repeat the comparison of the mtDNA
measurements between survivors and non-survivors after
adjusting for platelet counts, white blood cell count, and anti-
oxidant dosing group. In addition, a linear mixed model with
random patient intercepts and slopes was used to compare
the average slope of the longitudinal mtDNA/nDNA ratio over
the first 14 days by survival status. This model was estimated
by restricted maximum likelihood as implemented by the
MIXED procedure of SAS version 8.2 [27].
Results
There were 28 subjects enrolled in the study, including 8
females and 20 males, with an average age of 67 years old. Of
these, 13 patients (46%) had cardiogenic shock while 14
(50%) were diagnosed with septic shock and 1 (4%) with
hypovolemic shock (Table 1). A total of 159 distinct samples
were collected longitudinally every two to three days while the
patients were in ICU and used for these analyses, for an overall
median [interquartile range] of 5.0 [4.0 to 7.5] samples per
patient. Of the 28 subjects in the study, 12 patients died within
31 days of ICU admission. Of those who died, 8 had septic
and 4 had cardiogenic shock. Over the study period, both sur-
vivors and non-survivors had a similar number of samples (5.5
[4.0 to 7.0] versus 4.5 [3.0 to 8.0] (p = 0.45)) collected over
a similar number of days in ICU (11.5 [7.6 to 17.8] versus12.9
[5.7 to 26.3] (p = 0.51)).
At baseline, the mean baseline relative mtDNA/nDNA ratio for
all 28 critically ill patients (0.76) was approximately 30% lower
than the ratio measured for the historical pool of control buffy-
coat of 24 healthy subjects (1.09). There was no difference
between the baseline mtDNA/nDNA ratio of survivors and
non-survivors (p = 0.49; Table 2). At baseline, there was also
no correlation between mtDNA and APACHE scores (r =
0.27, p = 0.16). The percent change in the mtDNA/nDNA ratio
from baseline to day 4 (± 1 day) was significantly greater in
survivors (+29.5% versus -5.7%, p = 0.03) compared to non-
survivors. This was maintained to the last measurement availa-
ble, where the percent change from baseline also tended to be
greater for survivors (+38.4% versus +7.1%, p = 0.06).
Within patients, a weak but significant partial correlation was
observed between blood mtDNA and platelet count (r = 0.20,
p = 0.03) but not between mtDNA and daily SOFA score (r =
-0.12, p = 0.23). Given the weak relationship observed
between platelet count and mtDNA levels, the influence of the
latter on the mtDNA/nDNA ratio was investigated. As seen in
Table 2, the associations between mtDNA and survival were
largely unaffected after adjusting for platelets. Table 3 further
demonstrates that the changes in mtDNA were not driven by
changes in platelets. Similar estimates were maintained after
adjustment for platelets as well as white blood cell count and
antioxidant dosage group, although the statistical significance
was lost. After adjustment for platelet and white blood cells,
the mean ± standard error change in mtDNA at 4 ± 1 days was
+27.9 ± 10.5 for survivors versus -3.5 ± 12.3 for non-survivors
(p = 0.07), and if the antioxidant group was added, this
became +24.4 ± 10.4 versus +1.1 ± 12.2 (p = 0.18).
From the linear mixed model, we estimated that the average
Table 1
Study subject characteristics
N28
Age, mean (range) 67 (34–81)
Female, N (percent) 8 (29)
APACHE II score, mean (range) 22.4 (15–37)
Etiology of shock, N (percent)
Cardiogenic 13 (46)
Septic 14 (50)
Hypovolemic 1 (4)
ICU days, median [IQR] 11.5 [6.3–20.3]
Short-term mortality, N (percent) 12 (43)
ICU, intensive care unit; IQR, interquartile range.

Critical Care Vol 11 No 4 Côté et al.
Page 4 of 8
(page number not for citation purposes)
slope (estimate ± standard error) of the longitudinal change in
mtDNA/nDNA over the first 14 days was statistically signifi-
cant for survivors (0.024 ± 0.010, p = 0.02) but nearly flat for
non-survivors (0.002 ± 0.013, p = 0.85). However, the differ-
ence between the two slopes, as estimated by the interaction
between time and survival status, was not statistically signifi-
cant (0.022 ± 0.016, p = 0.18; Figure 1). We repeated the
modeling exercise using data from the first 7 and 10 days and
our findings were consistent with the exception that the p val-
ues for the differences between the two slopes were p = 0.11
for the 7 day model and p = 0.10 for the 10 day model. Similar
estimates were also maintained after adjustment for platelet
count and antioxidant dosage group (not shown). Figure 2 pro-
vides a closer look at the change in buffycoat mtDNA levels
between the first sample collected (baseline) and that col-
lected at 4 ± 1 days in the ICU.
Discussion
On the first day of enrolment, mechanically ventilated critically
ill patients with clinical evidence of hypotension had a relative
buffycoat mtDNA/nDNA ratio that appeared lower than that of
a pool of healthy historical controls, suggestive of some mito-
chondrial alteration. Of note, the historical control pool is pre-
sented for general rather than statistical comparison as it
consisted of generally younger individuals whose individual
blood mtDNA/nDNA ratio or platelet counts were not known.
No significant difference was observed in the baseline blood
mtDNA level of those who would survive as opposed to those
who would die within the short term. However, those who sur-
vived were more likely to experience an increase in blood
mtDNA content over time than those who died, suggesting
that recovery of mtDNA content is associated with a better
outcome.
Blood buffycoats contain platelets, which in turn contain a
small amount of mtDNA. It is not unexpected, therefore, to
observe some relationship between platelet count (which is
often affected in critical illness) and mtDNA levels. However,
the associations observed here were all maintained after
adjusting for platelet count. Trends were also maintained after
adjusting for antioxidant dosage and white blood cell count.
The mechanism by which mtDNA is depleted in this patient
population and the chronology of the molecular events
involved is unclear. More than one scenario can be hypothe-
sized. On the one hand, the apparent decrease in mtDNA con-
tent at baseline could reflect an early event associated with
shock and causing mtDNA damage. A potential pathway for
shock-related mitochondrial damage would be through the
toll-like receptor 4 (TLR4) [28]. TLR4 has been shown to
mediate mtDNA damage through increased oxidative stress
and inducible nitric oxide synthase expression in a mouse
model of bacterial sepsis [29]. Changes in TLR4 expression
Table 2
Blood mitochondrial DNA/nuclear DNA ratio in short-term survivors versus non-survivors
No adjustment Adjusted for platelet count
mtDNA/nDNA ratio Survivors (N = 16) Non-survivors (N = 12) P value Survivors (N = 16) Non-survivors (N = 12) P value
At baseline 0.74 ± 0.05 0.79 ± 0.06 0.49 0.74 ± 0.05 0.79 ± 0.06 0.49
At day 4 (± 1) 0.94 ± 0.08 0.73 ± 0.09 0.10 0.95 ± 0.08 0.72 ± 0.10 0.10
At last measurement 0.98 ± 0.06 0.79 ± 0.07 0.04 0.97 ± 0.06 0.79 ± 0.07 0.05
Change at day 4 (± 1) +29.5 ± 10.1 -5.7 ± 11.6 0.03 +30.3 ± 10.3 -6.6 ± 11.9 0.03
Change at last
measurement
+38.4 ± 10.5 +7.1 ± 12.1 0.06 +36.5 ± 10.4 +9.7 ± 12.0 0.11
Results presented as mean ± standard error. mtDNA, mitochondrial DNA; nDNA, nuclear DNA.
Table 3
Blood platelet count in short-term survivors versus non-survivors
Platelet count Survivors (N = 16) Non-survivors (N = 12) Difference (survivors – non-survivors) P value
At baseline 157 ± 21 176 ± 25 -19 ± 33 0.57
At day 4 (± 1) 139 ± 22 186 ± 26 -48 ± 34 0.18
At last measurement 262 ± 35 239 ± 40 23 ± 53 0.67
Change at day 4 (± 1) -6 ± 10 +10 ± 12 -16 ± 15 0.32
Change at last measurement +91 ± 25 52 ± 29 +39 ± 38 0.31
Results presented as mean ± standard error.
Available online http://ccforum.com/content/11/4/R88
Page 5 of 8
(page number not for citation purposes)
and/or signaling have also been implicated in hemorrhagic
shock in animal models [30-32]. As stressful oxidative
conditions to the cell and its mitochondria are induced, this
may trigger the elimination of mitochondria from cells, much as
observed in vitro [18] and more recently in vivo [9]. In the
former study, when cultured cells were treated for two to three
days with inhibitors of bioenergetic functions, such as uncou-
plers of the mitochondrial respiratory chain, a large percentage
(50% to 70%) of cells died but those that survived showed no
sign of apoptosis and had very low mtDNA content. Cell death
was not caused by lack of energy but the authors suggested
hyperproduction of reactive oxygen species as the probable
reason for cell death [18]. They hypothesized that cells elimi-
nating mitochondria would show a selective advantage by low-
ering the content of pro-apoptotic mitochondrial proteins and
eliminating the major source of reactive oxygen species. Simi-
larly, in a mouse model, increased lysosomal clearance of dam-
aged liver mitochondria was inferred during the subacute
phase of sepsis [9]. The authors suggested a dynamic turno-
ver and replacement of damaged mitochondria over time.
Drawing a parallel with patients in shock, depletion of
mitochondria (and mtDNA) may be the result of extreme oxida-
tive stress and the damage it causes. Failure to recover mito-
chondria once the insult is withdrawn would be detrimental to
the patient outcome. Antioxidants, through reduction of oxida-
tive stress damage, might offer cellular protection. This would
be in agreement with antioxidants having a protective effect on
the mitochondria, as has been suggested [16,19] and may
partially explain the apparent therapeutic benefit to antioxidant
supplementation in critical illness [33,34].
On the other hand, mtDNA depletion may be a relatively late
event in response to cell death signaling. Xue and colleagues
[35] showed that eukaryotic cells can eliminate their mitochon-
dria in a highly specific manner, without affecting other
organelles. Again, if a parallel is made with the condition of
shock, severe and persistent mitochondria depletion may be a
marker of an irreversible path toward death, possibly by multi-
organ dysfunction syndrome. However, in this case, one may
have expected stable mtDNA levels in survivors and declining
ones in non-survivors, which is not the observation made here.
If fewer mitochondria per cell is at least in part responsible for
the apparent mitochondrial dysfunction observed in sepsis,
this depletion may also contribute to diminished overall mito-
chondrial respiratory chain activity and impaired oxygen use or
hypoxia, as seen in association with shock. Consistent with
this concept, mitochondria-depleted eukaryotic cells have
been shown to survive longer in hypoxic conditions [35]. Other
mechanisms, such as reduced pyruvate delivery to the mito-
chondrial tricarboxylic acid cycle or inhibition of mitochondrial
enzymes, have also been suggested [36].
Although much more research is required to elucidate the
mechanism of mtDNA depletion in shock, this exploratory
study would be in agreement with the general hypothesis
brought forth by Brealey and Singer [6], namely that the cell
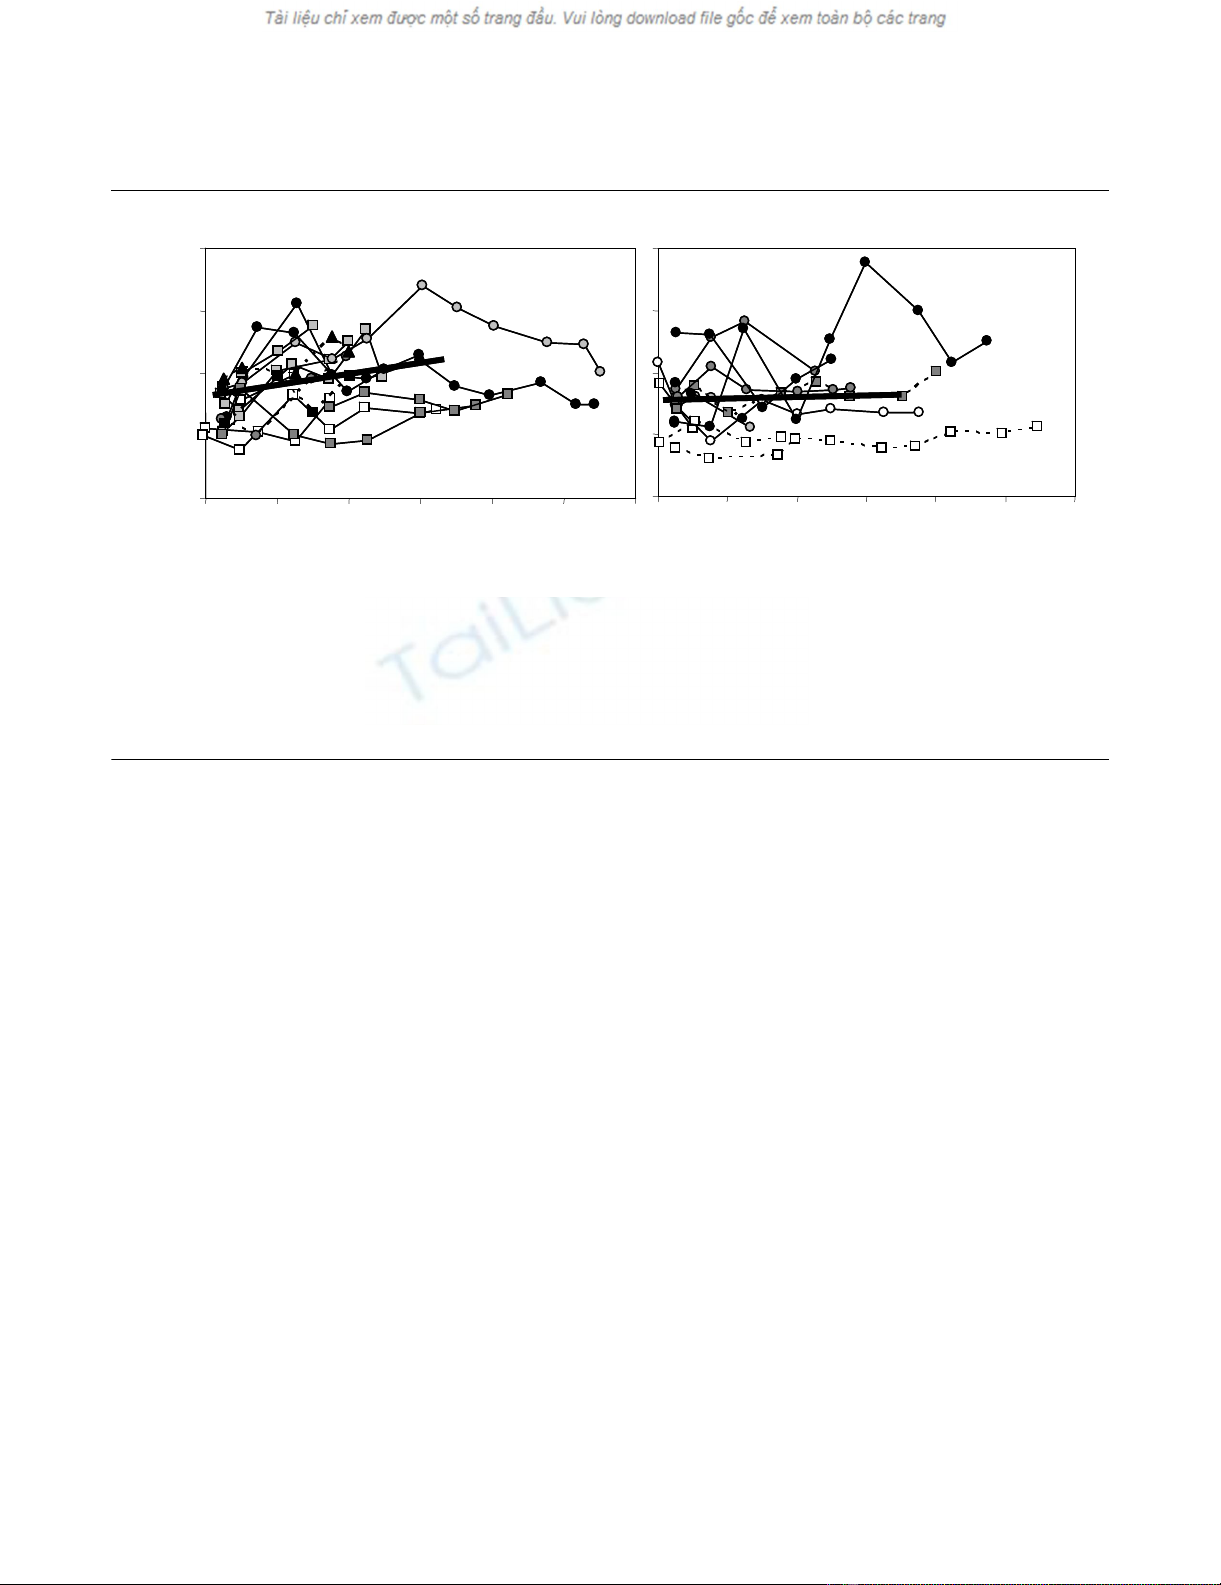
Figure 1
Longitudinal relative blood mitochondrial DNA (mtDNA)/nuclear DNA (nDNA) ratioLongitudinal relative blood mitochondrial DNA (mtDNA)/nuclear DNA (nDNA) ratio. Of the 28 critically ill subjects, survivors are presented in (a) and
non-survivors in (b). Patients admitted with septic shock are represented by circles, those with cardiogenic shock by squares, and the hypovolemic
patient by a triangle. Patients belonging to the four antioxidant treatment groups are distinguished by the color of their symbol (white, light grey, dark
grey and black). Males are represented by a solid line and females by a dashed line. The thick lines represent the linear modeling of the mean
mtDNA/nDNA slopes for the short-term survivors (N = 16, solid line) and the non-survivors (N = 12, dashed line) over the first 14 days after enroll-
ment. Though the entire duration of data collected is shown on the graph, only data collected up to the first 14 days are used in the linear model
shown here. ICU, intensive care unit.
0.0
0.5
1.0
1.5
2.0
04812162024
mtDNA/nDNA ratio
Survivors
Days in ICU
04812162024
Non-survivors
Days in ICU
0.0
0.5
1.0
1.5
2.0
04812162024
mtDNA/nDNA ratio
Survivors
Days in ICU
04812162024
Non-survivors
Days in ICU


![Vaccine và ứng dụng: Bài tiểu luận [chuẩn SEO]](https://cdn.tailieu.vn/images/document/thumbnail/2016/20160519/3008140018/135x160/652005293.jpg)


%20--%3e%3cdefs%3e%3cstyle%3e%20.st0%20{%20fill:%20%23fff;%20}%20.st1%20{%20fill:%20%237800fa;%20}%20%3c/style%3e%3c/defs%3e%3cpath%20class='st1'%20d='M117.78,12.18H43.11c2.9,3.47,4.65,7.94,4.65,12.82,0,5.6-2.3,10.66-6.01,14.29h76.02l7.22-13.56-7.22-13.56Z'/%3e%3cg%3e%3cpath%20class='st0'%20d='M53.58,26.17h-.59v-1.46h.59v-4.96h2.83c1.78,0,2.67.94,2.67,2.82v5.76c0,1.87-.89,2.81-2.67,2.81h-2.83v-4.96ZM55.36,21.37v3.34h1.1v1.46h-1.1v3.34h1.01c.61,0,.91-.37.91-1.1v-5.93c0-.74-.3-1.1-.91-1.1h-1.01Z'/%3e%3cpath%20class='st0'%20d='M65.99,31.14h-1.8l-.31-2.07h-2.19l-.31,2.07h-1.64l1.82-11.39h2.62l1.82,11.39ZM65.28,18.04c-.25.46-.51.77-.75.94-.21.15-.47.22-.79.22-.26,0-.57-.07-.92-.22l-.38-.15c-.14-.05-.26-.07-.37-.07-.3,0-.53.18-.71.54l-.91-.68c.25-.46.51-.77.75-.94.21-.14.48-.21.79-.21.26,0,.57.07.92.21l.38.15c.14.05.26.07.37.07.3,0,.53-.18.71-.54l.91.68ZM61.91,27.52h1.73l-.87-5.76-.87,5.76Z'/%3e%3cpath%20class='st0'%20d='M74.53,26.89v1.52c0,1.91-.89,2.86-2.67,2.86s-2.67-.95-2.67-2.86v-5.93c0-1.91.89-2.86,2.67-2.86s2.67.95,2.67,2.86v1.11h-1.69v-1.22c0-.75-.31-1.12-.93-1.12s-.93.37-.93,1.12v6.15c0,.74.31,1.11.93,1.11s.93-.37.93-1.11v-1.63h1.69Z'/%3e%3cpath%20class='st0'%20d='M81.4,31.14h-1.8l-.31-2.07h-2.19l-.31,2.07h-1.64l1.82-11.39h2.62l1.82,11.39ZM75.9,19.2l1.52-1.91h1.71l1.51,1.91h-1.61l-.76-.95-.75.95h-1.61ZM77.32,27.52h1.73l-.87-5.76-.87,5.76ZM83.1,15.99l-1.76,1.91h-1.26l1.17-1.91h1.86Z'/%3e%3cpath%20class='st0'%20d='M84.86,19.75c1.78,0,2.67.94,2.67,2.82v1.48c0,1.87-.89,2.81-2.67,2.81h-.85v4.28h-1.79v-11.39h2.64ZM84.01,21.37v3.86h.85c.58,0,.87-.36.87-1.08v-1.71c0-.71-.29-1.07-.87-1.07h-.85Z'/%3e%3cpath%20class='st0'%20d='M93.51,19.75c1.78,0,2.67.94,2.67,2.82v1.48c0,1.87-.89,2.81-2.67,2.81h-.85v4.28h-1.79v-11.39h2.64ZM92.66,21.37v3.86h.85c.58,0,.87-.36.87-1.08v-1.71c0-.71-.29-1.07-.87-1.07h-.85Z'/%3e%3cpath%20class='st0'%20d='M98.8,31.14h-1.79v-11.39h1.79v4.88h2.03v-4.88h1.83v11.39h-1.83v-4.88h-2.03v4.88Z'/%3e%3cpath%20class='st0'%20d='M105.36,24.55h2.46v1.62h-2.46v3.34h3.09v1.63h-4.88v-11.39h4.88v1.63h-3.09v3.18ZM108.17,17.29l-1.76,1.91h-1.26l1.17-1.91h1.86Z'/%3e%3cpath%20class='st0'%20d='M112.2,19.75c1.78,0,2.67.94,2.67,2.82v1.48c0,1.87-.89,2.81-2.67,2.81h-.85v4.28h-1.79v-11.39h2.64ZM111.35,21.37v3.86h.85c.58,0,.87-.36.87-1.08v-1.71c0-.71-.29-1.07-.87-1.07h-.85Z'/%3e%3c/g%3e%3ccircle%20class='st1'%20cx='25'%20cy='25'%20r='20'/%3e%3cpath%20class='st0'%20d='M32.78,19.27c2.92,0,4.43,2.55,5.28,5.33l.71,2.17c.14.38-.33.75-.71.75h-5.61c.19-.33.24-.71.09-1.08l-.75-2.45c-.43-1.32-.99-2.64-1.79-3.77.75-.57,1.65-.94,2.78-.94h0ZM25,18.38c3.25,0,4.9,2.78,5.89,5.89l.76,2.45c.14.42-.33.8-.8.8h-11.69c-.42,0-.94-.38-.8-.8l.75-2.45c.99-3.11,2.64-5.89,5.89-5.89h0ZM25,11.35c1.74,0,3.11,1.37,3.11,3.11s-1.37,3.11-3.11,3.11-3.11-1.41-3.11-3.11,1.41-3.11,3.11-3.11h0ZM17.27,19.27c1.08,0,1.98.38,2.73.94-.8,1.13-1.37,2.45-1.74,3.77l-.8,2.45c-.14.38-.05.75.09,1.08h-5.56c-.42,0-.9-.38-.75-.75l.71-2.17c.9-2.78,2.41-5.33,5.33-5.33h0ZM17.27,12.91c1.51,0,2.78,1.27,2.78,2.83s-1.27,2.83-2.78,2.83-2.83-1.27-2.83-2.83,1.27-2.83,2.83-2.83h0ZM32.78,12.91c1.56,0,2.78,1.27,2.78,2.83s-1.23,2.83-2.78,2.83-2.83-1.27-2.83-2.83,1.27-2.83,2.83-2.83h0ZM27.07,28.56v.09c0,.57-.24,1.08-.61,1.46h0v.05c-.38.33-.9.57-1.46.57s-1.08-.24-1.46-.61h0c-.38-.38-.61-.9-.61-1.46v-.09h1.41v.09c0,.19.05.38.19.47v.05c.09.09.28.19.47.19s.38-.09.47-.19v-.05c.14-.09.24-.28.24-.47t-.05-.09h1.41ZM30.99,28.56v.09c0,1.65-.66,3.16-1.74,4.24-1.08,1.08-2.59,1.79-4.24,1.79s-3.16-.71-4.24-1.79l-.05-.05c-1.04-1.08-1.7-2.55-1.7-4.2v-.09h1.41v.09c0,1.27.47,2.4,1.27,3.25h.05c.85.85,1.98,1.37,3.25,1.37s2.4-.52,3.25-1.37c.85-.8,1.37-1.98,1.37-3.25v-.09h1.37ZM34.99,28.56v.09c0,2.78-1.13,5.28-2.92,7.07-1.79,1.79-4.29,2.92-7.07,2.92s-5.23-1.13-7.07-2.92c-1.79-1.79-2.92-4.29-2.92-7.07v-.09h1.41v.09c0,2.4.94,4.53,2.5,6.08,1.56,1.56,3.72,2.5,6.08,2.5s4.52-.94,6.08-2.5c1.56-1.56,2.5-3.68,2.5-6.08v-.09h1.41Z'/%3e%3c/svg%3e)