
14
Journal of Science, Technology and Engineering Mien Tay Construction University (ISSN: 3030-4806) No.12 (03/2025)
Develop a real-time vehicle recognition application
Dung Thi Dang1*, Tung Xuan Bui2, Dang Khac Nguyen1, Dang Duy Le1 and Thanh Vinh Truong1
1Faculty of Information Technology, Can Tho University of Science and Technology
2Tay Do University
*Corresponding author: dtdung@ctuet.edu.vn
■ Received: 07/01/2025 ■ Revised: 17/02/2025 ■ Accepted: 06/03/2025
ABSTRACT
In this study, we utilized the YOLO (You Only Look Once) model to evaluate the performance
of real-time vehicle detection and classification. Additionally, we adjusted the learning rate
parameter to achieve optimal performance. The best results were obtained with YOLOv8,
achieving the highest accuracy of 95.2%, a processing speed of 50 FPS, and a Mean Absolute
Error (MAE) of 2.94
Keywords: YOLO, vehicle, FPS, Mean Absolute Error, optimal performance.
1. INTRODUCTION
Real-time vehicle identification remains
a challenge due to the complexity of the
data and the actual environment. Recently,
convolutional neural network (CNN)
methods have been applied to solve these
problems and have yielded remarkable
results [1], [2]. In this study, we focused on
the use of YOLO - a deep-learning the model
is known for its ability to detect objects in
real-time with high speed and accuracy. This
model has been continuously improved,
and the YOLOv8 version is one of the most
advanced.
This study uses datasets collected from
traffic cameras in Vietnam, including images
and videos of vehicles such as motorcycles,
cars, trucks, and buses. We aim to build a
vehicle recognition application that can
perform efficiently in real time. The rest
of the article is arranged as follows: Part
2 presents relevant research on vehicle
identification. Part 3 describes in detail the
dataset, pre-processing data, and YOLO
model structure. Part 4 presents the results
of the experiment and evaluation. Part 5
summarizes future development directions
and concludes.
2. RELATED RESEARCH
Previous studies have shown that
YOLO (You Only Look Once) is one of the
most effective methods for real-time object
recognition thanks to its fast processing and
high accuracy [3]. Redmon and Farhadi’s
research has proposed YOLOv3, an advanced
version of YOLO that achieves fast processing
speeds with high accuracy in identifying
objects from traffic videos. This model has
proven its ability to recognize objects in
real-life traffic situations with remarkable
performance [3].
Following the success of YOLOv3,
YOLOv5 and YOLOv8 versions have been
developed and improved, bringing significant
improvements in accuracy and processing
speed. Recent studies show that YOLOv5
can achieve processing speeds of up to 50
FPS and accuracy of up to over 95%, which
is especially important in applications that
require real-time object recognition, such as
traffic monitoring and security applications.
This improvement mainly comes from
applying deeper neural network techniques
and optimization of model parameters [4].

15
Journal of Science, Technology and Engineering Mien Tay Construction University (ISSN: 3030-4806) No.12 (03/2025)
A study by Wang et al. applied YOLOv4
to detect vehicles in low-light conditions and
crowded environments. The results show
that YOLOv4 performs more efficiently than
other models such as Faster R-CNN and
SSDs in these complex situations. Research
shows that YOLOv4 can maintain high
accuracy and stable processing speed even in
difficult traffic situations such as at night or
when many vehicles are moving at the same
time [5].
In other studies, YOLO has been widely
applied in areas such as security surveillance,
object recognition in medical videos, and
image analysis from surveillance cameras
[6], [7]. Recent studies continue to expand
the applicability of YOLO, including the
development of new model versions such as
YOLOv7 and YOLOv8 with improvements in
small object recognition, enhanced accuracy
in unstable environments, and reduced latency
in real-time applications [8], [9].
3. RESEARCH METHODOLOGY
This section will introduce the research
method consisting of 3 parts. First, in this
section, we present our research methodology,
which consists of three main sections. In
section 3.1, we present the dataset used in
the study. This dataset includes 30,000 traffic
images and videos, annotated in detail with
information about the types of vehicles and
their location in the frame. Next, in section
3.2, we introduce image preprocessing steps,
especially when the initial data is unbalanced.
Then, carry out the training process with the
YOLOv8 model. Section 3.3, describes the
architecture and settings of each model, and
section 3.4 will provide information about the
study environment, including programming
languages, required libraries, and computer
configurations. Finally, the parameters that
evaluate the model’s performance include
MAE (Mean Absolute Error) to predict the
accuracy of object positions and accuracy to
evaluate the ability to classify different types
of vehicles.
3.1. Datasets:
We used a dataset collected from traffic
cameras in Vietnam, including 30,000 traffic
images and videos, annotated in detail about
vehicles and their location in the frame. This
dataset contains information about vehicle
types such as motorcycles, cars, trucks,
and buses, along with the coordinates of
each vehicle in the frames. Due to memory
limitations, only the first 20,000 images
are used to train and test the model. Table
1 describes the dataset in detail, including
labels that have been annotated according to
the .jpg format structure. These labels contain
information about the type of media and their
location in the image.
Table 1. Dataset statistics used
Class Name Number of Classes
Cars 3266
Bus 211
Bicycle 88
Motorcycles 7335
Truck 849
Background 1639
Total 13388
3.2. Image pre-processing:
As mentioned, the dataset consists of
heterogeneous photos from the traffic library.
Image preprocessing focuses on rebalancing
the data to ensure uniformity between layers
in the dataset. The pre-processing steps:
a. Browse all the image files in the folder
and extract the information from the file name.
b. Use ImageOps.fit to resize the image to
suit the requirements of each model.
c. Create a data frame from the processed
images.
d. Remove unnecessary data, such as
16
Journal of Science, Technology and Engineering Mien Tay Construction University (ISSN: 3030-4806) No.12 (03/2025)
templates with no objects or invalid labels.
e. Balance the data by randomly selecting
a sample portion (20%) from underrepresented
classes and adding it to the training set.
f. Standardize the image data by dividing
by 255 to ensure the pixel values are within
the range [0, 1].
These preprocessing steps help prepare
the data so that the model can learn features
from the images with high performance.
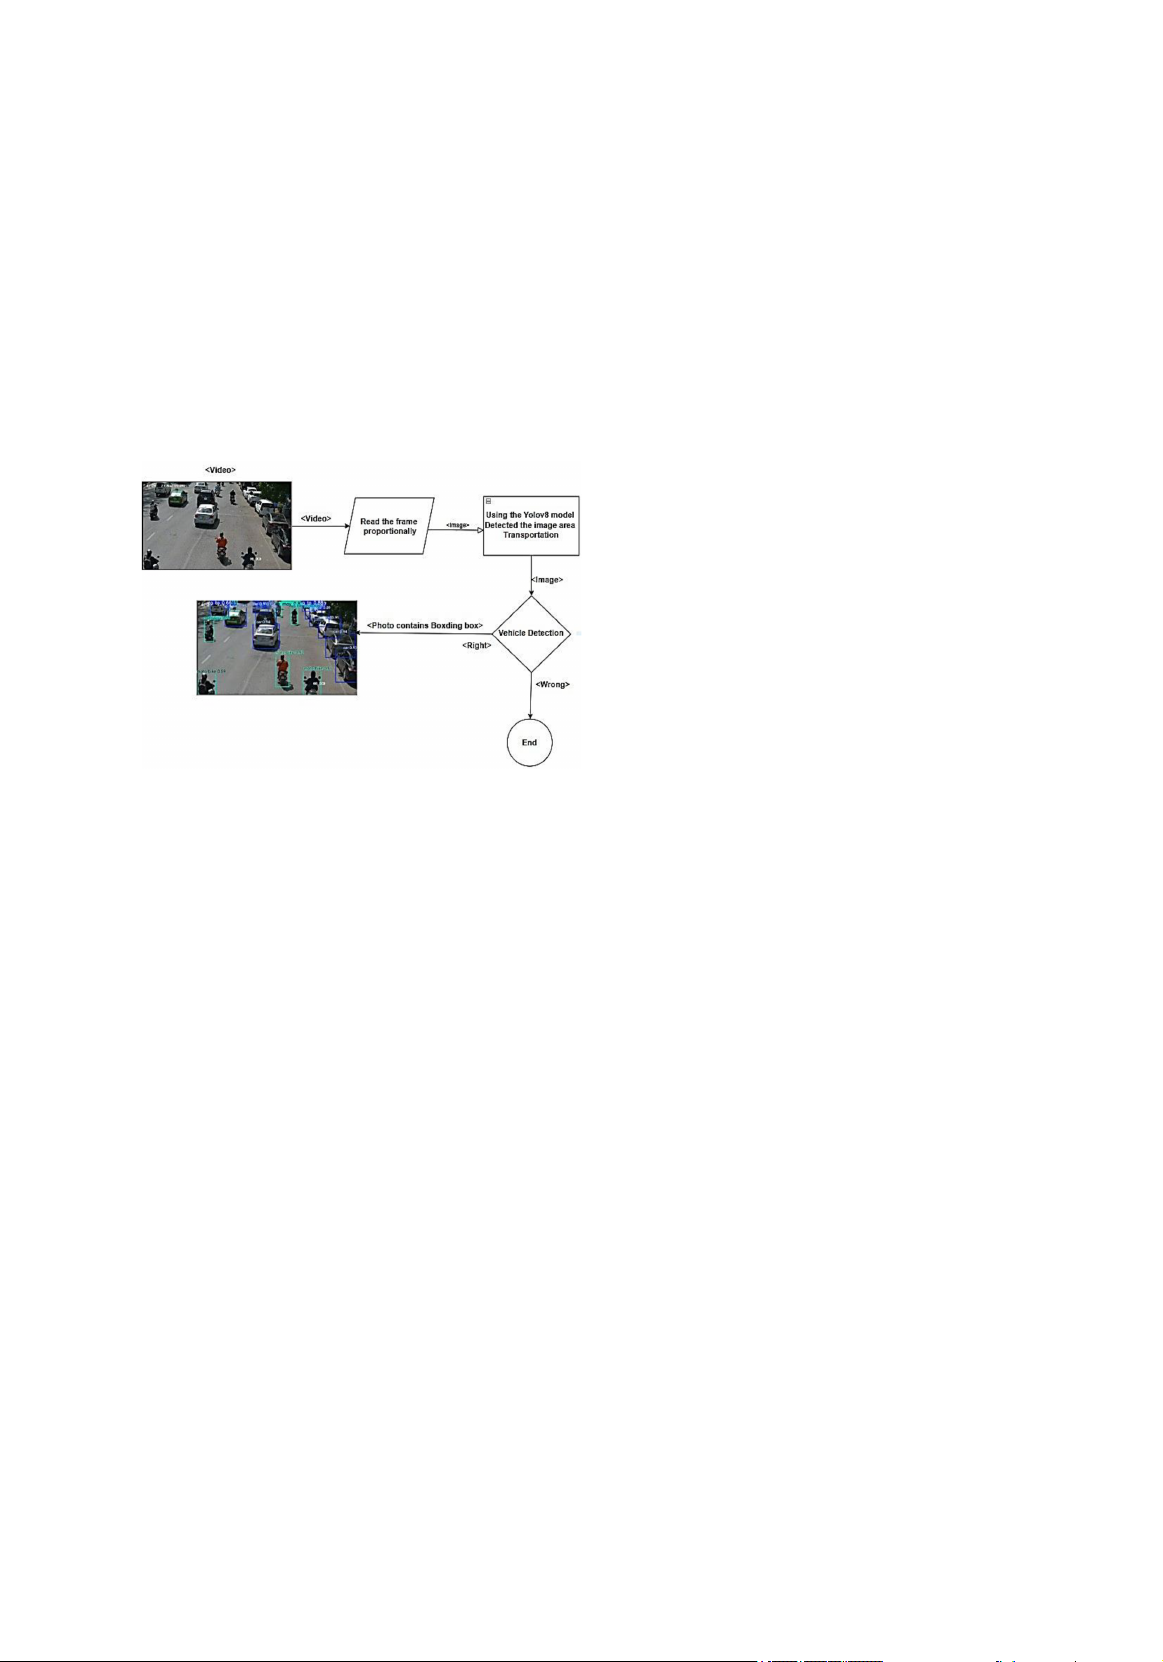
Fig 1. Proposed model
Figure 1 is a block diagram illustrating
the vehicle identification process in the video
using the YOLOv8 (You Only Look Once)
model. First, the system receives an input
that is a video recording of a traffic scene,
usually an image of a street or an area with
vehicles. This video is processed to extract
frames at a certain scale to reduce the
computational load and increase processing
efficiency. Each frame is then fed into the
YOLOv8 model, where the model detects
image areas containing vehicles such as cars
and motorcycles and creates bounding boxes
around the detected objects.
Results from YOLOv8 will be checked
to determine accuracy. If the correct vehicle
is detected, the system accepts and stores the
results in the form of an image containing
Bounding Boxes, labels (e.g., “motorcycles”,
“cars”), and accuracy (Confidence Score).
If the wrong object is detected or there is
no suitable object, the process will end. The
first illustration (top left) shows an original
frame from the video, while the second
(bottom left) shows processed results with
specific Bounding Boxes and labels, such
as “motorcycle 0.59” denoting a motorcycle
detected with 59% accuracy. This process
helps the system automatically identify and
classify vehicles effectively.
3.3. Object classification and detection
In this section, machine learning methods
are applied to create object detection and
classification models. The training process
includes selection and testing with the
YOLOv8 model. Each model is tested with
different parameters to find the classification
model with the highest performance and
accuracy. The YOLOv8 model was chosen
because of its ability to detect objects with fast
speed and high accuracy in complex traffic
environments [10], [11].
3.4. Environment Settings
To train the models, use Google Colab Pro,
with a Tesla K80 GPU environment and about
12 GB of RAM. Essential libraries include
TensorFlow with Keras, Scikit-learn, Pandas,
NumPy, PIL (Python Imaging Library), and
other segmentation models. The dataset is
divided into two parts: one for coaching and
the other for testing. In the test dataset, 20%
of the data from each media group is selected
to test the model.
Two parameters are used to evaluate the
model’s performance: MAE (Mean Absolute
Error) and accuracy. MAE is used to measure
the predictive quality of the location of objects,
while accuracy is used to assess the ability to
accurately classify vehicles. MAE measures
the mean absolute value of the difference
between the predicted value and the actual
value, with a lower MAE value meaning the
more accurate the model is [11], [12].
4. EXPERIMENTAL RESULTS
This section presents the results of the
experimental scenarios of the study. We have
set up the models with default parameters,
including an input image size of 224 ×
17
Journal of Science, Technology and Engineering Mien Tay Construction University (ISSN: 3030-4806) No.12 (03/2025)
224, batch size = 64, epoch = 100, and a
learning rate change (Learning Rate) to
test the model’s performance variation. The
learning rate values tested were 0.001, 0.005,
and 0.01.
4.1. Performance of the YOLOv8 model
To optimize the training process, we have
combined the YOLOv8 model with ResNet34,
which is used as an encoder extractor that
exports features for the input images. This
combination reduces the complexity of the
training process because the model does not
have to learn basic features from scratch,
while reducing the total number of parameters
that need to be trained. We tested different
Learning Rates, including 0.001, 0.005, and
0.01, to choose the most suitable rate for this
environment.
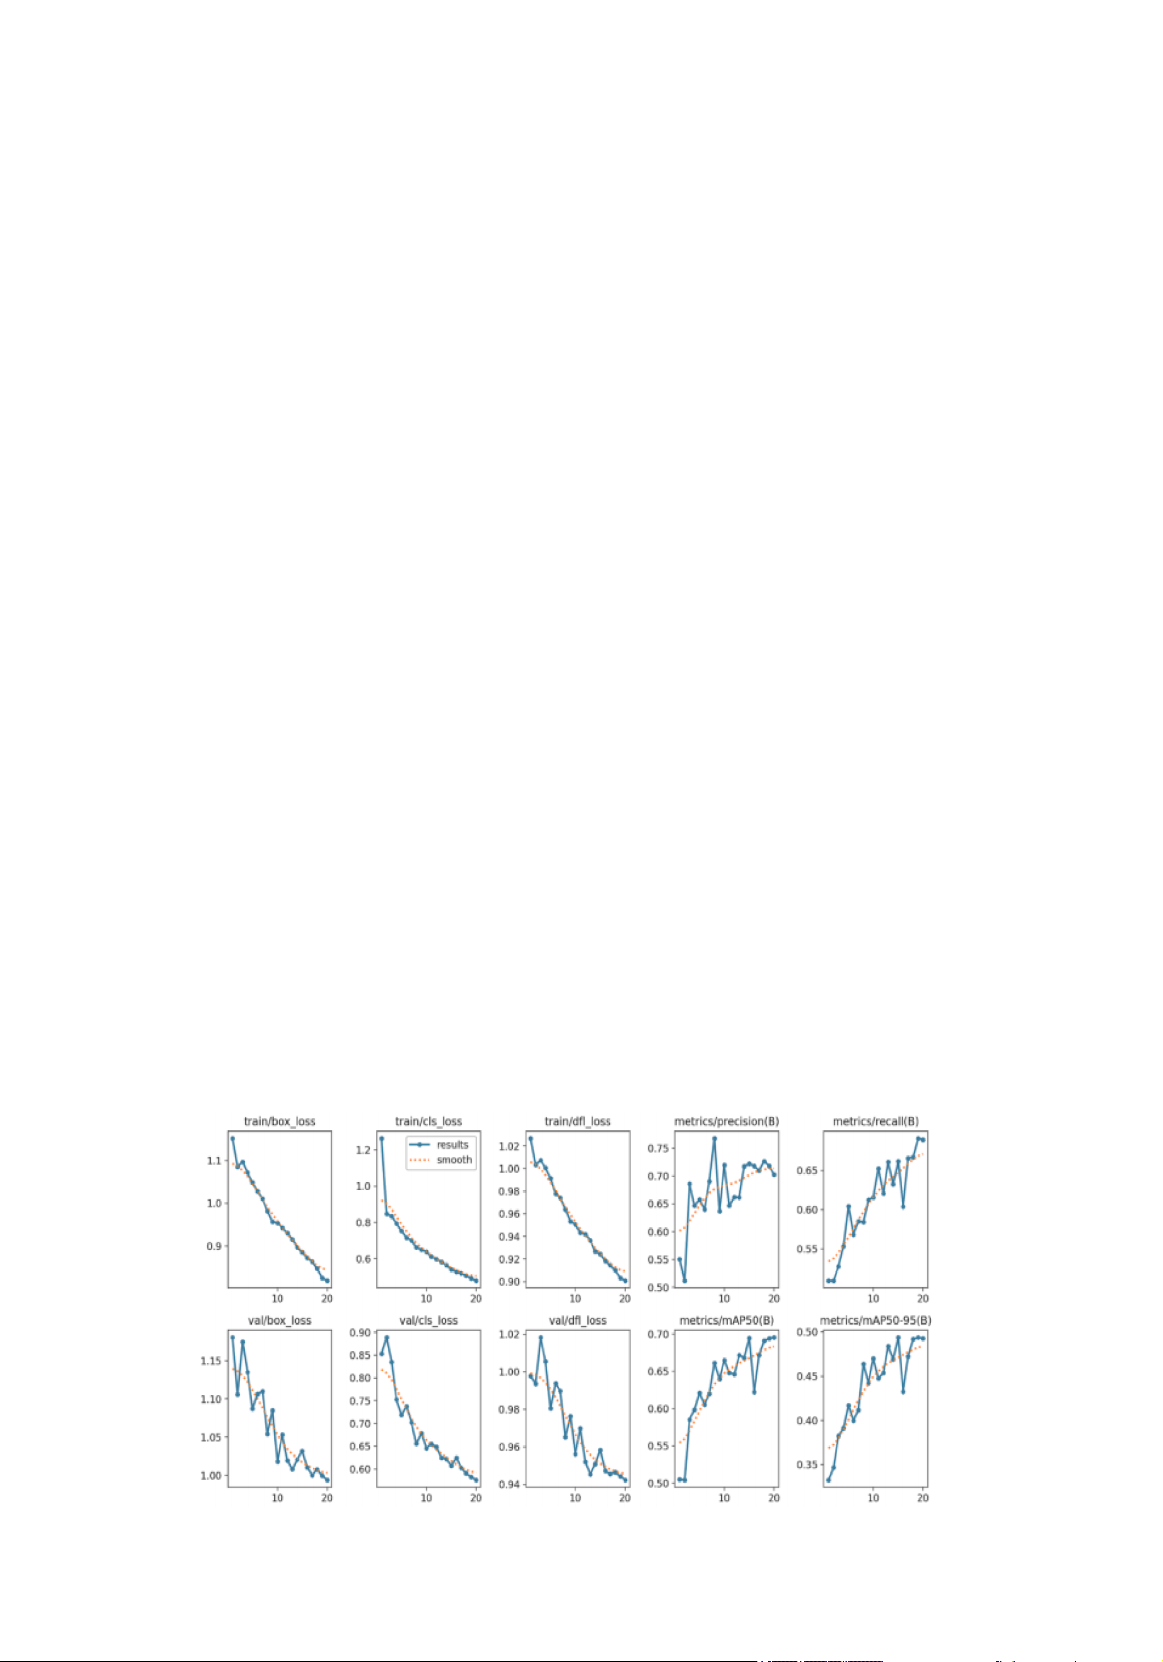
a. Results of the training process
Loss: The graph in Figure 1 shows
the decline of the types of loss functions,
including box_loss, cls_loss, and dfl_losscho
both training and validation. All of them
decreased evenly in epochs, but the level of
reduction on validation fluctuated somewhat
more than in training. This has shown that the
models are specifically trained but still need
to be optimized to improve the stability of the
determination on the dataset.
Evaluation Performance Index:
+ Accuracy: The accuracy increases
through the epochs in Figure 2, demonstrating
an improvement in the recognition of sub-
object items.
+ Recall: Recall also increases steadily,
reaching higher values in the last epochs,
proving that the model recognizes more and
more objects.
+ mAP50 to mAP50-95: At this time,
the mAP50 increases from 0.7 to mAP50-95
reaching a progress of 0.5 at the end of the
training process.
b. Effect of learning rate
When using different learning speeds:
+ Learning speed 0.001: The model
achieves the best performance with low MAE
error (2.87) and high accuracy (96.5%), which
can show good optimization on the validation
paper.
+ 0.005 learning rate: Although the MAE
error increases (3.24) and decreases the
accuracy rate (94.2%), this speed still ensures
faster learning.
+ Learning speed 0.01: The highest MAE
error (4.12) shifts to the lowest accuracy speed
(92.1%), indicating that the learning speed is
too high, creating a model that is difficult to
converge at the optimal point.
Fig 2. Coaching and evaluation process
18
Journal of Science, Technology and Engineering Mien Tay Construction University (ISSN: 3030-4806) No.12 (03/2025)
Table 2. Performance of YOLOv8 model
when changing the learning rate
Learning speed MAE Accuracy (%)
0.001 2.87 96.5%
0.005 3.24 94.2%
0.01 4.12 92.1%
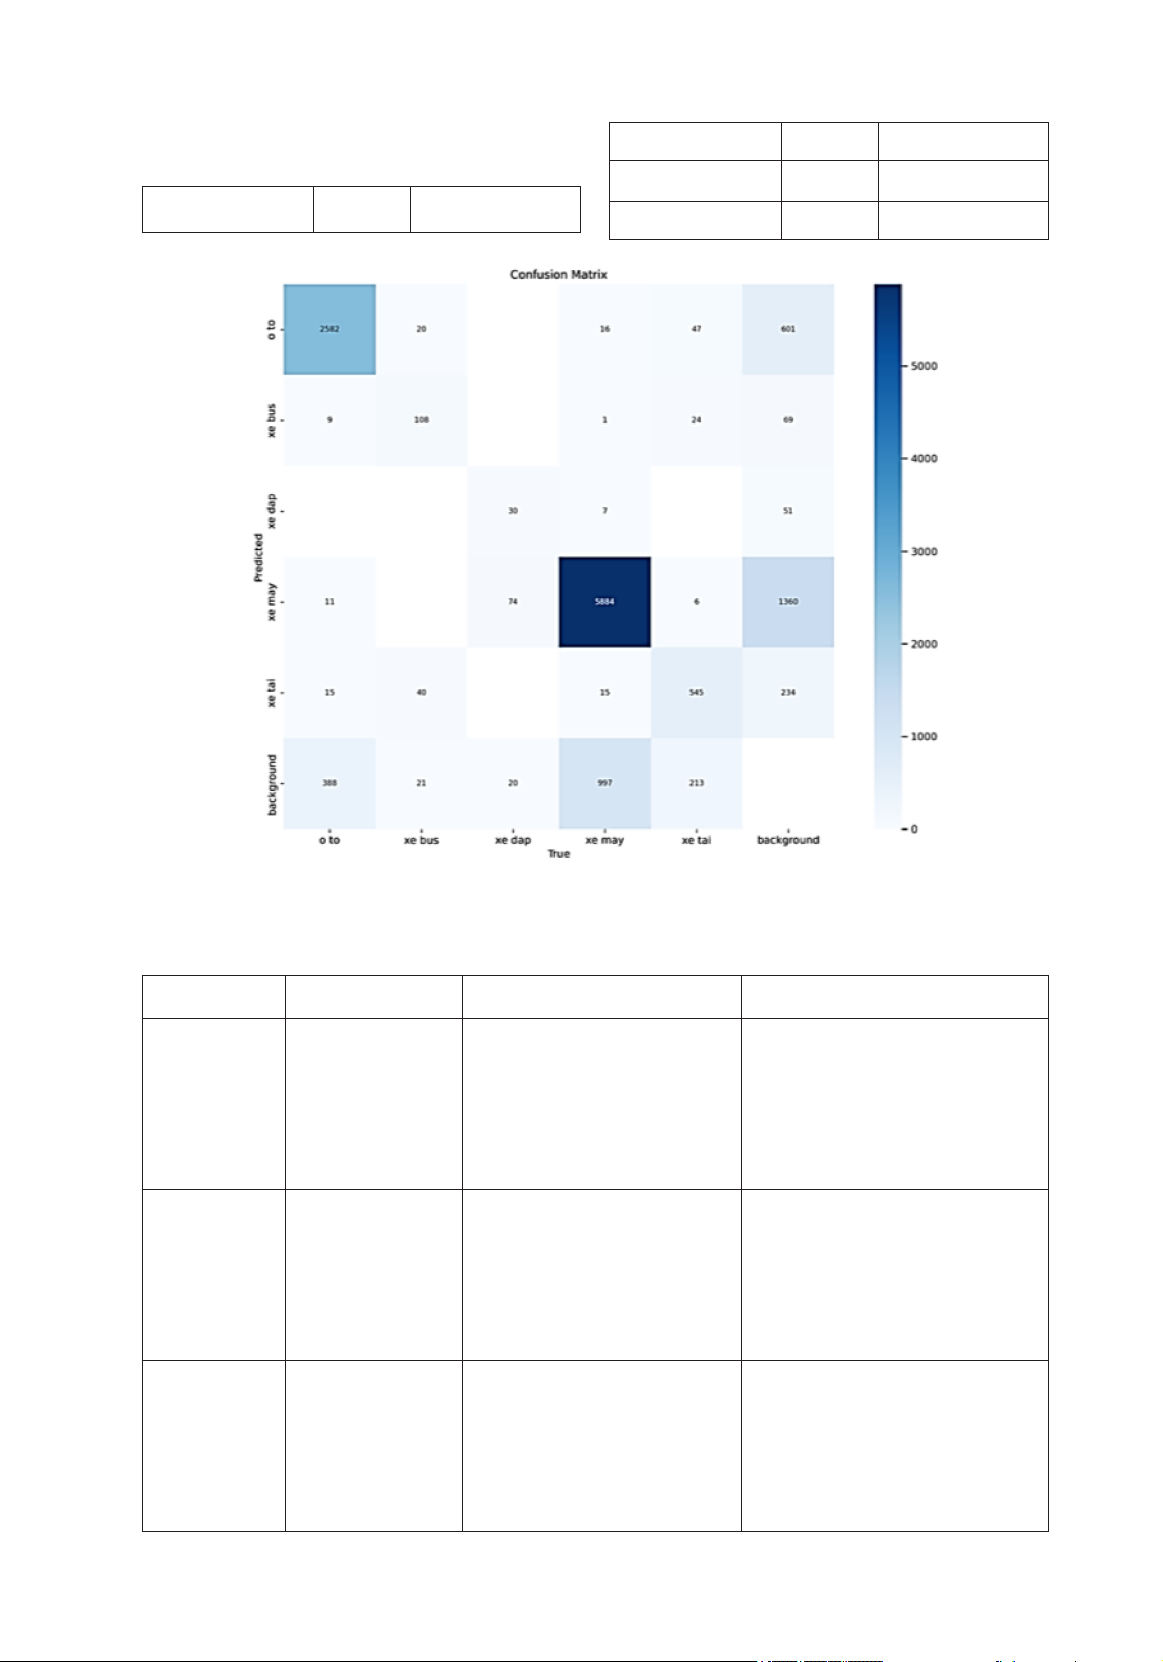
Fig 3. Prediction results using the YOLOv8 model
Table 3 Prediction Dashboard
Label Type True Positives False Positives False Negatives
Cars 2,582 Bus: 20
Bicycles: 16
Motorcycles: 47
Trucks: 15
Background: 388
Bus:
Bicycles: 30
Motorcycles:11
Truck: 15
Background: 601
Bus 108 Cars: 9
Bicycles: 7
Motorcycles: 74
Trucks: 40
Background: 21
Cars: 20
Bicycles: 24
Motorcycles: 6
Trucks: 15
Background: 69
Bicycle 51 Cars: 16
Bus: 7
Motorcycles: 30
Trucks: 6
Background: 20
Cars: 24
Bus: 7
Motorcycles: 74
Trucks: 6
Background: 213


![Tính năng các lệnh trong NXSOFT [Mới Nhất]](https://cdn.tailieu.vn/images/document/thumbnail/2017/20170704/nestxanh/135x160/9031499160202.jpg)


![Bài Tập Cơ Lưu Chất: Ôn Thi & Giải Nhanh [Mới Nhất]](https://cdn.tailieu.vn/images/document/thumbnail/2025/20250812/oursky04/135x160/76691768845471.jpg)


![Bài tập thủy lực: Giải pháp kênh mương và ống dẫn [chuẩn nhất]](https://cdn.tailieu.vn/images/document/thumbnail/2025/20250812/oursky04/135x160/25391768845475.jpg)

