
Vietnam Journal of Biotechnology 21(4): 611-619, 2023
611
RESVERATROL INHIBITS CYTOKINE PRODUCTION IN LPS-
STIMULATED RAW264.7 CELLS POTENTIALLY THROUGH
TLR4/MYD88/NF-κB PATHWAY
To Minh Nhat1, Tran Thu Trang2,3, Nguyen Trung Nam2,3,*
1University of Science and Technology of Hanoi, Vietnam Academy of Science and
Technology, 18 Hoang Quoc Viet Road, Cau Giay District, Hanoi, Vietnam
2Graduate University of Science and Technology, Vietnam Academy of Science and
Technology, 18 Hoang Quoc Viet Road, Cau Giay District, Hanoi, Vietnam
3Institute of Biotechnology, Vietnam Academy of Science and Technology, 18 Hoang Quoc
Viet Road, Cau Giay District, Hanoi, Vietnam
*To whom correspondence should be addressed. E-mail: nam@ibt.ac.vn
Received: 25.10.2023
Accepted: 28.11.2023
SUMMARY
Resveratrol is a naturally occurring compound with anti-inflammatory properties.
However, the protective molecular mechanisms of resveratrol against LPS-induced
inflammation have not been thoroughly known. In the present study, we examined the anti-
inflammatory effect of resveratrol in inflammatory model using murine macrophage-like
cell RAW264.7 stimulated with LPS. Resveratrol suppressed the production of
inflammatory cytokines in LPS-stimulated RAW264.7 cells with the IC50 value as 17.5 ±
0.7 μM for IL-6, 14.2 ± 1.9 μM for IL-10, and 18.9 ± 0.6 μM for TNF-α. Gene expression
of TLR4, MyD88 and NF-κB were significantly suppressed by resveratrol treatment in LPS-
stimulated RAW264.7 cells. In conclusion, the anti-inflammatory property of resveratrol is
potentially related to its inhibitory effect on TLR4/MyD88/NF-κB signaling pathway in
macrophages.
Keywords: Macrophages, inflammatory cytokines, lipopolysaccharide, resveratrol
INTRODUCTION
Inflammation is the spontaneous defense
response of human body tissue to any kind of
injury and also a response to stimuli
including bacteria and viruses that can
promote the release of inflammatory
cytokines from macrophages or dendritic
cells. The primary indicators of
inflammation are redness, heat swelling, and
pain. During inflammation, white blood cells
release substances into the blood or tissues to
protect the affected tissue/organ injured or
infected. This required increased blood flow
to the areas of injury or infection, resulting in
redness and warmth. Swelling occurs by the
leakage of fluid into the affected tissue,
which is caused by some of these compounds
from white blood cells. This protective
swelling process may trigger nerves to cause

To Minh Nhat et al.
612
pain. While acute inflammation is an initial
response of the body to harmful stimuli,
chronic inflammatory response endangers
the body tissue involved. The uncontrolled
inflammatory response is involved in various
immune diseases (Ahmed, 2011).
Lipopolysaccharides (LPS) in the outer
wall of Gram-negative bacteria can cause an
inflammatory response by activating the
production of inflammatory cytokines in
different cell types including macrophages
(Takashiba et al., 1999; Liang et al., 2013).
LPS has been used to examine inflammation
because of the affluence of the inflammatory
effect, which is generated through Toll-like
receptors 4 (TLR4) signaling pathways.
TLR4 is a cellular receptor for bacterial LPS,
which is by far the most extensively studied
member of the TLR family. After being
activated by LPS, TLR4 signaling has been
divided into MyD88-dependent and MyD88-
independent pathways. Its downstream
signaling molecules, including nuclear factor
kappa B (NF-κB), p38 mitogen activated
protein kinase (MAPK), c-Jun N-terminal
kinase (JNK) and activator of transcription
(STAT), leading to the production of
inflammatory cytokines (Lu et al., 2008).
Resveratrol (Res) is a polyphenolic
compound found naturally in many common
food sources. This substance has been
proposed to have a variety of therapeutic
properties, including antioxidant,
cardioprotective, antiviral, anti-aging, and
anti-inflammatory effects (Holthoff et al.,
2010).Many studies have indicated that Res
can inhibit molecules related to the TLR4
signaling pathway, decrease pro-
inflammatory cytokines and prevent
inflammatory responses (Lundahl et al.,
2022; Ma et al., 2017; Tong et al., 2019;
Youn et al., 2005). NF-κB activation is
strongly associated with inflammatory
responses and other chronic diseases
(Hayden & Ghosh, 2004). Despite numerous
reports indicating that Res can inhibit NF-κB
activation and target gene expression
induced by various proinflammatory stimuli
(Xu et al., 2018), the direct molecular targets
and the mechanisms for such inhibition are
unknown.
Thus, in this study, we aimed to identify
the molecular targets of Res in downstream
signaling pathways activated by LPS-TLR4.
MATERIALS AND METHODS
Materials
Res was purchased from Sigma (CA,
USA). RAW264.7 cell line was provided by
Dr. T. Kishimoto, Osaka University, Japan.
These cells were cultured in RPMI 1640
medium (10% FBS) with 100 µg/mL
penicillin, 100 µg/mL streptomycin. Cells
were plated into a 90 mm×20 mm petri dish.
The culture medium is changed after 1-2
days. Proceed with cell passaging when the
cell density reaches 80% confluence. The
RAW264.7 cells were grown in a 24-well
plate, containing 5×10⁵ cells/mL The cells
were seeded in 24-well culture plates
(Corning, USA), after adhesion, the cells
were pre-stimulated with 2 µg/mL LPS
(Sigma) for 1 h and then, treated with Res (1,
5, 10, 20 μM). The cells were harvested for
qRT-PCR after 6 h and supernatants were
harvested for ELISA after 24 h as described
previously (Masuda et al., 2011).
Cell viability assay
For cell viability assays, the cells (5×10⁵
cells/well) were seeded in 96-well plates
(Corning, USA), treated with 1, 5, 10, 20 μM
Res for 24 h, control well contain only cells

Vietnam Journal of Biotechnology 21(4): 611-619, 2023
613
and blank contain medium. Cell viability was
assessed by MTT assay. The plate was then
placed in an OD reader to record the
absorbance of samples at 540 nm. The results
were expressed as fold changes relative to
the control. Three replicates were performed
for each treatment. Cell viability was
calculated as described previously (da Luz et
al., 2022).
% Cell viability =
!OD!"#$!#%&'$()*# −OD+*$,-
OD./,!"/* −OD+*$,- %X'100'(%)
Enzyme-linked immunosorbent assay
The cell culture media were collected and
the levels of IL-6, IL-10, and TNF-α were
measured using ELISA kits (Mabtech,
Sweden) following the manufacturer's
protocol. The absorbance was read at 450 nm
using an OD reader, the cytokine levels were
calculated from standard curves. Three
replicates were performed for each
treatment. The IC50 value was determined
using ImageJ 1.50i computer software (NIH,
Maryland).
Real-Time Quantitative RT-PCR
Total RNA was isolated from RAW264.7
cells using easy-spin™ Total RNA
Extraction Kit (iNtRON, Korea) according
to the manufacturer’s instructions. A total of
1 μg of RNA was reverse transcribed into
cDNA using the RevertAid First Strand
cDNA Synthesis Kit (ThermoFisher
Scientific, USA) according to the
manufacturer’s instructions. Relative gene
expression was measured using PowerUp
SYBR Green Master Mix (ThermoFisher
Scientific, USA). The primers used for Real-
Time qRT-PCR were synthesized by Phusa
Genomics Co., Ltd. (Vietnam). The primer
sequences are referenced from the previous
article (Hsieh et al., 2017) listed in table 1.
Real-Time qRT-PCR reactions and analyses
were performed using the QuantStudio™ 6
Pro Real-Time PCR System with Design &
Analysis Software v2.6.0. The relative
expression levels of the genes were
calculated based on the 2-∆Ct method (Livak
& Schmittgen, 2001). β-actin gene was used
as an endogenous control to normalize gene
expression levels as described previously
(Masuda et al., 2011).
Statistical analysis
The data were expressed as the mean ±
standard deviation (SD). The ImageJ
software was used to analyze the IC50 value.
Each experiment was performed at least
three times, statistical analysis was
performed using two-tailed Student’s t test.
Otherwise, representative data were shown,
and p < 0.05 was considered significant.
Table 1. Primer sequences used in RT-qPCR.
Genes
Forward primers
Reverse primers
TLR4
5’- ATGGCATGGCTTACACCACC - 3’
5’- GAGGCCAATTTTGTCTCCACA - 3’
MyD88
5’- TCATGTTCTCCATACCCTTGGT- 3’
5’- AAACTGCGAGTGGGGTCAG - 3’
NF-κB
5’- ATGGCAGACGATGATCCCTAC - 3’
5’- TGTTGACAGTGGTATTTCTGGTG - 3’
β-actin
5’- TCATGAAGTGTGACGTGGACATC -
3’
5’- CAGGAGGAGCAATGATCTTGATCT - 3’
To Minh Nhat et al.
614
RESULTS AND DISCUSSION
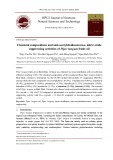
Effect of Res on RAW264.7 cell viability
The MTT assay was performed to
determine the effect of Res on the cell
viability of the RAW264.7 cells. Figure 1
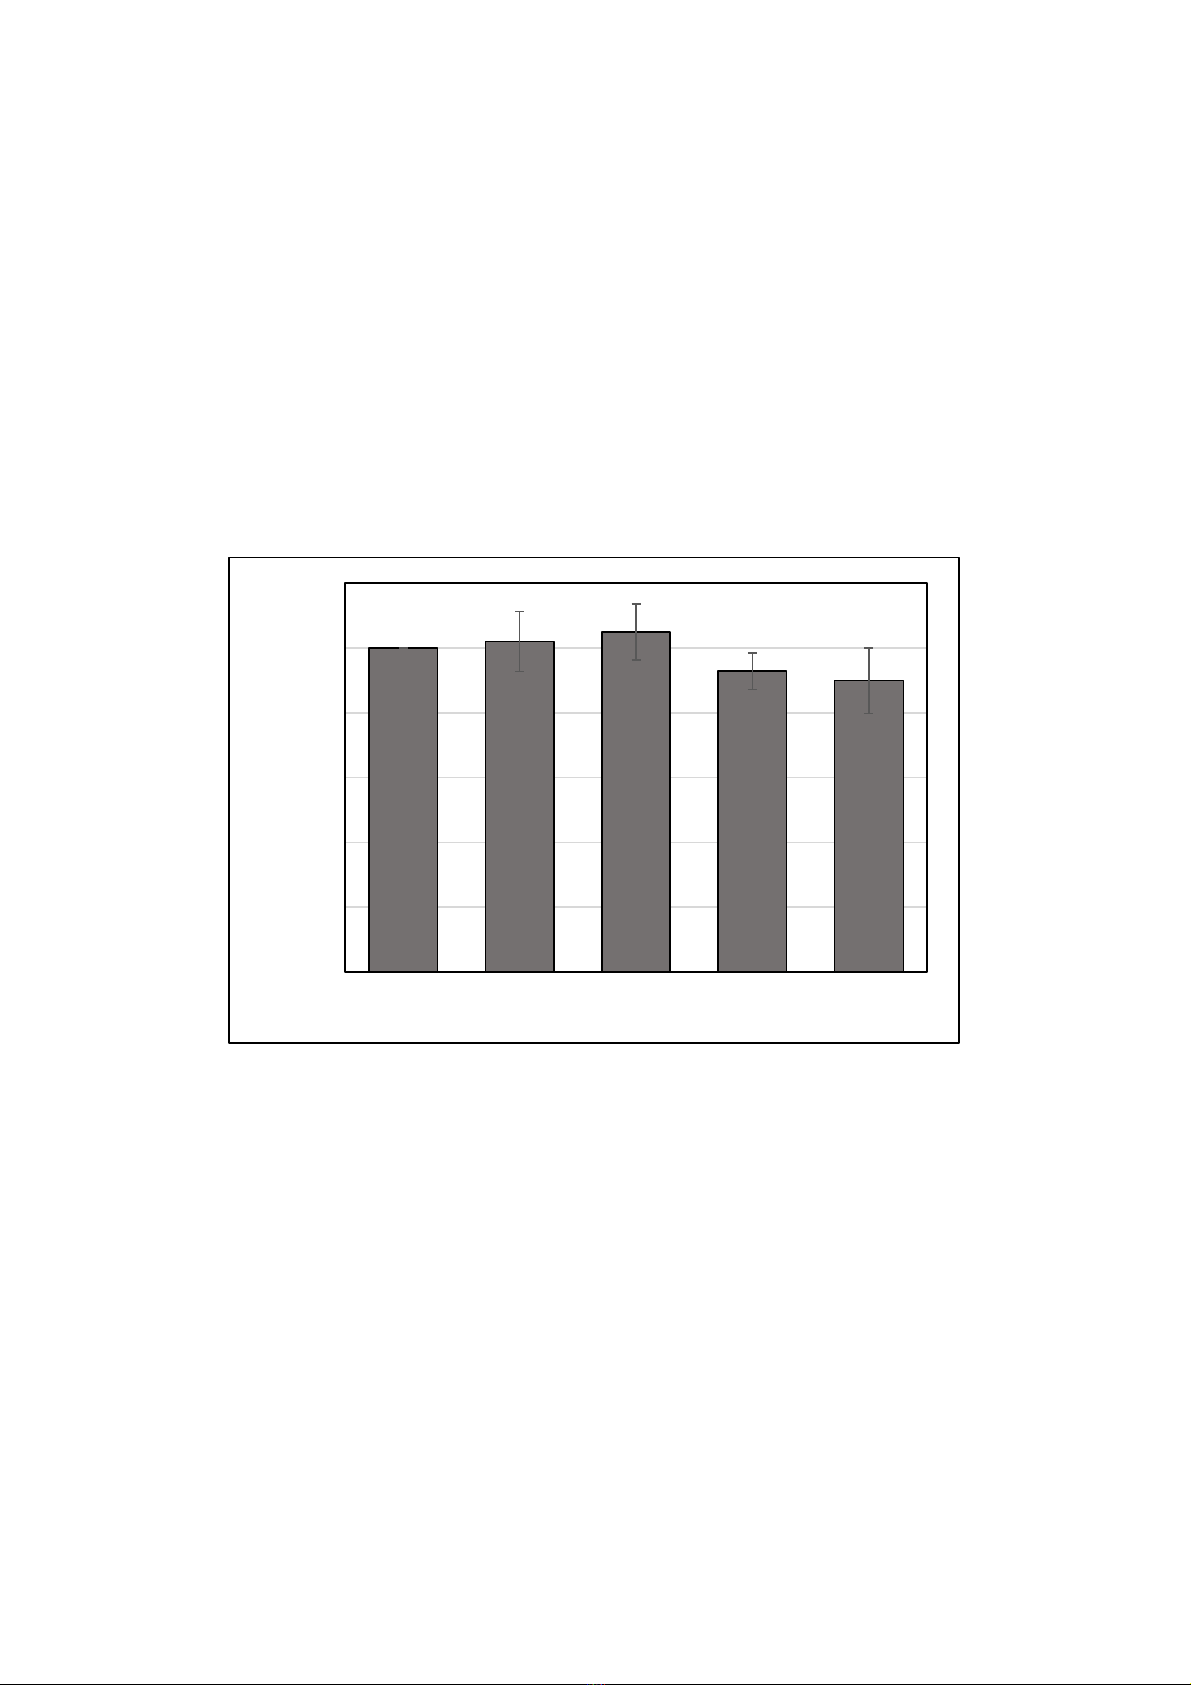
showed that RAW264.7 cell viability was
not affected by Res at the concentrations 1,
5, 10, and 20 μM as 100, 102 ± 9, 105 ± 9,
93 ± 6, 90 ± 10 (%), respectively. Res
exhibited no effect on RAW264.7 cells and
was used for next experiments. Our results
are in agreement with the previous findings
which showed that Res cells with the
concentration from 1 to 20 μM was not
harmful to RAW264.7 cells (Ma et al., 2017)
while the other results showed that 20 μM of
Res can caused toxicity on RAW264.7 cells
(Son et al., 2014).
Figure 1. Effect of Res treatment on the viability of RAW264.7 cells. Cells were treated with different
concentrations of Res. The cell viability was determined by MTT assay. The results are the means ±
SD of 3 replicated experiments.
Res inhibited the release of cytokines in
LPS-stimulated RAW264.7 cells
The cells were pre-stimulated with
LPS (2 µg/mL) for 1 h and then with Res
(1, 5, 10, 20 μM). Protein levels of three
cytokines IL-6, IL-10, and TNF-𝛼 was
detected by ELISA after 24 h. The results
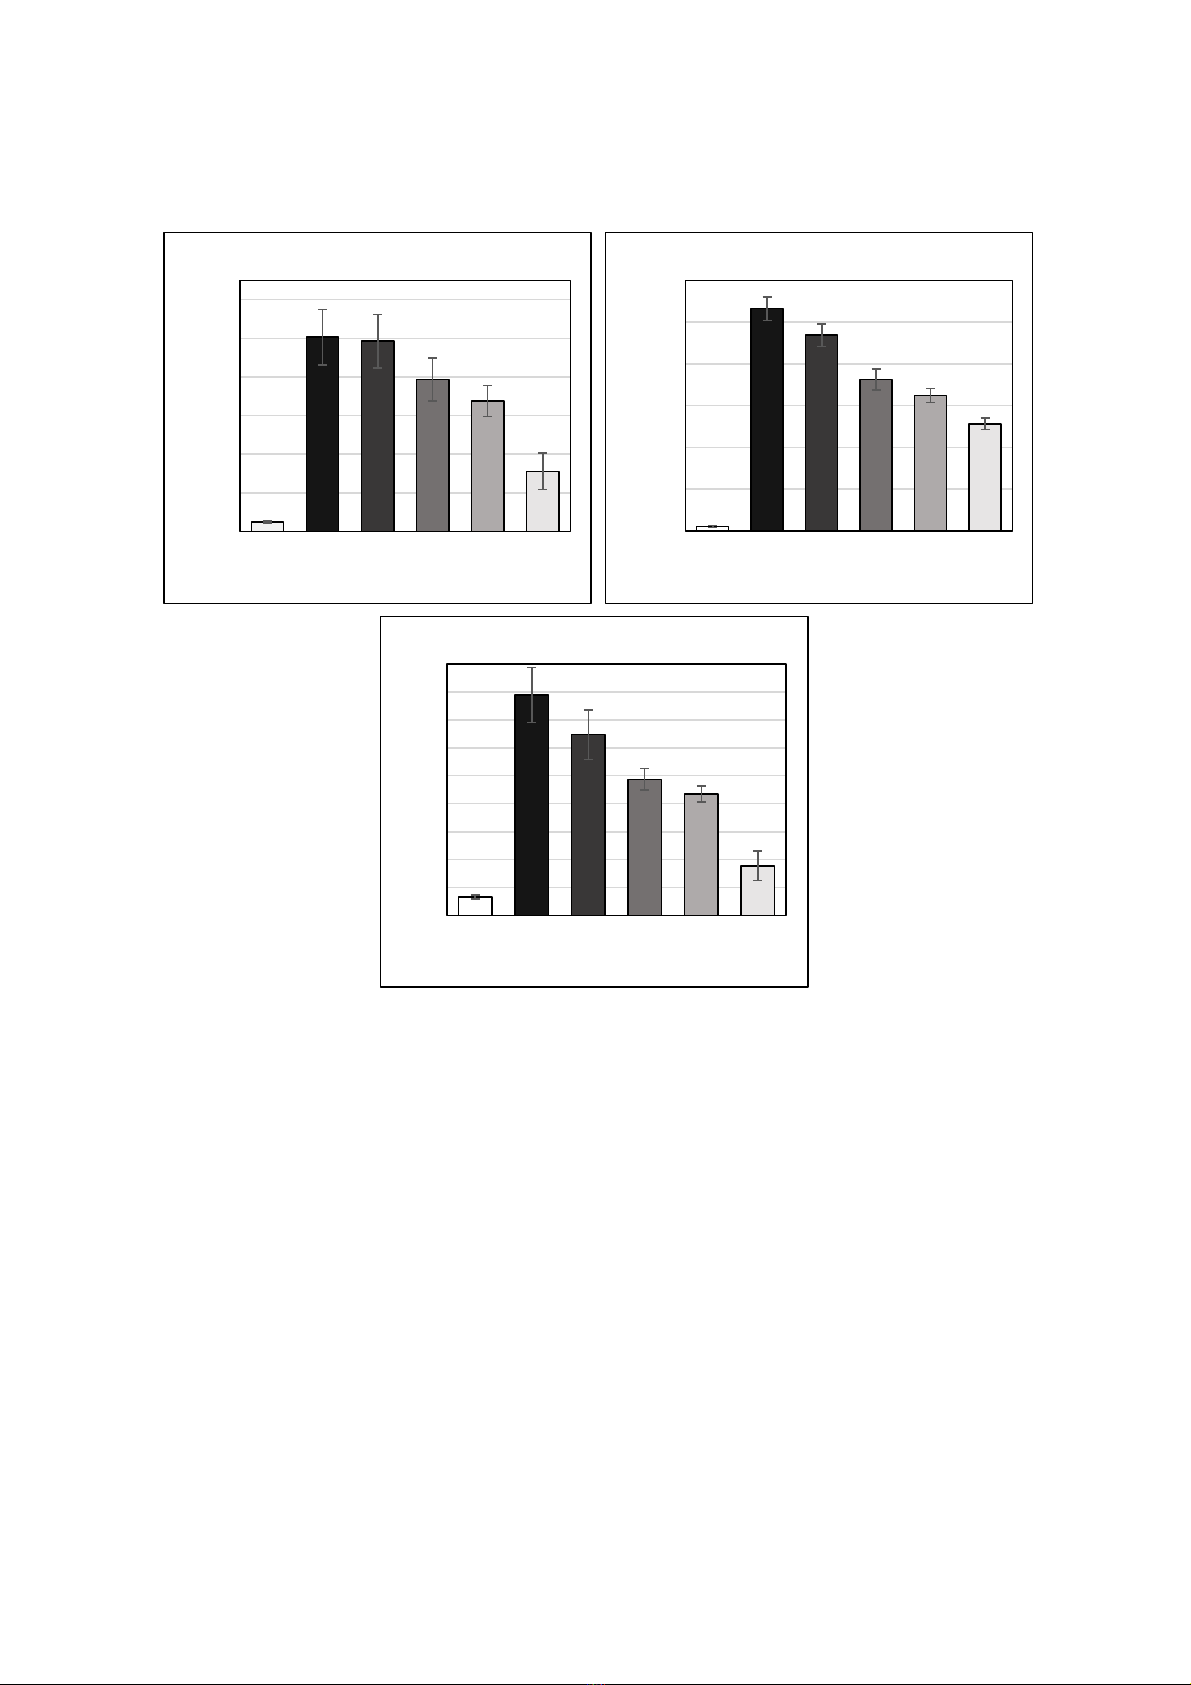
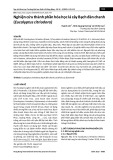
in figure 2 indicated that Res suppressed
the production of IL-6 and TNF-α with the
IC50 value are 17.5 ± 0.7 μM and 18.9 ±
0.6 μM in LPS-stimulated RAW264.7
cells, respectively. Our results are in
agreement with the previous findings
showed that Res can reduce IL-6 and TNF-
α production in agreement with the
adjustment of IL-6 and TNF-α production
affected by Res can be observed in the
results of earlier studies (Ma et al., 2017;
Tong et al., 2019).
0
20
40
60
80
100
120
01510 20
Cell viability (%)
Res (μM)
Vietnam Journal of Biotechnology 21(4): 611-619, 2023
615
Figure 2. Res decreased IL-6, TNF-α, and IL-10 production in LPS-stimulated RAW264.7 cells. The
cells were treated with various concentrations of Res in the presence of 2 µg/ml LPS for 24 h before
the ELISA assays. The results are the means ± SD of 3 replicated experiments. *p < 0.05 vs only
LPS stimulated sample.
The results from figure 2 also showed
that Res reduced the production of IL-10
with the IC50 value is 14.2 ± 1.9 μM.
However, this result is different from the
previous study. Compared to the previous
research, the cells were cultured in DMEM
medium, with the cell density of 5 x 10⁵
cells/mL after being pre-treated with 25 μM
Res and 12 h stimulated with LPS, the
concentration of IL-10 was increased (Tong
et al., 2019). This difference may be due to
the inflammation model, density of cells, the
medium of the cell culture, the
origin/concentration of LPS, or the order of
adding stimuli and compounds. For example,
during this study, we stimulated the
RAW264.7 cells with LPS for 30 min and
then added Res with different
concentrations. In contrast, according to
other protocol of the previous study, the cells
were pre-treated with Res for 2 h prior to the
addition of LPS (Tong et al., 2019).
(
(
*
0
200
400
600
800
1000
1200
- + + + + +
- - 1 5 10 20
LPS 2 µg/mL
Res (μM)
IL-6
(pg/ml)
(
(
(
*
*
*
0
1000
2000
3000
4000
5000
6000
- +++++
- - 1 5 10 20
LPS 2 µg/mL
Res (μM)
TNF-α
(pg/ml)
(
(
(
*
*
*
0
20
40
60
80
100
120
140
160
180
- +++++
- - 1 5 10 20
LPS 2 µg/mL
Res (μM)
IL-10
(pg/ml)

![Bài tập Hóa lý dược [mới nhất]](https://cdn.tailieu.vn/images/document/thumbnail/2025/20250717/0609anhle@gmail.com/135x160/87091752738236.jpg)


![Tài liệu học tập Chuyên đề tế bào [mới nhất]](https://cdn.tailieu.vn/images/document/thumbnail/2025/20250906/huutuan0/135x160/56151757299182.jpg)