Vietnam Journal
of Agricultural
Sciences
ISSN 2588-1299
VJAS 2024; 7(3): 2185-2194
https://doi.org/10.31817/vjas.2024.7.3.01
https://vjas.vnua.edu.vn/
2185
Received: December 19, 2023
Accepted: August 26, 2024
Correspondence to
lttcham@vnua.edu.vn
ORCID
Le Thi Tuyet Cham
https://orcid.org/0000-0002-6215-
7332
Growth Characterization of Sugarcane
(Saccharum spp.) under Salinity and
Drought Stresses at the Seedling Stage
Le Thi Tuyet Cham*, Vu Khanh Linh & Vu Thi Thuy Hang
Faculty of Agronomy, Vietnam National University of Agriculture, Hanoi 12400, Vietnam
Abstract
This study aimed to assess the combined effects of salinity and drought
stresses on the growth and physiology of sugarcane. The pot
experiment was carried out in the Autumn cropping season of 2021
under the polyhouse conditions at the Vietnam National University of
Agriculture. The experiment consisted of four treatments: non-stress
treatment (control), drought stress, salt stress, and salt and drought
stress (combined stress). Five weeks after transplanting, salt stress was
applied first for four weeks and followed by drought stress for another
two weeks. The results showed that under the impact of stresses,
sugarcane growth was inhibited with decreases in plant height, number
of leaves, Fv/Fm, SPAD, and the fresh and dry weights of roots and
stems. The growth and physiology indicators were the lowest under the
combined effects of salinity and drought stress.
Keywords
Combined stress, drought, salinity, sugarcane growth
Introduction
Sugarcane (Saccharum spp.), a perennial grass of the family
Poaceae, is a major sugar-producing crop in tropical and subtropical
regions. In Vietnam, sugarcane is mostly grown in the provinces of
Northern Central Vietnam, such as Thanh Hoa and Nghe An, the
Central Highlands, and the Mekong Delta. According to the Vietnam
Sugar Association, Vietnam harvested 141,906ha of sugarcane with
an average cane production rate of 69.3 tons ha-1 in the 2022/23
season (Thuy Loan, 2023). Currently, sugarcane is considered an
important industrial crop that is actively contributing to transforming
the agricultural landscape, increasing economic efficiency, and
improving the ecological environment.
Due to its long growth cycle from germination to ripening,
sugarcane faces many adverse environmental conditions that affect
its growth and yield. Drought and salinity stresses are caused by
climate change and affect the morphological and physiological behaviors

Growth characterization of sugarcane (Saccharum spp.) under salinity and drought stresses at the seedling stage
2186
Vietnam Journal of Agricultural Sciences
of sugarcane (Kaushal, 2019; Garcia et al.,
2020). Drought negatively changes a range of
growth parameters such as increasing tillering,
leaf discoloration, rolling of leaves, leaf folding
and shredding, and reducing leaf area
(Shrivastava & Srivastava, 2006; Karinki &
Sahoo, 2019). Many physiological traits, such as
the leaf chlorophyll content, photosynthetic rate,
and stomatal conductance, among others, are
markers for the selection of genotypes tolerant to
drought stress (Silva et al., 2012; Basnayake et
al., 2015). In terms of root traits, the depth and
volume of roots are also considered as important
criteria for selecting drought-tolerant genotypes
(Smith et al., 2005).
Salinity stress is also a major abiotic stress
that influences sprout emergence, nutritional
balance, and growth, leading to reductions in
biomass production and sugar yield. The cane
height, leaf area, and biomass are the traits most
affected. Salinity coupled with subsequent
drought are severe problems for the coastal area
of Vietnam. The early growth stages of
sugarcane, namely germination, tillering, and
cane formation, are more sensitive than the later
stages. Vasantha et al. (2017) reported that leaf
area index, SPAD, and chlorophyll fluorescence
efficiency are affected the most in the formative
and grand growth stages under salinity stress (EC
= 8 dS m-1).
Previous studies have been conducted to
assess the effects of drought or salinity stresses
on sugarcane growth and the losses or
improvements in cane growth under such
conditions. Dinh et al. (2023) reported on the
individual and combined effects of individual
stresses (saline or drought) on the growth and
physiological parameters of sugarcane. Jaiphong
et al. (2016) showed that flooding had more
negative effects on plant growth but was
followed by drought stress. However, none of the
studies have presented a comparative evaluation
of cane grown under both consecutive drought
and salinity conditions. Thus, this study aimed to
assess the morphological changes that occur in
sugarcane under both salinity and subsequent
drought conditions.
Materials and Methods
Materials
Twenty-five-day-old sugarcane seedlings
were used in this experiment. The sugarcane
seedlings were propagated from ten-month-old
healthy stalks of the commercial ROC10
cultivar.
Experimental design
The experiment was carried out in a
greenhouse facility at the Vietnam National
University of Agriculture, Hanoi, Vietnam.
Single sets were germinated on soil trays for 25
days, and then each seedling was grown in
individual pots containing 10kg of soil mixture
(3 alluvium soil: 1 sand, v/v). In the salinity stress
treatment, each pot was watered with 25mL of
salinized nutrient solution containing sodium
chloride (100mM) starting on the fifth week and
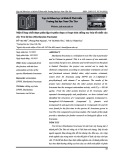
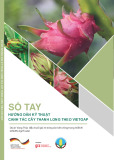
continuing for four weeks. The combined stress
treatment consisted of salinity stress starting on
the fifth week and continuing for four weeks,
followed by drought stress for two weeks
(Figure 1). The drought stress treatment was
initiated in the ninth week and lasted for two
weeks. After the stress treatments, the pots were
regularly watered during the recovery period.
Pots were arranged in a factorial in a randomized
complete block design with three replications. To
assess the physiological traits, the chlorophyll
fluorescence efficiency (Fv/Fm) and SPAD were
recorded weekly at 10:00 a.m. on the first full
leaf from the top by an Opti-Science
Chlorophyll Fluorometer OS-30p (Hudson,
USA) and a SPAD 502 Plus Meter (Minolta,
Japan), respectively. The actively growing roots
and leaf samples were sampled on the 8th, 10th,
and 14th weeks for biomass estimation.
Sugarcane growth was scored based on the
measurements of plant height and the number of
leaves every week.
Data analysis
Data recorded for sugarcane growth were
analyzed with analysis of variance (ANOVA)
using IRRISTAT 5.0. Different means were
Le Thi Tuyet Cham et al. (2024)
https://vjas.vnua.edu.vn/
2187
Figure 1.
Timeline of stress treatment on sugarcane
compared using Duncan’s Multiple Range Test
at P 0.05.
Results
Effects of salinity stress and drought stress
on the growth dynamics of sugarcane
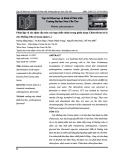
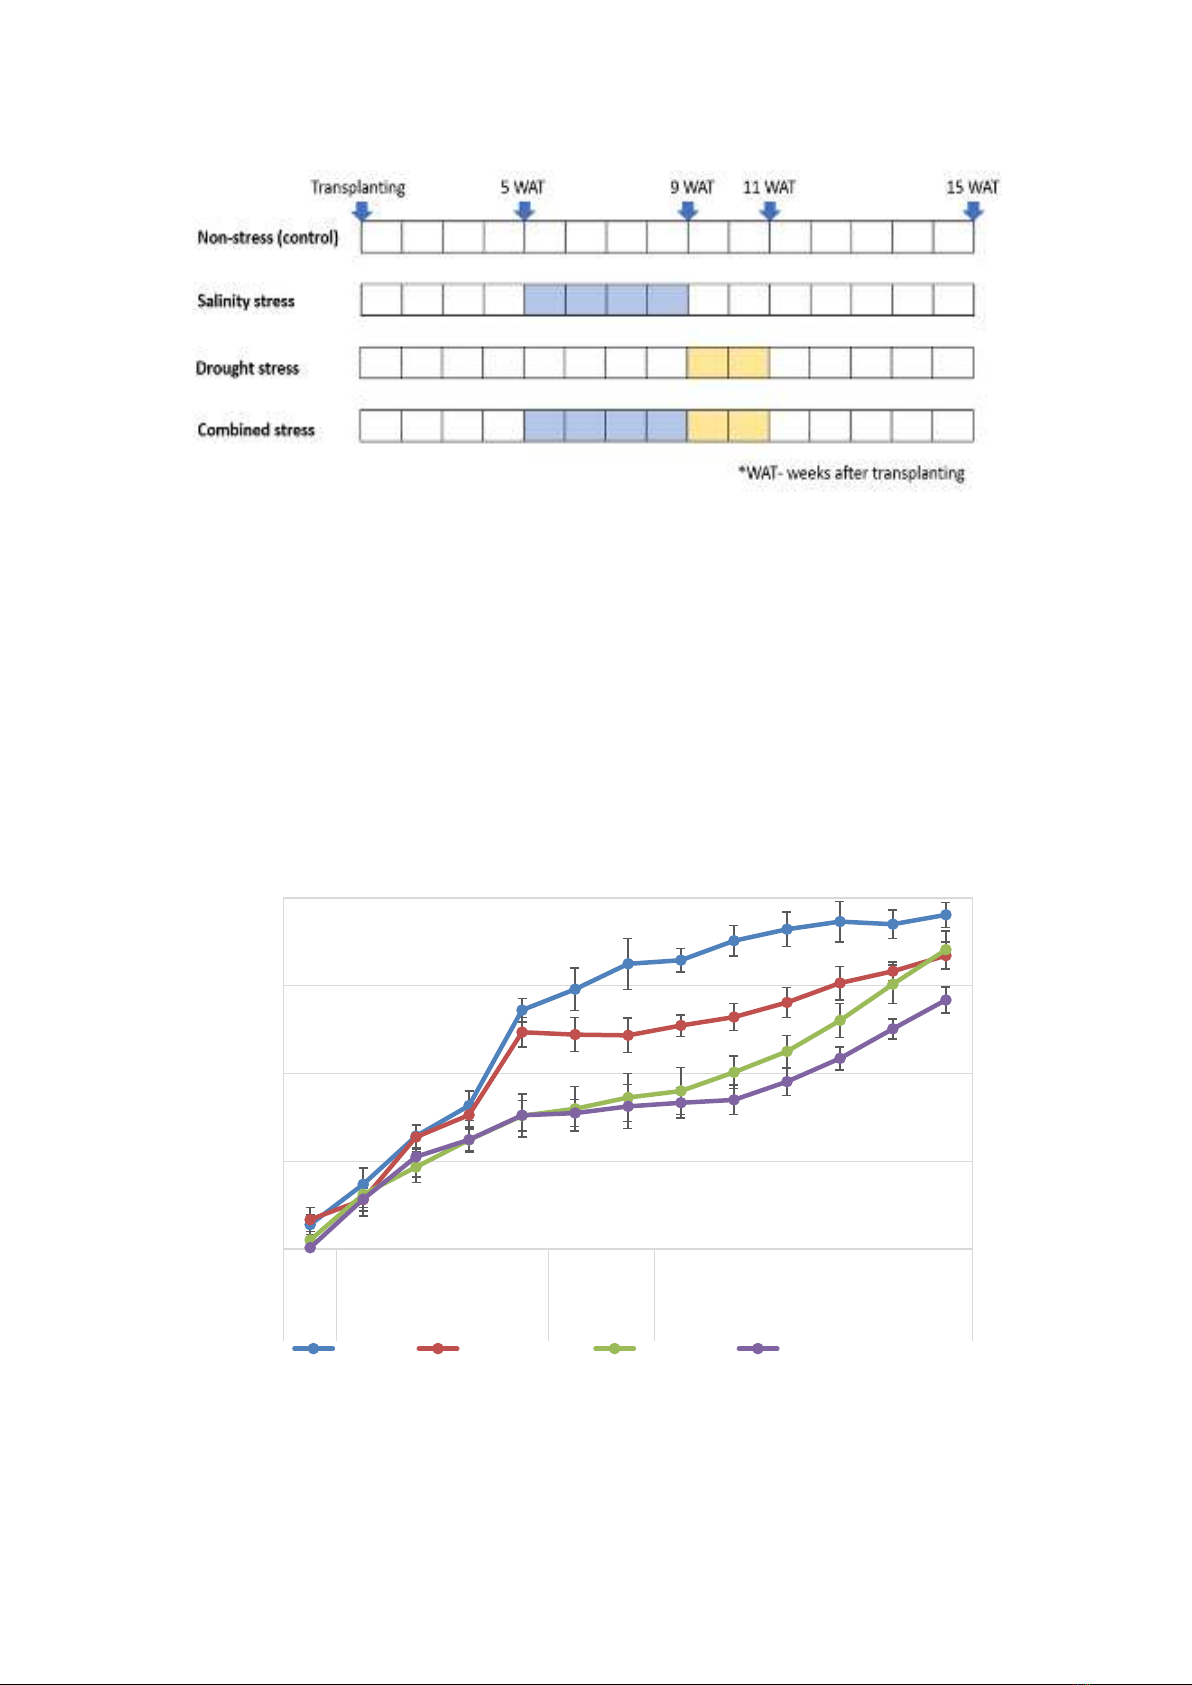
During the salt stress period, a great
reduction was observed in the growth rates of the
salinity stress and combined stress conditions
compared to the control (Figure 2). In the
treatments treated with drought stress, plant
height ceased to increase. During the rewatering
stage, the plant height of all the stress conditions
increased at different rates. The plant height in
the combined stress condition recovered the least
(14% lower compared to the control condition).
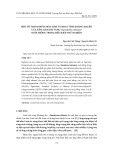
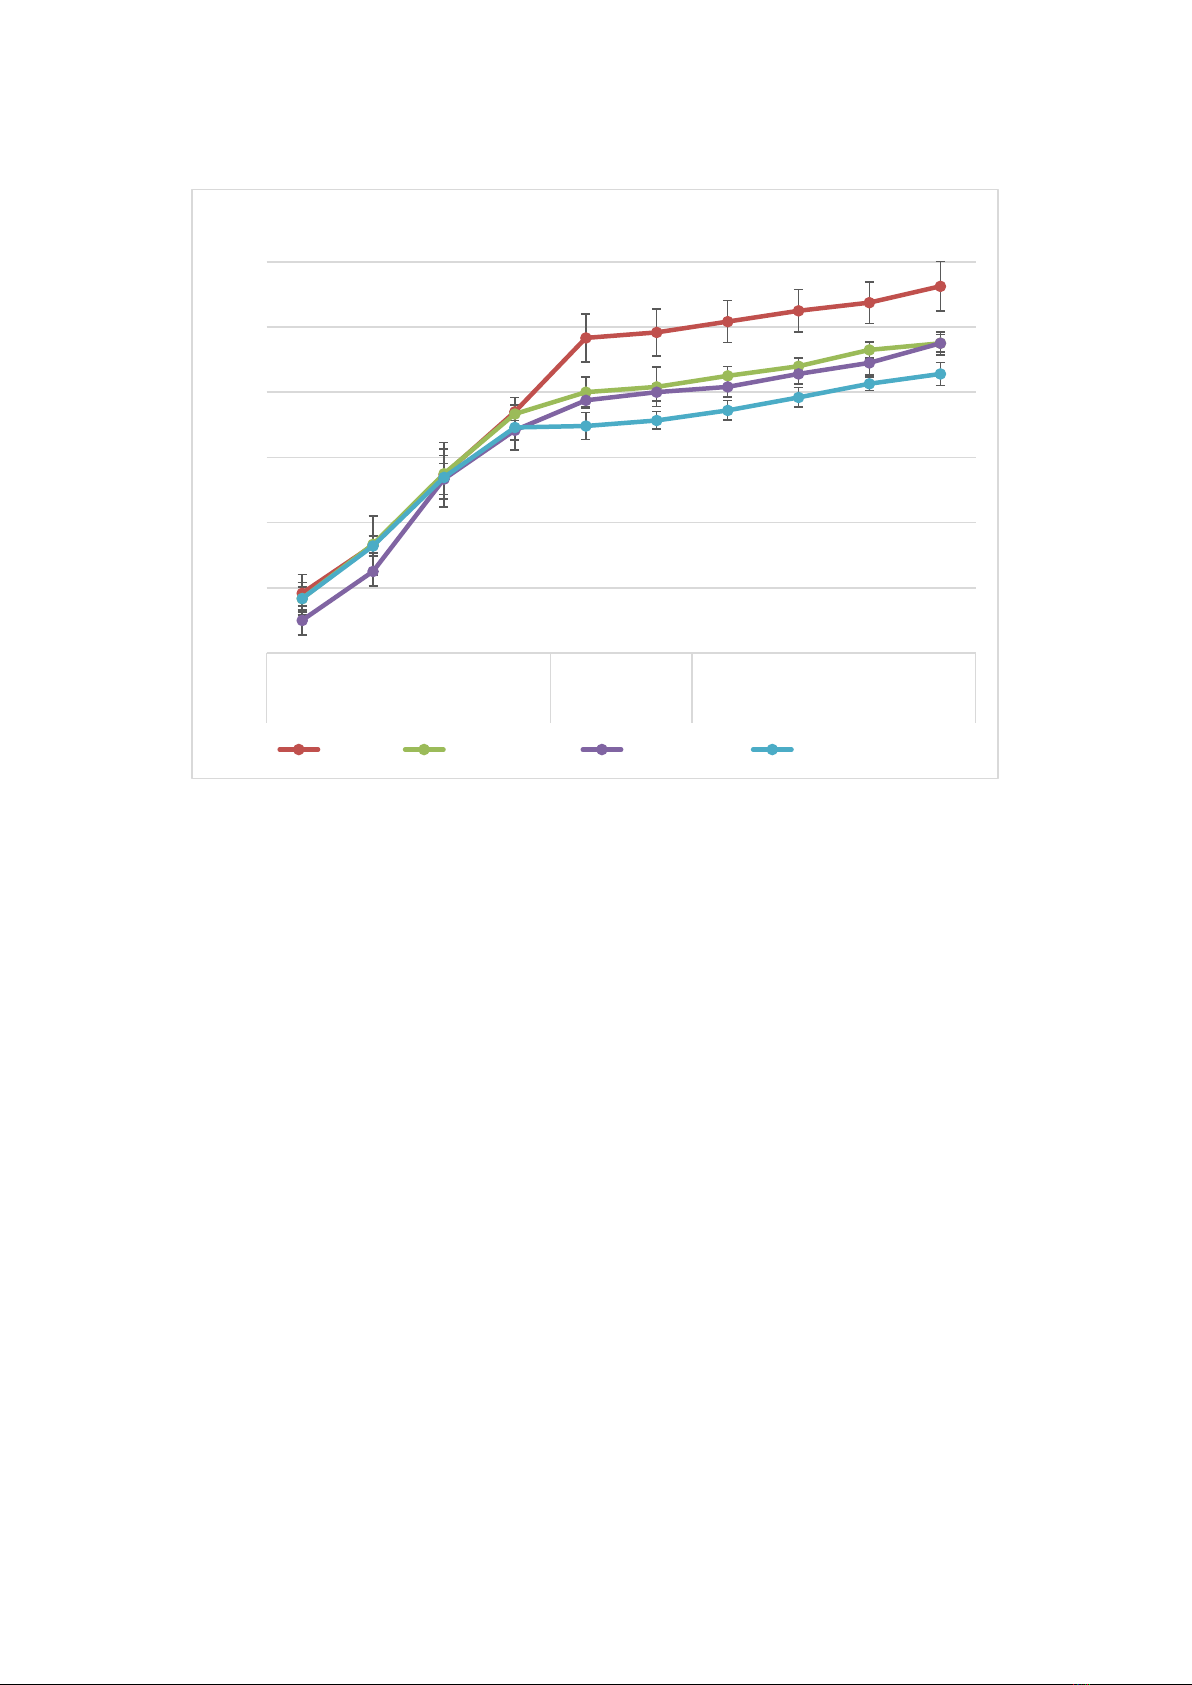
After the salinity stress period, there were no
significant differences in the number of leaves
among all the treatments. The number of leaves
in all the treatments increased steadily to 7.46
Note: W- weeks after transplanting; *, **, ***: The means are significantly different between the control and other treatments; drought
stress and salt stress; and salt stress and combined stress at P ≤0.05, respectively.
60
80
100
120
140
W4 W5 W6 W7 W8 W9 W10 W11 W12 W13 W14 W15 W16
Salinity stress Drought
stress
Rewatering
Plant height (cm)
Control Drought stress Salt stress Combined stress
W1 W2 W3 W4 W5 W6 W7 W8 W9 W10 W11 W12 W13 W14
W15
*
**
**
**
**
**
***
***
***
**
**
*
*
*
*
*
*
*
Growth characterization of sugarcane (Saccharum spp.) under salinity and drought stresses at the seedling stage
2188
Vietnam Journal of Agricultural Sciences
Figure 2.
Growth dynamics of plant height of sugarcane under salinity and drought conditions
Note: W- weeks after transplanting; *, **: The means are significantly different between the control and other treatments, and the salt
stress and combined stress at P ≤ 0.05, respectively.
Figure 3.
Growth dynamics of the number of leaves of sugarcane under salinity and drought conditions
leaves/plant in the salinity stress treatments, and
around 7.70 leaves/plant for the non-salinity
stress treatments (Figure 3). During the drought
stress period, the changes in the number of leaves
in the four treatments had significant differences.
At the end of drought stress, the highest number
of leaves was found in the control condition (9.08
leaves/plant) and the lowest in the combined
treatment (7.72 leaves/plant). After rewatering,
the largest number of leaves was still in the
control with 9.63 leaves/plant, whereas the
combined stress treatment had the fewest number
of leaves with only 8.28 leaves/plant.
Effects of salinity stress and drought stress
on the physiological traits of sugarcane
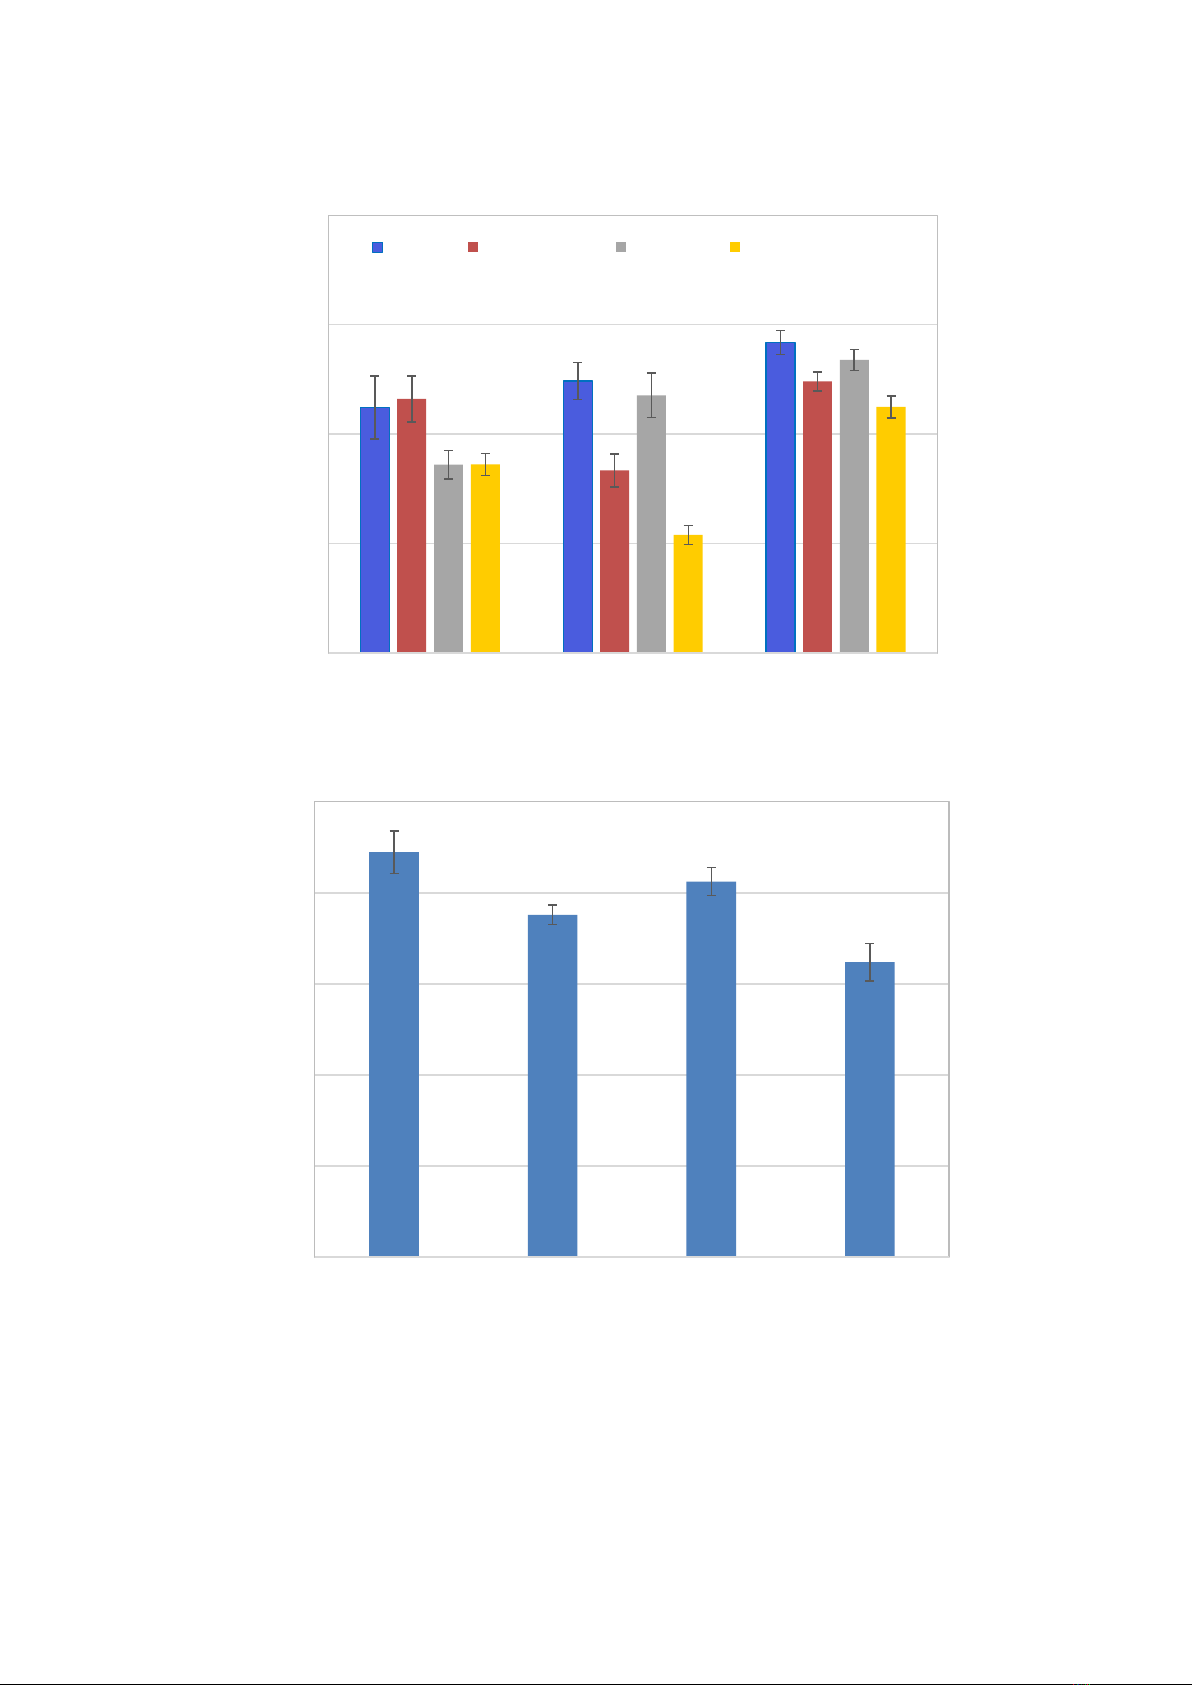
Chlorophyll fluorescence efficiency
(Fv/Fm) is a parameter that reflects the
physiological state of the photosynthetic
apparatus under adverse conditions. After the
salinity period, the control condition had the
highest Fv/Fm value, while the salinity and
combined stress treatments had the lowest values
(Figure 4A). After the drought stress period, the
low Fv/Fm of the combined stress continued,
whereas it recovered in the saline stress
treatment. In the drought stress treatment, the
Fv/Fm reduced to 0.66, significantly lower than
in the control and saline stress treatments, but
noticeably higher than the Fv/Fm in the
combined treatment. At the recovery stage, the
Fv/Fm values of all the stress treatments
recovered. Although the Fv/Fm of the stress
treatments were still lower than the control, a
significant difference was found only in the
combined stress treatment. For SPAD
chlorophyll indexes, after the stress period (10
weeks after transplanting), significant reductions
were found in the stress treatments in comparison
to the control, especially in the combined stress
treatment (Figure 4B).
4.00
5.00
6.00
7.00
8.00
9.00
10.00
W5 W6 W7 W8 W9 W10 W11 W12 W13 W14
Salinity stress Drought stress Rewatering
Number of leaves
Control Drought stress Salinity stress Combined stress
*
**
**
**
**
**
*****
**
*
Le Thi Tuyet Cham et al. (2024)
https://vjas.vnua.edu.vn/
2189
Note: The means followed by different letters are significantly different at P ≤0.05
Figure 4.
Effects of salinity and drought stresses on chlorophyll fluorescence efficiency (A) and SPAD (B) of sugarcane plants
0.5
0.6
0.7
0.8
0.9
After salinity stress After drought stress Rewatering
Chlorophyll fluoresence efficiency
Collecting time
Control Drought stress Salt stress Combined stress
a
a
cc
aa
c
d
aa
a
b
A
0
10
20
30
40
50
Control Drought stress Salt stress Combined stress
SPAD at 10 weeks after transplanting
Stress treatments
c
a
b
ab
B