http://www.iaeme.com/IJM/index.asp 119 editor@iaeme.com
International Journal of Management (IJM)
Volume 9, Issue 3, May–June 2018, pp. 119–128, Article ID: IJM_09_03_013
Available online at
http://www.iaeme.com/ijm/issues.asp?JType=IJM&VType=9&IType=3
Journal Impact Factor (2016): 8.1920 (Calculated by GISI) www.jifactor.com
ISSN Print: 0976-6502 and ISSN Online: 0976-6510
© IAEME Publication
CRITICAL ANALYSIS OF SUSTAINABILITY
DATA REPORTING OF SELECTED INDIAN
COMPANIES
Parag Kalkar
Director, Sinhgad Institute of Management, Savitribai Phule Pune University, Pune
Anand Chitanand
Research Scholar, Sinhgad Institute of Management, Savitribai Phule Pune University, Pune
ABSTRACT
Importance of Sustainability reporting has been underlined by governments,
several non-profit and for-profit organizations. There is several research papers
already published on Sustainability Reporting trends. Limited research available on
the quality of the reports. Overall the trend is encouraging however; a lot has to be
done in terms of the quality of the information disclosed in these reports.
This research paper studies Sustainability Reports of top 100 (BSE Top 100)
companies. A critical analysis is done on the data reporting practices and the gaps
therein. Since one of the major reasons for the disclosure being the investor
education, the information disclosed should be comprehended easily for making the
decisions. Several gaps are seen in the way the data is presented in the Sustainability
Reports by the companies. It gives a feeling that companies are more interested in the
compliance rather than being proactive leaders of Sustainable development. Equal
responsibility lies on the agencies that help in preparing the Sustainability Reports for
the companies.
Keyword: Sustainability, Sustainability Reports, Sustainability Reporting,
Sustainability data
Cite this Article: Parag Kalkar and Anand Chitanand, Critical Analysis of
Sustainability Data Reporting of Selected Indian Companies, International Journal of
Management, 9 (3), 2018, pp. 119–128.
http://www.iaeme.com/IJM/issues.asp?JType=IJM&VType=9&IType=3
1. INTRODUCTION
Environmental laws are becoming more and more complex. At the same time there is a focus
on the disclosure by the organizations the key business parameters that reflect the impact to
the society, environment in addition to the economy. Business organization irrespective of
size or type of its business activity causes some impact on the global sustainability.

Critical Analysis of Sustainability Data Reporting of Selected Indian Companies
http://www.iaeme.com/IJM/index.asp 120 editor@iaeme.com
World is also caught up between two words - Sustainability and Development. There is
one group who is concerned about the needs of future generations whereas, there is another
group arguing for the poor of today’s generation who is deprived of very basic living such as
health care, education, social justice etc. (Pierce David and Atkinson Giles, 1998).
There is also confusion in the understanding of quality of life and standard of living.
Humans want quality of life and industrialists want standard of living. The human aspirations
confuse between standard of life and quality of life and that makes people hungry of new and
new things all the time. The industrialists market their products in such a way that people
want more and more all the time. Most of the economic growth today is through such growth
rather than improvement in quality of life. The rate at which we consume the finite natural
resources, it is near impossible to preserve the resources for the future generations (United
Nations, 2010). Marginal efforts by a limited world will not fetch much result.
Financial reporting is a legal requirement for organizations. However, as referred in the
article ‘Outside Insights Beyond Accounting’ authored by Graham Hubbard of University of
Adelaide for The Institute of Chartered Accountants in England and Wales (November,
2009), non-financial measurements of social and environmental performance also affect the
business strategy, practices and outcomes of an organization and hence it has become equally
important. Therefore, including social and environmental performance in the organization’s
reporting is being now referred to as Corporate Responsibility Reporting or Sustainability
Reporting.
To bring in some accountability to the corporate world various guidelines / standards have
been released for the organizations to report their performance on Sustainability. The most
common and widely adopted is the GRI guidelines released by Global Reporting Initiative
(Chopra K. et al, 2014). Other similar initiatives being Carbon Disclosure Project (CDP), UN
Global Compact’s Communication of Progress (CoP), National Voluntary Guidelines on
Social, Environmental and Economical Responsibility of Business released by Ministry of
Corporate Affairs, Govt. of India, etc.
Here of course, the major lead needs to be taken by the developed countries and less by
under developed nations. Most of the environmental talks at the global level have failed on
fixing the responsibility. Because the developed nations do not want to compromise on their
economic growth targets. The under developed countries do not have any capabilities and
they fall victims to the developed world.
There is a growing awareness on the environmental issues along with the political will and
commitment to address these issues (UNEP Report, 2013). The business organizations appear
to be in the dilemma of environmental preservation and social equality versus economic
growth. It’s a tough challenge (Elliott Jennifer A., 2006) for the organizations to embrace all
the three pillars ‘Profit, People and Planet’ within their business strategy and treat all of them
fairly equal.
Global Reporting Initiative (GRI) is a leading organization in the sustainability field
founded in 1997 in Boston, initially by name Coalition for Environmentally Responsible
Economies (CERES). GRI promotes the use of sustainability reporting as a way for
organizations to become more sustainable and contribute to the sustainable development. GRI
defines a reporting framework to be disclosed by the organizations. Globally GRI reporting is
being followed by organizations to report Sustainability. Currently all the guidelines are
voluntary in nature. However, as the consumers and other stake holders are becoming
conscious about the Sustainability challenges, there is an increased trend in reporting.
Sustainability Report presents the organization’s values and governance. GRI’s effort is to
make sustainability reporting a standard practice for every organization.

Parag Kalkar and Anand Chitanand
http://www.iaeme.com/IJM/index.asp 121 editor@iaeme.com
Richa Gautam and Anju Singh (2010), studied the CSR practices of top 500 Indian
companies to view and conduct their CSR. The paper deep-dives in to the history of
Corporate Social Responsibility and tracks how the awareness of CSR developed over a
period of time. It also studies the compliance of CSR practices globally and in India. Major
findings of the research paper were based on Karmayog’s research of top 500 Indian
companies.
In a study titled ‘Sustainability Reporting Trends in India’ carried out by Arvind Sharma,
Director Climate Change and Sustainability Services KPMG, it is observed that globally
economic consideration, innovation, employee motivation and cost saving prompt the
companies to adopt sustainability. In India, it has been observed that strengthening reputation,
brand promotion and ethical considerations are the key drivers of sustainability. As per Mr.
Sharma this contrast highlights that Indian companies still have not integrated sustainability in
to the mainstream. As per this study, almost all companies who report as per the GRI
guidelines claim to be A or A+ application level. It appears that the reporters believe that the
higher application level is equivalent to better sustainability performance. It is also observed
in this report that very few companies have a clear linkage of sustainability to their business
strategy.
2. STUDY OF SUSTAINABILITY REPORTS OF BSE TOP 100
COMPANIES
Most of the research so far has been in terms of the compliance of Indian companies with the
sustainability reporting. While it is important that more and more companies voluntarily adopt
the Sustainability reporting guidelines, it is equally important that the data reported is useful
in drawing meaningful information for the reader of the report. Sample for this study was
selected in the form of BSE top 100 companies from the internet as on 14th Nov. 2014. The
Sustainability Reports of the companies were accessed from Global Reporting Initiative’s
Sustainability Disclosure Database (SDD).
Interestingly, when these reports are actually checked on the GRI database, out of the total
100 companies (BSE Top 100), 47 companies have submitted at least one recent
Sustainability Report as per GRI guidelines. 42 companies have published their Annual
Report on the GRI database which includes Business Responsibility Report as per the
National Voluntary Guidelines 2011-12 required as per Ministry of Corporate Affairs, Govt.
of India.
Figure 1 Sector wise distribution of Companies Submitting Sustainability Reports

Critical Analysis of Sustainability Data Reporting of Selected Indian Companies
http://www.iaeme.com/IJM/index.asp 122 editor@iaeme.com
Figure 2 Sustainability Reporting Trend in India (November 2017)
Figure 3 Sustainability Reporting Companies on GRI Database. (February 2018)
3. GAPS IN SUSTAINABILITY DATA REPORTING
Businesses are becoming increasingly responsible and more and more number of companies –
private or public is disclosing their performance on the sustainability guidelines. The change
is definitely welcome. GRI guidelines are mostly followed by organizations, while some of
them follow the National Voluntary Guidelines released by Ministry of Corporate Affairs.
An attempt is made to critically analyze the data disclosed by the companies in their report.
Some of the companies are named in this paper and they are representative examples of the
observations. There is no direct or indirect intention of the authors to demean their efforts in
the journey towards a sustainable future.
A detailed study of the GRI based Sustainability Reports reveals following observations
1. Most of the reports portray a very positive and green picture in general.
2. A lot of effort is made by these reports to build a good image of the company
through various photographs, catchy phrases, product and services information,
various CSR activities etc.
3. The GRI guidelines recommend the organizations to report the data pertaining to
the reporting year and preceding two years. Since this is a recommendation and
not a mandatory requirement, some of the company have reported the data of only
two years or at times only for one year.
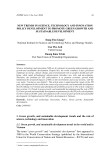
For example, take the case of ITC’s Sustainability Report for 2015. Green House Gas
emission for only two consecutive years’ (2013-14 and 2014-15) data is shown. Energy
intensity data is given for 2013-14 and 2014-15. While it serves the purpose of transparency,
it fails to give stake holders enough information as to if the organization is acting on the
material impact areas or not. Neither the baseline can be confirmed nor the improvement trend
can be judged. Similarly, Adani Ports and SEZ have presented the data of only one year for
most of the parameters in the Sustainability Report for 2016-17. Axis Bank in their
Sustainability Report 2016 has presented environmental data for only two years.

Parag Kalkar and Anand Chitanand
http://www.iaeme.com/IJM/index.asp 123 editor@iaeme.com
Figure 4 GHG Emissions data of ITC as per Sustainability Report for 2015
The figure shows two years’ data with marginal change in numbers.
It is not prudent to conclude. How can anyone conclude whether there is any
improvement or not? While the data shown is correct, but is it conclusive? Donald J. Wheeler
in his book ‘Understanding Variation - The Key To Managing Chaos’ (1993) says that no
comparison of two values can be global. A simple comparison of the current figure and
previous figure cannot fully capture and convey the behavior of the process or a time series. A
very important rule for data presentation by Dr. Walter Shewhart mentioned by Donald J.
Wheeler (1993) in above book -
Extract1
‘Data should always be presented in such a way that preserves the evidence in the data for
all the predictions that might be made from these data.’
Some companies such as GAIL (India) Limited provide five years’ data, which is
relatively much better to represent.
If we fetch the data from the recent Sustainability Reports of ITC and add the data for two
more years, the representation becomes more meaningful. Refer the graph below
Figure 5 ITC Limited GHG emissions as per Sustainability Reports 2015 and 2017
4. One of the very fundamental to process improvement is the measurement. It is
very important how one measures a particular parameter. Improvement or
deterioration in the parameter can be judged based on firming up the baseline
performance and a minimum number of observations or data points. The number
of data points increases the confidence level of the judgement.
ONGCL’s 2013-14 Sustainability report provides three years data for energy consumption
and energy savings. Of course, this is still inconclusive to establish a trend. For fresh water
consumption, a five consecutive years’ data is presented.