
http://www.iaeme.com/IJM/index.asp 152 editor@iaeme.com
International Journal of Management (IJM)
Volume 8, Issue 6, Nov–Dec 2017, pp. 152–162, Article ID: IJM_08_06_016
Available online at
http://www.iaeme.com/ijm/issues.asp?JType=IJM&VType=8&IType=6
Journal Impact Factor (2016): 8.1920 (Calculated by GISI) www.jifactor.com
ISSN Print: 0976-6502 and ISSN Online: 0976-6510
© IAEME Publication
WORKING CAPITAL MANAGEMENT AND
FIRM PROFITABILITY: A STUDY OF LISTED
COMPANIES IN INDIA
Arpita Naskar
Department of MBA, Student of Future Institute of Engineering and Management,
Sonarpur, Kolkata, India
Prasanta Guha
Department of MBA, Faculty of Future Institute of Engineering and Management,
Sonarpur, Kolkata, India
ABSTRACT
Financing decision of an entity bears relation with working capital management.
It is a part of short term financing. The study of corporate finance is also linked with
Working capital management. Thus, this study sought to examine the effect of working
capital management on profitability of select companies listed in BSE The study used
a sample of 53 companies. The study used secondary data for a period of 5 years from
2011 – 2015. The data have been analysed using the Pearson correlation and the
multivariate regression analysis. The study has revealed that the all components of
working capital namely Receivable days( RD), Payable days(PD), Inventory holding
periods ( ID), Current ratio ( CR) and Quick ratio ( QR) have strong impact on
profitability. Cash conversion cycle (CCC) is negatively related with the profitability,
Firm size is also linked with working capital. If firm size increases, the need of
working capital will be more. It has been found that the firm size has also significant
impact on EBIT but insignificant impact on ROA and ROE. Finally the study has
established a relation between working capital management and firm’s profitability.
Keyword head: Working capital management, Firm’s profitability, ROA, ROE, RD,
CCC
Cite this Article: Arpita Naskar and Prasanta Guha, Working Capital Management
and Firm Profitability: A Study of Listed Companies in India. International Journal of
Management, 8 (6), 2017, pp. 152–162.
http://www.iaeme.com/IJM/issues.asp?JType=IJM&VType=8&IType=6
1. INTRODUCTION
Many research has been conducted in the area of long term financing decisions viz.
investment decisions , capital structure and business valuation etc. In comparison to that
limited study has been extended in the field of working capital management. Working capital

Working Capital Management and Firm Profitability: A Study of Listed Companies in India
http://www.iaeme.com/IJM/index.asp 153 editor@iaeme.com
is the fund required to meet daily expenses in a business organization. It is the amount
invested in the current assets and can easily be converted into cash without changing the value
of the business (Mohanty, 2013). It can be expressed technically as excess of current assets
over current liabilities. Positive working capital reflects the capacity to pay short term
obligation while the negative working capital reflects the weakness of inability to pay the
same. Besides the negative working capital, excess is also not desirable. Insolvency may
cause due to inadequate working capital (Singh and Asress, 2010).
Working capital management ensures the proper balancing of different components say
debtors, receivable, cash balance, inventory, payables etc. The balance can be achieved by
minimizing the working capital requirement and maximizing the earning (Ganesan,2007).
Such balancing draws two concepts, liquidity and profitability. Liquidity gives strength to
meet short term obligation on the other hand firm’s ability to earn profit is reflected by
profitability quotient. It acts as a measure of firm performance. Effective working capital
management provides a firm to increase profitability along with the solution of optimum
liquidity (Uchenna et al., 2012).
2. LITERATURE REVIEW
Researchers have concentrated in the different areas of appropriate application of working
capital management. Working capital is just a fuel to a business named car. Extra penny
invested in the working capital would result to the decrease in value of the firm (Kieschnick et
al, (2006) . The prime question comes to the mind of the authors about the volume of working
capital. To understand the requirement of working capital , cash conversion cycle need to be
understood. This concept was first conceived by Richards and Laughlin (1980). Cash
conversion cycle ( CCC) is the summation of material procurement time, raw material
conversion period , inventory holding period and receivable days reduced by payable periods.
Raw materials conversion means to production time. More of production time will increase
CCC. More of finished goods holding period will cause to stretch the CCC. Similarly,
receivable days or periods refers to the time of goods sold on credit to collection from
customers. More the lengthy time to receive payments from debtors , more will be the CCC.
Payable days can be explained as the time to purchase the goods from suppliers to pay the
dues to suppliers. The management part lies in managing the time. Shorter the time period of
CCC or and increase in payable days , will require less amount of working capital. Increase in
payable days may apparently benefits the organization by arranging less amount of working
capital but in the long run it affects the goodwill of the organization.
Yogendrarajah and Thanabalasingam (n.d.) in their research revealed that firm’s
profitability can be increased by the effective inventory management. With reference to the
listed companies in Istambul , researchers found that the shareholders value can be increased
by reducing the accounts receivable period, accounts payable period and cash conversion
cycle (samiloglu and Akgun,2016).The same has been supported by Deloof (2003). Mansoori
and Muhammad (2012) also examined that the same fact in the context of Singapore. Using
OLS method their result revealed that the cash conversion cycle is negatively associated with
return on assets (ROA) where ROA is considered as a parameter of profitability.
Agha (2014) studied the same on a firm listed in Karachi stock exchange. The study
revealed that a firm can increase it’s profitability by minimizing the inventory turnover,
account receivables ratio and by decreasing creditors turnover ratios but there is no significant
effect of increasing or decreasing the current ration profitability. So, the results indicate that
through proper working capital management the company can increase it’s profitability. A
negative relationship has been prominent between debt and profitability of Indian firms in the

Arpita Naskar and Prasanta Guha
http://www.iaeme.com/IJM/index.asp 154 editor@iaeme.com
study of Chatterjee (2012). The results derived from this research signify that A firm is able to
raise it’s profits by diminishing the time period for the debtors and inventories so that the time
period for payables would increase. Discussing the same Makori and Jagongo (2013) find a
negative relationship between profitability and number of day’s accounts receivable and cash
conversion cycle, but a positive relationship between profitability and number of days of
inventory and number of day’s payable. Moreover, the financial leverage, sales growth,
current ratio and firm size also have significant effects on the firm’s profitability. Based on
the key findings from this study it has been concluded that the management of a firm can
create value for their shareholders by reducing the number of day’s accounts receivable
(Makori and Jagongo,2013). Similar results have been established by Elfani and Lois (2010);
Eljely (2004 ) and Jose (1996) have made the founding in their study that managers creates
value by reducing their volume of inventories and dues with the debtors and firm’s
profitability can be improved by shortening the cash conversion cycle.
The findings on the effect of working capital management and firm’s performance or
profitability of the researchers mentioned in the literature are quite similar. The author is also
interested to test the same varying with the companies and time span.
3. RESEARCH OBJECTIVES
The research objective is to study the relationship between profitability of the firm with the
working capital management. The specific objectives are as follows:
To study the impact of Working capital management of Indian firms listed in BSE
To observe the effect of accounts receivables, inventories holding periods, accounts payable
and cash conversion cycle on firm’s profitability
4. METHODOLOGY
Data and Sample Selection
The data used for the research have been obtained from the website www.arcadiastock.com
and individual website of the sample companies. Financial statements and annual reports have
been used for the study. The data comprising of 53 firms forty sectors listed in BSE have been
considered for study( see Table 1). A time period of 5 years with the span of 2011 to 2015 has
been taken for analysis. The name of the firms and sectors are given in the Table No.1.
Conceptual Framework
Independent variables:
An independent variable is the variable which the researcher has control over. In this study
the independent variable are Receivable days (RD),Inventory days(ID),Payable days(
PD),Cash conversion cycle ( CCC) ,Current ratio (CR), Quick ratio (QR), and Firm size or
LOGSALES .
Dependent variable
The profitability has been linked with dependent variables. The study has considered Earnings
before interest and tax (EBIT), Return on assets (ROA) and Return on equity(ROE) as
profitability indicator or dependent variable.
RD
Receivable days is the number of days that a customer invoice is outstanding before it is
collected. The point of measurement is to determine the effectiveness of a company’s credit
and collection efforts in allowing credit to reputable customers, as well as it’s ability to collect
cash from them. RD is calculated as ( Debtors+ Bills Receivable) / Net Sales x 3

Working Capital Management and Firm Profitability: A Study of Listed Companies in India
http://www.iaeme.com/IJM/index.asp 155 editor@iaeme.com
ID
Inventory days presents the days of holding the inventory. More and more holding of
inventory will be less of inventory turnover ratio. The inventory turnover ratio is an efficiency
ratio that shows how effectively inventory is managed by comparing cost of goods sold with
average inventory for a period. The inventory days are calculated as 365 / (Cost of goods sold
by average inventory).
PD
Accounts Payable Days is an accounting concept related to Accounts Payable. It is the length
of time it takes to clear all outstanding Accounts Payable. This is useful for determining how
efficient the company is at clearing whatever short-term account obligations it may have. PD
has been computed as summation of Sundry Creditors and Bills payable/ net sales x 365.
CCC
The cash conversion cycle (CCC) is a metric that expresses the length of time, in days, that it
takes for a company to convert resource inputs into cash flows. In other words, the cash
conversion cycle calculation measures how long cash is tied up in inventory before the
inventory is sold and cash is collected from customers. CCC is computed as RD+ID-PD.
CR
The current ratio is a financial ratio that measures whether or not a firm has enough resources
to pay its debts over the next 12 months. It compares a firm's current assets to
its current liabilities. It is considered as liquidity ratio. CR is calculated as current
assets/current liabilities.
QR
The quick ratio is a financial ratio used to gauge a company's liquidity. The quick ratio is also
known as the acid test ratio. It can be calculated as current assets – stock divided by current
liabilities.
LOG SALES
Size of the firm is linked with profitability. By the increase in size, earning of a firm
increases. The natural logarithm of sales (LOS) measures the growth of the firm. Logsales is
the natural logarithm of net sales.
EBIT
It is the amount of money that a company has earned after deducting the cost of goods
sold and operating expenses. This is used to see whether a company is making more than it
spends or is operating at a loss. The paper has used EBIT margin as a profitability variable.
ROA
Return on assets (ROA) is an indicator of how profitable a company is relative to its total
assets. ROA gives an idea as to how efficient management is at using its assets to generate. It
can be calculated as Net Income/Total assets .
ROE
Return on equity (ROE) is the amount of net income returned as a percentage
of shareholder’s equity. Return on equity measures a corporation's profitability by revealing
Arpita Naskar and Prasanta Guha
http://www.iaeme.com/IJM/index.asp 156 editor@iaeme.com
how much profit a company generates with the money shareholders have invested. ROE is
calculated as Net Income of the firm /Shareholder's Equity.
The analysis has been initiated with the descriptive statistics. To understand the relation
among the variables Pearson correlation statistics have been used. Further the study has been
proceeded to know the impact of independent variables on dependant variables and
multivariate regression analysis has been applied.
5. RESULTS AND DISCUSSIONS
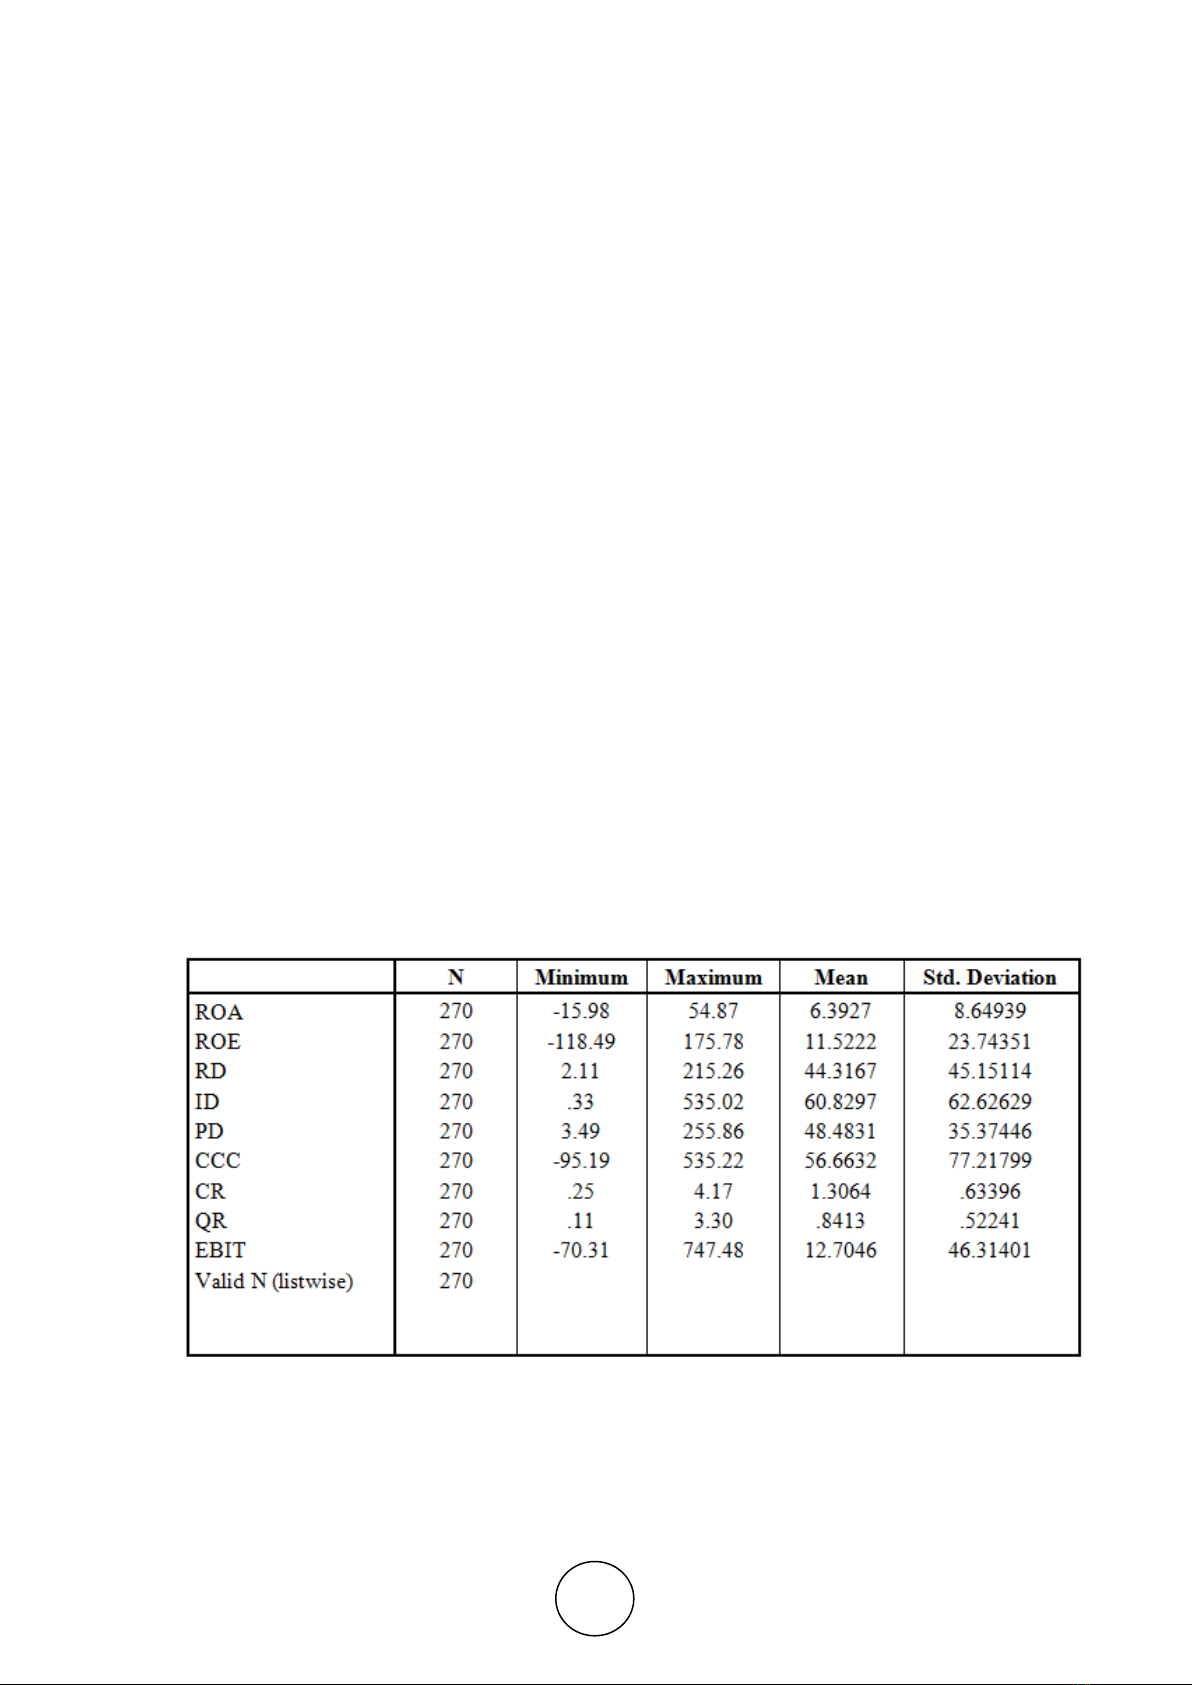
Refereeing to Table 2, the descriptive statistics of different variables applied in the research
have been presented. It presents maximum value, minimum value , mean and standard
deviation of 55 different companies for the span of 2011- 2015. Out of the total 270 nos of
observations mean value of ROA for all the industries is 6.39 with a maximum of 54.87 and a
minimum of -15.98. The standard deviation also shows a 8.64 of deviation from the mean.
The ROE has a maximum value of175.78, a minimum of -118.49 and a mean of 11.52
followed by a standard deviation of 27.74. Of the liquidity indicators firstly, the CCC has a
maximum of 535.22 days and a minimum of -95.19 days followed by a mean of 56.66 days
and 77.21days as standard deviation. Secondly, the CR shows a mean of 1.30:1 a maximum
value of 4.17:1 and a minimum value of .25:1. The standard deviation for CR is .63. Thirdly,
the ID shows a mean of 60.82 days with a maximum of 535.22 days and a minimum of .33
days. The standard deviation for the ID is 62.62. Fourthly, the RD has a maximum value of
215.26 days, a minimum of 2.11 days and a mean of 44.31 days followed by a standard
deviation of 45.15. Fifthly, the PD has a maximum of 255.86 days, a minimum of 3.49 days
and a mean of 48.48 days with a standard deviation of 35.37. Sixthly, the QR has .11:1 as
minimum,3.30:1 as maximum,.84:1 as mean and .52 as standard deviation. Finally, EBIT has
a mean of 12.70 with a maximum of 747.48, minimum of -70.31 and a standard deviation of
46.31.
Table 2 Descriptive Statistics
Table 3 presents the correlation to understand the interrelations between variables. Being a
measure of profitability, ROA is negatively influenced by CCC and it has statistically
significant impact. Similarly ROE and EBIT are negatively correlated (Deloof ,2003).
RD or receivable days and ID or inventory holding periods have been found as negative
correlated with profitability supported by ROA, ROE. It reflects if receivable days and or


![Giáo trình Kế toán Trung cấp Tài chính Doanh nghiệp: [Hướng dẫn chi tiết/mới nhất]](https://cdn.tailieu.vn/images/document/thumbnail/2026/20260526/alfredodistefano10/135x160/70231780288289.jpg)


![Bài tập Phân tích kinh doanh [chuẩn nhất]](https://cdn.tailieu.vn/images/document/thumbnail/2026/20260513/hoacattuong2026/135x160/41481778835180.jpg)


%20--%3e%3cdefs%3e%3cstyle%3e%20.st0%20{%20fill:%20%23fff;%20}%20.st1%20{%20fill:%20%237800fa;%20}%20%3c/style%3e%3c/defs%3e%3cpath%20class='st1'%20d='M117.78,12.18H43.11c2.9,3.47,4.65,7.94,4.65,12.82,0,5.6-2.3,10.66-6.01,14.29h76.02l7.22-13.56-7.22-13.56Z'/%3e%3cg%3e%3cpath%20class='st0'%20d='M53.58,26.17h-.59v-1.46h.59v-4.96h2.83c1.78,0,2.67.94,2.67,2.82v5.76c0,1.87-.89,2.81-2.67,2.81h-2.83v-4.96ZM55.36,21.37v3.34h1.1v1.46h-1.1v3.34h1.01c.61,0,.91-.37.91-1.1v-5.93c0-.74-.3-1.1-.91-1.1h-1.01Z'/%3e%3cpath%20class='st0'%20d='M65.99,31.14h-1.8l-.31-2.07h-2.19l-.31,2.07h-1.64l1.82-11.39h2.62l1.82,11.39ZM65.28,18.04c-.25.46-.51.77-.75.94-.21.15-.47.22-.79.22-.26,0-.57-.07-.92-.22l-.38-.15c-.14-.05-.26-.07-.37-.07-.3,0-.53.18-.71.54l-.91-.68c.25-.46.51-.77.75-.94.21-.14.48-.21.79-.21.26,0,.57.07.92.21l.38.15c.14.05.26.07.37.07.3,0,.53-.18.71-.54l.91.68ZM61.91,27.52h1.73l-.87-5.76-.87,5.76Z'/%3e%3cpath%20class='st0'%20d='M74.53,26.89v1.52c0,1.91-.89,2.86-2.67,2.86s-2.67-.95-2.67-2.86v-5.93c0-1.91.89-2.86,2.67-2.86s2.67.95,2.67,2.86v1.11h-1.69v-1.22c0-.75-.31-1.12-.93-1.12s-.93.37-.93,1.12v6.15c0,.74.31,1.11.93,1.11s.93-.37.93-1.11v-1.63h1.69Z'/%3e%3cpath%20class='st0'%20d='M81.4,31.14h-1.8l-.31-2.07h-2.19l-.31,2.07h-1.64l1.82-11.39h2.62l1.82,11.39ZM75.9,19.2l1.52-1.91h1.71l1.51,1.91h-1.61l-.76-.95-.75.95h-1.61ZM77.32,27.52h1.73l-.87-5.76-.87,5.76ZM83.1,15.99l-1.76,1.91h-1.26l1.17-1.91h1.86Z'/%3e%3cpath%20class='st0'%20d='M84.86,19.75c1.78,0,2.67.94,2.67,2.82v1.48c0,1.87-.89,2.81-2.67,2.81h-.85v4.28h-1.79v-11.39h2.64ZM84.01,21.37v3.86h.85c.58,0,.87-.36.87-1.08v-1.71c0-.71-.29-1.07-.87-1.07h-.85Z'/%3e%3cpath%20class='st0'%20d='M93.51,19.75c1.78,0,2.67.94,2.67,2.82v1.48c0,1.87-.89,2.81-2.67,2.81h-.85v4.28h-1.79v-11.39h2.64ZM92.66,21.37v3.86h.85c.58,0,.87-.36.87-1.08v-1.71c0-.71-.29-1.07-.87-1.07h-.85Z'/%3e%3cpath%20class='st0'%20d='M98.8,31.14h-1.79v-11.39h1.79v4.88h2.03v-4.88h1.83v11.39h-1.83v-4.88h-2.03v4.88Z'/%3e%3cpath%20class='st0'%20d='M105.36,24.55h2.46v1.62h-2.46v3.34h3.09v1.63h-4.88v-11.39h4.88v1.63h-3.09v3.18ZM108.17,17.29l-1.76,1.91h-1.26l1.17-1.91h1.86Z'/%3e%3cpath%20class='st0'%20d='M112.2,19.75c1.78,0,2.67.94,2.67,2.82v1.48c0,1.87-.89,2.81-2.67,2.81h-.85v4.28h-1.79v-11.39h2.64ZM111.35,21.37v3.86h.85c.58,0,.87-.36.87-1.08v-1.71c0-.71-.29-1.07-.87-1.07h-.85Z'/%3e%3c/g%3e%3ccircle%20class='st1'%20cx='25'%20cy='25'%20r='20'/%3e%3cpath%20class='st0'%20d='M32.78,19.27c2.92,0,4.43,2.55,5.28,5.33l.71,2.17c.14.38-.33.75-.71.75h-5.61c.19-.33.24-.71.09-1.08l-.75-2.45c-.43-1.32-.99-2.64-1.79-3.77.75-.57,1.65-.94,2.78-.94h0ZM25,18.38c3.25,0,4.9,2.78,5.89,5.89l.76,2.45c.14.42-.33.8-.8.8h-11.69c-.42,0-.94-.38-.8-.8l.75-2.45c.99-3.11,2.64-5.89,5.89-5.89h0ZM25,11.35c1.74,0,3.11,1.37,3.11,3.11s-1.37,3.11-3.11,3.11-3.11-1.41-3.11-3.11,1.41-3.11,3.11-3.11h0ZM17.27,19.27c1.08,0,1.98.38,2.73.94-.8,1.13-1.37,2.45-1.74,3.77l-.8,2.45c-.14.38-.05.75.09,1.08h-5.56c-.42,0-.9-.38-.75-.75l.71-2.17c.9-2.78,2.41-5.33,5.33-5.33h0ZM17.27,12.91c1.51,0,2.78,1.27,2.78,2.83s-1.27,2.83-2.78,2.83-2.83-1.27-2.83-2.83,1.27-2.83,2.83-2.83h0ZM32.78,12.91c1.56,0,2.78,1.27,2.78,2.83s-1.23,2.83-2.78,2.83-2.83-1.27-2.83-2.83,1.27-2.83,2.83-2.83h0ZM27.07,28.56v.09c0,.57-.24,1.08-.61,1.46h0v.05c-.38.33-.9.57-1.46.57s-1.08-.24-1.46-.61h0c-.38-.38-.61-.9-.61-1.46v-.09h1.41v.09c0,.19.05.38.19.47v.05c.09.09.28.19.47.19s.38-.09.47-.19v-.05c.14-.09.24-.28.24-.47t-.05-.09h1.41ZM30.99,28.56v.09c0,1.65-.66,3.16-1.74,4.24-1.08,1.08-2.59,1.79-4.24,1.79s-3.16-.71-4.24-1.79l-.05-.05c-1.04-1.08-1.7-2.55-1.7-4.2v-.09h1.41v.09c0,1.27.47,2.4,1.27,3.25h.05c.85.85,1.98,1.37,3.25,1.37s2.4-.52,3.25-1.37c.85-.8,1.37-1.98,1.37-3.25v-.09h1.37ZM34.99,28.56v.09c0,2.78-1.13,5.28-2.92,7.07-1.79,1.79-4.29,2.92-7.07,2.92s-5.23-1.13-7.07-2.92c-1.79-1.79-2.92-4.29-2.92-7.07v-.09h1.41v.09c0,2.4.94,4.53,2.5,6.08,1.56,1.56,3.72,2.5,6.08,2.5s4.52-.94,6.08-2.5c1.56-1.56,2.5-3.68,2.5-6.08v-.09h1.41Z'/%3e%3c/svg%3e)