Contents lists available at ScienceDirect
Measurement 58 (2014) 495–502
Measurement
j o u r n a l h o m e p a g e : w w w . e l s e v i e r . c o m / l o c a t e / m e a s u r e m e n t
Application of Taguchi-grey multi responses optimization on process parameters in electro erosion T. Muthuramalingam a,⇑
, B. Mohan b
a Department of Mechatronics Engineering, SRM University, Kattankulathur, India b Department of Mechanical Engineering, Anna University, Chennai, India
a r t i c l e
i n f o
a b s t r a c t
Article history: Received 3 April 2014 Received in revised form 4 September 2014 Accepted 11 September 2014 Available online 19 September 2014
Convention Taguchi method deals with only single response optimization problems. Since the electrical discharge machining process involved with many response parameters, Taguchi method alone cannot help to obtain optimal process parameters in such process. In the present work, an endeavor has been made to derive optimal combination of electri- cal process parameters in electro erosion process using grey relational analysis with Taguchi method. This multi response optimization of the electrical discharge machining process has been conducted with AISI 202 stainless steel with different tool electrodes such as copper, brass and tungsten carbide. Gap voltage, discharge current and duty factor have been used as electrical excitation parameters with different process levels. Taguchi L27 orthogonal table has been assigned for conducting experiments with the consideration of interactions among the input electrical process parameters. Material removal rate, electrode wear rate and surface roughness have been selected as response parameters. From the experimental results, it has been found that the electrical conductivity of the tool electrode has the most influencing nature on the machining characteristics in EDM process. The optimal combination of the input process parameters has been obtained using Taguchi-grey relational analysis.
(cid:2) 2014 Elsevier Ltd. All rights reserved.
1. Introduction
1.1. Electro erosion process
Electro erosion process or electrical discharge machin- ing (EDM) is removing material from the work piece by thermal erosion owing to the spark energy happened between two conductors. The ionization of dielectric medium has the important role in such process. Ho and Newman narrated about the mechanism involved in ther- mal erosion process [1]. This process can create crater in any conducting material by thermal energy irrespective
⇑ Corresponding author. Tel.: +91 44 22516155.
Keywords: Current Duration EDM Optimization Spark Taguchi
of hardness of the material. This causes less tool wear than the conventional manufacturing processes. In this process, two conductors i.e. tool and workpiece are separated by an isolating region called the dielectric medium. With the presence of the dielectric medium, the material is removed by producing precisely controlled electrical discharges occurring between the tool and the work piece. The tool electrode does not make contact with the work piece and it is separated by the distance required for electrical dis- charge sparking, known as ‘spark gap’. The number of sparks depends on the DC pulse frequency [2]. The air gap is filled by the dielectric medium. Whenever the spark gap is sufficient to ionize the dielectric medium, there is an electricity flow in a closest point between tool and work piece. The electrically conductive tool materials such as tungsten carbide and copper graphite, copper, brass,
E-mail addresses: muthu1060@gmail.com (T. Muthuramalingam), mohan@mitindia.edu (B. Mohan).
http://dx.doi.org/10.1016/j.measurement.2014.09.029 0263-2241/(cid:2) 2014 Elsevier Ltd. All rights reserved.
496 T. Muthuramalingam, B. Mohan / Measurement 58 (2014) 495–502
tungsten can be utilized as the tool electrodes in electrical discharge machining process [3]. A controlled DC pulse (30–100 V) is applied between tool and workpiece sepa- rated by small air gap (0.002–2 mm) with high frequency (100 kHz–10 MHz) [4]. When the dielectric medium reaches its breakdown voltage, the ionization effect occurs in the air gap. This ionization produces a initiation of spark between tool and workpiece. It leads to dissipation of higher amount of heat in terms of 8000–12000 (cid:3)C. Because of this higher thermal energy, the material is melted and in the air gap can be vaporized. The melted material removed by the flushing process.
1.2. Importance of multi response optimization in electro erosion process
explained about the methodology for finding influencing process parameters with Taguchi method while machining high speed steel [6]. Panda proposed the innovative modeling of electro erosion process [7]. Mukherjee and Chakraborty depicted the biogeography based optimiza- tion algorithm for selecting thermal erosion process parameters [8]. Chakravorty et al. discussed about need of optimizing the electrical process parameters involved in EDM process [9]. Panda and Yadava explained about the multi response optimization in chemical spark erosion process using genetic algorithm [10]. Jailani et al. obtained the optimal set of sintering parameters in grinding process using Taguchi method with grey technique [11]. Patel et al. applied the response surface methodology technique in machining process for optimization purpose [12]. Meena and Azad discussed about grey relational analysis in ther- mal erosion process [13]. Somashekhar et al. described about the optimization technique in EDM process using artificial intelligence and genetic techniques [14].
From the above literatures, it is clearly understood that only multi response optimization technique can give better optimal set of process parameters [15]. It is very clear that only few researches have been carried out in EDM process for optimizing electrical process parameters. While reviewing the literatures, it has been also found that interactions have not been taken into account, in case of electrical parameters optimization in EDM process. Since
Due to the random nature of such machining process, it is very essential to optimize the process parameters in EDM process. Conventional Taguchi method deals with single response optimization only. It may give different set of optimal combinations for multiple responses. It is needed to introduce multi response optimization tech- nique in the process. In this approach, the multiple responses can be converted into single normalized response. Then it is easy to obtain the optimal set of process parameters. Lin et al. discussed about need of opti- mizing non linear machining process [5]. Lin et al.
Table 1 Chemical composition of AISI 202 stainless steel. Elements C Si Cu Mn P S Mo Cr Sn Ni W Al Ti Fe % Composition 0.05 0.35 1.93 8.76 0.03 0.011 0.22 16.04 0.09 1.56 0.17 0.07 0.011 Remain
Table 2 Orthogonal table L27 for responses. Trial no. Voltage (V) Current (A) Duty factor Tool MRR (mm3/min) EWR (mm3/min) SR (lm)
1. 2. 3. 4. 5. 6. 7. 8. 9. 10. 11. 12. 13. 14. 15. 16. 17. 18. 19. 20. 21. 22. 23. 24. 25. 26. 27. 40 40 40 40 40 40 40 40 40 60 60 60 60 60 60 60 60 60 70 70 70 70 70 70 70 70 70 9 9 9 12 12 12 15 15 15 9 9 9 12 12 12 15 15 15 9 9 9 12 12 12 15 15 15 0.4 0.6 0.8 0.4 0.6 0.8 0.4 0.6 0.8 0.4 0.6 0.8 0.4 0.6 0.8 0.4 0.6 0.8 0.4 0.6 0.8 0.4 0.6 0.8 0.4 0.6 0.8 WC Br Cu Br Cu WC Cu WC Br Br Cu WC Cu WC Br WC Br Cu Cu WC Br WC Br Cu Br Cu WC 0.783 4.896 8.097 4.673 8.811 0.971 7.142 0.982 6.562 4.328 8.323 1.157 7.566 1.128 8.862 0.973 7.769 15.485 9.363 1.111 10.647 1.135 8.453 16.621 7.865 13.803 1.568 0.326 3.724 5.286 5.523 5.604 0.725 5.124 0.731 12.458 3.789 4.464 0.618 3.592 0.674 10.235 0.595 10.357 10.562 3.125 0.595 8.934 0.484 8.128 8.159 7.653 8.364 0.905 0.0157 1.3219 0.9716 1.2617 1.0573 0.0194 0.857 0.0196 1.7717 1.1686 0.9988 0.0231 0.9079 0.226 2.3927 0.0195 2.0976 1.85282 1.1236 0.0222 2.8747 0.0227 2.2823 1.9945 2.1236 1.6564 0.0314
In this present paper,
been selected as the response parameters. 40 V, 60 V and 70 V have been selected as gap voltage ranges. Discharge current has been chosen as 9 A, 12 A and 15 A with duty factor of 0.4, 0.6 and 0.8. Material removal rate and elec- trode wear has been calculated on weight difference of the material during the machining process. The average surface roughness has been computed by SE1200 surfcoder surface roughness tester with cutoff length of 0.8 mm.
3. Taguchi method
3.1. Design of experiments
the electrical parameters have relations between them, it is important to consider the interactions effect among those interactions effects parameters. between the process parameters have been taken into account for designing orthogonal table. L27 orthogonal table based Taguchi design of experiment with grey rela- tional analysis methodology has been utilized to perform multi response optimization in thermal erosion process. In the aerospace engineering and auto motive engineering field, surface quality with high material rate is the favorable one. This multi response optimization can be adopted for such situations. The main aim of this work on machinability of AISI 202 stainless steel in EDM process with different process parameters are as follows:
1. To analyze the effect of process parameters on machin-
ing characteristics.
2. To find the optimal combination of
Due to its simplicity and easy adaptability, Taguchi method can be adopted for optimizing the process variables. This method provides the desired information from the minimum number of trials with different number of levels. The least number of trials can be calculated as per following equation
input process parameters for obtaining better multiple response parameters.
DOF ¼ ðP (cid:2) 1Þ ðFÞ þ ðP (cid:2) 1Þ ðP (cid:2) 1Þ ðQ Þ
3. To identify the most influencing electrical process
parameter in thermal erosion process.
þ 1 for the average
ð1Þ
2. Experiments and methods
where DOF is degree of freedom, F is number of indepen- dent variables, p is their levels, and Q is number of interac- tions. The number of trials should be larger than or equal to DOF for conducting experiments in any process. Since four input factors have been selected with three interfaces in the present study, L27 orthogonal table has been chosen as per the Taguchi design of experiments. Table 2 shows the L27 orthogonal table with input parameter levels and response values in EDM process.
3.2. Selection of quality characteristics level
The response in the each trial has to be transformed into S/N ratio to determine quality characteristics. Since the MRR has to be maximized, it is chosen as superior the better type of quality characteristics. Hence the S/N ratio for this response has been computed from the follow- ing equation.
S=N ratio ¼ (cid:2)10 (cid:3) logð1=xÞRð1=Y 2
ð2Þ
njÞ
In this present study, AISI 202 stainless steel has been used as the work material. It is widely used in automobile industries and railway tracks. The stainless steel with complicated shapes can be easily machined using EDM process. The chemical composition of that material is shown in Table 1. Copper, brass and tungsten carbide have been selected as the tool electrodes due to their various electrical conductivity. Owing to the uniform energy distri- bution, the iso current pulse generator has been used for applying pulses between tool and work piece. Kerosene has been used as dielectric medium in EDM process. It has been utilized for insulating purpose and flushing pro- cess. Since the discharge energy depends on gap voltage, duty factor and discharge current, they have been selected as electrical input process parameters with different types of tool electrode [2]. Material removal rate (MRR), elec- trode wear rate (EWR) and surface roughness (Ra) have
Surface roughness and TWR are smaller the better type and their S/N ratios have been computed from the following equation.
ð3Þ
S=N ratio ¼ (cid:2)10 (cid:3) logð1=xÞRY 2 nj
where x is number of experimental replication and Ynj is response of nth trial of jth dependent level.
4. Grey relational optimization
Grey relational technique is used for solving interrela- tionships among the multiple responses. This analysis consists of following rules.
Step 1: Transform the responses into the S/N ratio Ynj using the appropriate equations depending on the quality characteristics.
497 T. Muthuramalingam, B. Mohan / Measurement 58 (2014) 495–502
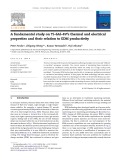
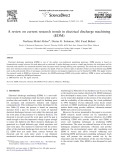
Fig. 1. SEM micro structure image of crater in EDM process.
498 T. Muthuramalingam, B. Mohan / Measurement 58 (2014) 495–502
Table 3 Signal to noise ratio with their normalized value for various response parameters. Trial no. Material removal rate (mm3/min) Electrode wear rate (mm3/min) Surface roughness (lm) S/N ratio Normalized S/N ratio S/N ratio Normalized S/N ratio S/N ratio Normalized S/N ratio
1. 2. 3. 4. 5. 6. 7. 8. 9. 10. 11. 12. 13. 14. 15. 16. 17. 18. 19. 20. 21. 22. 23. 24. 25. 26. 27. (cid:2)2.124765 13.796828 18.166483 13.391916 18.900504 (cid:2)0.255615 17.076397 (cid:2)0.15777 16.340725 12.725745 18.405598 1.2666672 17.577327 1.046182 18.950635 (cid:2)0.237743 17.807302 23.798224 19.4283 0.9142812 20.544545 1.0999172 18.540217 24.413143 17.913975 22.79947 3.9069212 0 0.599956605 0.764613691 0.584698712 0.792273039 0.070433193 0.723537135 0.074120189 0.695815568 0.559596108 0.773624013 0.127795762 0.742413145 0.119487451 0.794162069 0.071106653 0.751079076 0.976828663 0.812161436 0.114517172 0.854223704 0.1215123 0.778696737 1 0.755098689 0.939193653 0.227285669 9.735648 (cid:2)11.4202 (cid:2)14.4625 (cid:2)14.8435 (cid:2)14.97 2.79324 (cid:2)14.1922 2.721652 (cid:2)21.909 (cid:2)11.5705 (cid:2)12.9945 4.18023 (cid:2)11.1067 3.426802 (cid:2)20.2018 4.509661 (cid:2)20.3047 (cid:2)20.4749 (cid:2)9.897 4.509661 (cid:2)19.0209 6.303093 (cid:2)18.1997 (cid:2)18.2327 (cid:2)17.6766 (cid:2)18.4483 0.867028 0 0.66854406 0.764685111 0.776723725 0.78072003 0.219386486 0.756141463 0.221648714 1 0.673293636 0.718293081 0.175556306 0.658638218 0.199365338 0.946049548 0.165146009 0.949301996 0.954681855 0.620409759 0.165146009 0.908733981 0.108471904 0.882781881 0.883826758 0.866253348 0.890638078 0.280256541 36.08201 (cid:2)2.42397 0.25025 (cid:2)2.01912 (cid:2)0.48396 34.24397 1.340384 34.15488 (cid:2)4.9678 (cid:2)1.35332 0.010429 32.72776 0.83924 12.91783 (cid:2)7.57776 34.19931 (cid:2)6.43445 (cid:2)5.35666 (cid:2)1.01223 33.07294 (cid:2)9.17185 32.87948 (cid:2)7.16745 (cid:2)5.99668 (cid:2)6.54145 (cid:2)4.3833 30.06141 0 0.850888345 0.791794559 0.841942147 0.80801891 0.040616305 0.767705262 0.042584907 0.907100824 0.827229492 0.797094009 0.07412074 0.77877932 0.511871889 0.964774607 0.04160313 0.939510209 0.915693702 0.819692389 0.066493101 1 0.070768044 0.955707747 0.9298365 0.941874667 0.894184815 0.13304065
Table 4 Grey relational co-efficient with their grade and rank. Rank Grey relational coefficient Grey Trial no. Table 5 Average grey relational grade for each input parameters. MRR SR EWR relational grade Control factor Max–min Factor notation Average grey relational grade Level 1 Level 2 Level 3
V I 0.6304 0.6345 0.6659 0.6620 0.0827 0.0791
Znj ¼ ðY nj (cid:2) min Y njÞ=ðmax Y nj (cid:2) min Y njÞ
½for larger the better case(cid:4)
ð4Þ
Znj ¼ ðmax Y nj (cid:2) Y njÞ=ðmax Y nj (cid:2) min Y njÞ
½for smaller the better case(cid:4)
ð5Þ
where Znj is the normalized value of nth trial for jth depen- dent response.
Step 3: Compute the grey co-efficient (GC) for the normalized S/N ratio values as per following equation
DF Tool Gap voltage (V) 0.5832 0.5829 Discharge current (A) Duty factor Tool material 0.5685 0.7663 0.6836 0.3668 0.6270 0.7467 0.1151 0.3995 Total mean grey relational grade = 0.6265.
ð6Þ
GCnj ¼ ðWmin þ dWmaxÞ=ðWnj þ dWmaxÞ
Step 2: Normalize the S/N ratio to distribute the data evenly and scale it into acceptable range for further analysis by following equations.
where GC is the grey co-efficient for nth trial of jth depen- dent response, d is the quality loss and W is the distinctive co efficient which has value from 0 to 1.
1. 2. 3. 4. 5. 6. 7. 8. 9. 10. 11. 12. 13. 14. 15. 16. 17. 18. 19. 20. 21. 22. 23. 24. 25. 26. 27. 0.3333 0.5555 0.6799 0.5462 0.7064 0.3497 0.6439 0.3506 0.6217 0.5316 0.6883 0.3643 0.6599 0.3621 0.7083 0.3499 0.6676 0.9557 0.7269 0.3608 0.7742 0.3627 0.6931 1 0.6712 0.8915 0.3928 0.3333 0.6013 0.6799 0.6912 0.6951 0.3904 0.6721 0.3911 1 0.6048 0.6396 0.3775 0.5942 0.3844 0.9026 0.3745 0.9079 0.9168 0.5684 0.3745 0.8456 0.3593 0.8100 0.8114 0.7889 0.8205 0.4099 0.3333 0.7702 0.7060 0.7598 0.7225 0.3426 0.6827 0.3430 0.8433 0.7431 0.7113 0.3506 0.6932 0.5060 0.9341 0.3428 0.8920 0.8557 0.7349 0.3487 1 0.3498 0.9186 0.8769 0.8958 0.8253 0.3657 0.3333 0.6424 0.6886 0.6658 0.7081 0.3609 0.6663 0.3616 0.8217 0.6266 0.6798 0.3642 0.6492 0.4175 0.8484 0.3558 0.8225 0.9094 0.6768 0.3614 0.8733 0.3573 0.8073 0.8961 0.7853 0.8458 0.3895 27 17 11 15 10 24 14 22 7 18 12 21 16 19 4 26 6 1 13 23 3 25 8 2 9 5 20
5. Results and discussion
5.1. Computation of S/N ratio and grey relational grade
energy dissipation,
larger
499 T. Muthuramalingam, B. Mohan / Measurement 58 (2014) 495–502
Fig. 1 shows the surface topography of machined workpiece using EDM process which has been taken by scanning electron microscope (SEM) with the input param- eter settings of trail number 27. Owing to the higher dis- charge crater has been observed [3]. Table 3 depicts the signal to noise ratio with their normalized value for various response parameters. MRR has been assumed as higher the best quality whereas EWR and Ra have been considered as smaller the better quality characteristics. Since this study has been contained with both the quality characteristics, the distinguishing co-efficient value has been taken as 0.5 [11].
Step 4: Compute grey relation grade by following equa- tion
ð7Þ
Gn ¼ ð1=Q ÞRGCnj
The values of grey relational components with their rank of all the experiments are furnished in Table 4. The higher value of grey relational grade indicates the better multi response characteristics during the machining pro- cess. Therefore, it has been observed that experiment trial number 18 has the optimal parameters setting among the
Step 5: Utilize response graph method to select optimal levels of the input factors based on maximum average Gn value.
Fig. 2. Response graph of average grey relational grade.
Fig. 3. Effects of process parameters on material removal rate (MRR).
500 T. Muthuramalingam, B. Mohan / Measurement 58 (2014) 495–502
existing input process parameter combination for the better multi response characteristics such as MRR, EWR and Ra. Table 5 shows the average of grade scale for all the levels of input parameters.
5.2. Identification of significant process parameters
characteristics. In the main plot, the deviation from hori- zontal line indicates the more influence of process param- eter on response variables [15]. It is noted that tool material and duty factor are the most influencing factors in EDM process. Since the tool materials have been selected based their electrical conductivity, they have indirectly represented the current flowing the machining current during the erosion process [3]. It has been found that the influences of the interactions among the input electrical process parameters on machinability in EDM process has been mostly observed owing to the existence of stochastic nature during the larger ratings [4,13,15].
5.3. Confirmation test
The average grey technique grade has been computed by taking the average of grey technique grades by each fac- tor level in the orthogonal array. This value indicates the correlation levels between the comparability values and reference value. Therefore, the optimal value of each parameter is the highest average grey relational value in the process [11]. Fig. 2 shows the response graph of aver- age grey relational grade. It has been observed that better optimal value of parameters are level 3 (gap voltage), level 3 (discharge current), level 2 (duty factor) and level 1 (tool conductivity). The max–min indicated the level of most influencing nature among the input parameters on determining the machining characteristics [14]. Figs. 3–5 shows the effects of process parameters on machining
The confirmation test has to be conducted after the identification of optimal input process parameters to analyze the accuracy of the optimal combination [16]. In this test, the trial has been conducted in EDM process with the obtained optimal combination of input process parameters. The predicted grey relational grade (Gp) with
Fig. 4. Effects of process parameters on surface roughness (Ra).
501 T. Muthuramalingam, B. Mohan / Measurement 58 (2014) 495–502
optimal parameters can be computed as per following equation
characteristics such as material removal rate, electrode wear rate and surface roughness.
ð8Þ
Gp ¼ Gm þ RðGo (cid:2) GmÞ
parameter
settings
optimal
where Gm is the total mean grey relational grade and Go is the optimal mean grey relational grade for each level of factor [14]. From the above equation, the predicted value has been found as 0.8412. The response values have been obtained with as 15.492(MRR), 10.571(EWR) and 1.871(Ra). The value of grey relational grade has been found as 0.8711. The grey relational grade value has been improved by 3.4% from the predicted mean grade.
I. The highest max–min grade value shows that the tool electrical conductivity has the most influent parameter on determining response characteristics. II. The values of optimum electrical process parameters among the existing parameter combinations are gap voltage 70 V, discharge current 15 A and duty factor 0.6 with copper electrode has given the better multi- ple response characteristics. Confirmation test has proved that the obtained optimal combinations sat- isfied the requirements of electrical parameters involved in EDM process.
6. Conclusion
References
Fig. 5. Effects of process parameters on electrode wear rate (EWR).
[1] K.H. Ho, S.T. Newman, State of the art electrical discharge machining, Int. J. Mach. Tool Manuf. 43 (2003) 1287–1300.
In the present study, Taguchi-grey methodology has been used to find the optimal levels of electrical parameters involved in EDM process on machining AISI 202 stainless steel for obtaining multiple performance
[2] T. Muthuramalingam, B. Mohan, Influence of discharge current pulse on machinability in electrical discharge machining, Mater. Manuf. Process. 28 (2013) 375–380.
502 T. Muthuramalingam, B. Mohan / Measurement 58 (2014) 495–502
[3] T. Muthuramalingam, B. Mohan, Influence of
tool electrode properties on machinability in spark erosion machining, Mater. Manuf. Process. 28 (2013) 939–943. [10] M.C. Panda, V. Yadava, Intelligent modeling and multi objective optimization of die sinking electrochemical spark machining process, Mater. Manuf. Process. 27 (2012) 10–25.
[4] T. Muthuramalingam, B. Mohan, A. Rajadurai, D. Saravanakumar, Monitoring and fuzzy control approach for efficient electrical discharge machining process, Mater. Manuf. Process. 29 (2013) 281–286. [11] H.S. Jailani, A. Rajadurai, B. Mohan, A.S. Kumar, T.S. Kumar, Multi- response optimization of sintering parameters of Al–Si alloy/fly ash composite using Taguchi method and grey relational analysis, Int. J. Adv. Manuf. Technol. 45 (2009) 362–369.
[5] Y.C. Lin, C.H. Cheng, B.L. Su, L.R. Hwang, Machining characteristics and optimization of machining parameters of SKH 57 high-speed steel using electrical-discharge machining based on Taguchi method, Mater. Manuf. Process. 21 (2006) 922–929. [12] K.M. Patel, P. Pandey, P.V. Rao, Determination of an optimum parametric combination using a surface roughness prediction model for EDM of Al2O3/SiCw/TiC ceramic composite, Mater. Manuf. Process. 24 (2006) 675–682.
[13] V.K. Meena, M.S. Azad, Grey relational analysis of micro-EDM machining of Ti–6Al–4V alloy, Mater. Manuf. Process. 27 (2012) 973–977. [6] Y.C. Lin, A.C. Wang, D.A. Wang, C.C. Chen, Machining performance and optimizing machining parameters of Al2O3–TiC ceramics using EDM based on the Taguchi method, Mater. Manuf. Process. 24 (2009) 667–674. removal
[14] K.P. Somashekhar, N. Ramachandran, J. Mathew, Optimization of material rate in micro-EDM using artificial neural network and genetic algorithms, Mater. Manuf. Process. 25 (2010) 467–475. [7] D.K. Panda, Modelling and optimization of multiple process attributes of electro discharge machining process by using a new hybrid approach of neuro-grey modeling, Mater. Manuf. Process. 25 (2012) 450–461.
[8] R. Mukherjee, S. Chakraborty, Selection of EDM process parameters using biogeography-based optimization algorithm, Mater. Manuf. Process. 27 (2012) 954–962.
[9] R. Chakravorty, S.K. Gauri, S. Chakraborty, Optimization of correlated responses of EDM process, Mater. Manuf. Process. 27 (2012) 337– 347. [15] J.H. Jung, W.T. Kwon, Optimization of EDM process for multiple performance characteristics using Taguchi method and grey relational analysis, J. Mech. Sci. Technol. 24 (2010) 1083–1090. [16] A.N. Haq, P. Marimuthu, R. Jeyapaul, Multi response optimization of machining parameters of drilling Al/SiC metal matrix composites using grey relational analysis in the Taguchi method, Int. J. Adv. Manuf. Technol. 37 (2008) 250–255.
![PFR96/PFR96P: Tư vấn chọn mua [nếu là sản phẩm] / Hướng dẫn sử dụng [nếu là hướng dẫn] chi tiết](https://cdn.tailieu.vn/images/document/thumbnail/2017/20170331/mrcuongchip/135x160/7801490925524.jpg)


![Cẩm nang Gia công kim loại Việt Nam [mới nhất]](https://cdn.tailieu.vn/images/document/thumbnail/2026/20260513/baobinh_011/135x160/7971778670576.jpg)


![Giáo trình Hàn ống nâng cao (Nghề Hàn - CĐ) Trường Cao đẳng nghề Hải Dương [Mới nhất]](https://cdn.tailieu.vn/images/document/thumbnail/2025/20251212/laphong0906/135x160/47521779076565.jpg)


%20--%3e%3cdefs%3e%3cstyle%3e%20.st0%20{%20fill:%20%23fff;%20}%20.st1%20{%20fill:%20%237800fa;%20}%20%3c/style%3e%3c/defs%3e%3cpath%20class='st1'%20d='M117.78,12.18H43.11c2.9,3.47,4.65,7.94,4.65,12.82,0,5.6-2.3,10.66-6.01,14.29h76.02l7.22-13.56-7.22-13.56Z'/%3e%3cg%3e%3cpath%20class='st0'%20d='M53.58,26.17h-.59v-1.46h.59v-4.96h2.83c1.78,0,2.67.94,2.67,2.82v5.76c0,1.87-.89,2.81-2.67,2.81h-2.83v-4.96ZM55.36,21.37v3.34h1.1v1.46h-1.1v3.34h1.01c.61,0,.91-.37.91-1.1v-5.93c0-.74-.3-1.1-.91-1.1h-1.01Z'/%3e%3cpath%20class='st0'%20d='M65.99,31.14h-1.8l-.31-2.07h-2.19l-.31,2.07h-1.64l1.82-11.39h2.62l1.82,11.39ZM65.28,18.04c-.25.46-.51.77-.75.94-.21.15-.47.22-.79.22-.26,0-.57-.07-.92-.22l-.38-.15c-.14-.05-.26-.07-.37-.07-.3,0-.53.18-.71.54l-.91-.68c.25-.46.51-.77.75-.94.21-.14.48-.21.79-.21.26,0,.57.07.92.21l.38.15c.14.05.26.07.37.07.3,0,.53-.18.71-.54l.91.68ZM61.91,27.52h1.73l-.87-5.76-.87,5.76Z'/%3e%3cpath%20class='st0'%20d='M74.53,26.89v1.52c0,1.91-.89,2.86-2.67,2.86s-2.67-.95-2.67-2.86v-5.93c0-1.91.89-2.86,2.67-2.86s2.67.95,2.67,2.86v1.11h-1.69v-1.22c0-.75-.31-1.12-.93-1.12s-.93.37-.93,1.12v6.15c0,.74.31,1.11.93,1.11s.93-.37.93-1.11v-1.63h1.69Z'/%3e%3cpath%20class='st0'%20d='M81.4,31.14h-1.8l-.31-2.07h-2.19l-.31,2.07h-1.64l1.82-11.39h2.62l1.82,11.39ZM75.9,19.2l1.52-1.91h1.71l1.51,1.91h-1.61l-.76-.95-.75.95h-1.61ZM77.32,27.52h1.73l-.87-5.76-.87,5.76ZM83.1,15.99l-1.76,1.91h-1.26l1.17-1.91h1.86Z'/%3e%3cpath%20class='st0'%20d='M84.86,19.75c1.78,0,2.67.94,2.67,2.82v1.48c0,1.87-.89,2.81-2.67,2.81h-.85v4.28h-1.79v-11.39h2.64ZM84.01,21.37v3.86h.85c.58,0,.87-.36.87-1.08v-1.71c0-.71-.29-1.07-.87-1.07h-.85Z'/%3e%3cpath%20class='st0'%20d='M93.51,19.75c1.78,0,2.67.94,2.67,2.82v1.48c0,1.87-.89,2.81-2.67,2.81h-.85v4.28h-1.79v-11.39h2.64ZM92.66,21.37v3.86h.85c.58,0,.87-.36.87-1.08v-1.71c0-.71-.29-1.07-.87-1.07h-.85Z'/%3e%3cpath%20class='st0'%20d='M98.8,31.14h-1.79v-11.39h1.79v4.88h2.03v-4.88h1.83v11.39h-1.83v-4.88h-2.03v4.88Z'/%3e%3cpath%20class='st0'%20d='M105.36,24.55h2.46v1.62h-2.46v3.34h3.09v1.63h-4.88v-11.39h4.88v1.63h-3.09v3.18ZM108.17,17.29l-1.76,1.91h-1.26l1.17-1.91h1.86Z'/%3e%3cpath%20class='st0'%20d='M112.2,19.75c1.78,0,2.67.94,2.67,2.82v1.48c0,1.87-.89,2.81-2.67,2.81h-.85v4.28h-1.79v-11.39h2.64ZM111.35,21.37v3.86h.85c.58,0,.87-.36.87-1.08v-1.71c0-.71-.29-1.07-.87-1.07h-.85Z'/%3e%3c/g%3e%3ccircle%20class='st1'%20cx='25'%20cy='25'%20r='20'/%3e%3cpath%20class='st0'%20d='M32.78,19.27c2.92,0,4.43,2.55,5.28,5.33l.71,2.17c.14.38-.33.75-.71.75h-5.61c.19-.33.24-.71.09-1.08l-.75-2.45c-.43-1.32-.99-2.64-1.79-3.77.75-.57,1.65-.94,2.78-.94h0ZM25,18.38c3.25,0,4.9,2.78,5.89,5.89l.76,2.45c.14.42-.33.8-.8.8h-11.69c-.42,0-.94-.38-.8-.8l.75-2.45c.99-3.11,2.64-5.89,5.89-5.89h0ZM25,11.35c1.74,0,3.11,1.37,3.11,3.11s-1.37,3.11-3.11,3.11-3.11-1.41-3.11-3.11,1.41-3.11,3.11-3.11h0ZM17.27,19.27c1.08,0,1.98.38,2.73.94-.8,1.13-1.37,2.45-1.74,3.77l-.8,2.45c-.14.38-.05.75.09,1.08h-5.56c-.42,0-.9-.38-.75-.75l.71-2.17c.9-2.78,2.41-5.33,5.33-5.33h0ZM17.27,12.91c1.51,0,2.78,1.27,2.78,2.83s-1.27,2.83-2.78,2.83-2.83-1.27-2.83-2.83,1.27-2.83,2.83-2.83h0ZM32.78,12.91c1.56,0,2.78,1.27,2.78,2.83s-1.23,2.83-2.78,2.83-2.83-1.27-2.83-2.83,1.27-2.83,2.83-2.83h0ZM27.07,28.56v.09c0,.57-.24,1.08-.61,1.46h0v.05c-.38.33-.9.57-1.46.57s-1.08-.24-1.46-.61h0c-.38-.38-.61-.9-.61-1.46v-.09h1.41v.09c0,.19.05.38.19.47v.05c.09.09.28.19.47.19s.38-.09.47-.19v-.05c.14-.09.24-.28.24-.47t-.05-.09h1.41ZM30.99,28.56v.09c0,1.65-.66,3.16-1.74,4.24-1.08,1.08-2.59,1.79-4.24,1.79s-3.16-.71-4.24-1.79l-.05-.05c-1.04-1.08-1.7-2.55-1.7-4.2v-.09h1.41v.09c0,1.27.47,2.4,1.27,3.25h.05c.85.85,1.98,1.37,3.25,1.37s2.4-.52,3.25-1.37c.85-.8,1.37-1.98,1.37-3.25v-.09h1.37ZM34.99,28.56v.09c0,2.78-1.13,5.28-2.92,7.07-1.79,1.79-4.29,2.92-7.07,2.92s-5.23-1.13-7.07-2.92c-1.79-1.79-2.92-4.29-2.92-7.07v-.09h1.41v.09c0,2.4.94,4.53,2.5,6.08,1.56,1.56,3.72,2.5,6.08,2.5s4.52-.94,6.08-2.5c1.56-1.56,2.5-3.68,2.5-6.08v-.09h1.41Z'/%3e%3c/svg%3e)