
P-ISSN 1859-3585 E-ISSN 2615-9619 https://jst-haui.vn ECONOMICS - SOCIETY Vol. 60 - No. 11E (Nov 2024) HaUI Journal of Science and Technology
3
ASSESSMENT AND RISK ZONING OF ECONOMIC DAMAGE DUE TO INUNDATION IN DISTRICT 7, HO CHI MINH CITY IN 2021-2022
Nguyen Ngoc Diep2, Nguyen Truc Quan1, Bui Viet Hung1,* DOI: http://doi.org/10.57001/huih5804.2024.337ABSTRACT
District 7 of Ho Chi Minh City (HCMC) is one of the few districts surrounded
by large rivers and canals. District 7 is at the intersection between two large
rivers, Saigon River and Dong Nai River, and is a transitional place between
the city centre and the surrounding districts (Nha Be District and Binh Chanh
District). With a special location, District 7 is faced widespread urban flooding
caused by both rain
and tides, being extra transitional factors in population
density and economic conditions. With the infrastructure for water drainage
and anti-
tide being still incomplete, the impacts of flooding have caused
many disadvantages to people living in the area
. Inheriting the studying on
economic damage caused by flooding of Ho Chi Minh City in the period 2016 -
2019, the topic of surveying and assessing economic damage caused by flood
of people living in District 7 for the period 2021 -
2022 is performed. The
results of the study showed that the distribution of inundation, damage level
and risk of damage due to
flooding are concentrated in the densely populated
areas and riverside areas. Thereby, the study wishes to contribute a "way" to
assess the damage cause
d by flooding for the management agencies of the
district as well as Ho Chi Minh City. Keywords:
Urban inundation, risk damage, direct damage, indirect
damage. 1Faculty of Environment, University of Science, VNU-HCM, Vietnam 2University of Labour and Social Affair (Branch 2 - Ho Chi Minh City), Vietnam
*Email: bvhung@hcmus.edu.vn Received: 18/5/2024 Revised: 15/7/2024 Accepted: 28/11/2024 1. GENERAL Urban inundation has been a hot topic of discussion in recent years. This is the phenomenon of flooding in urban areas. This phenomenon happened usually in big cities. With a dense population and diverse occupations, urban flooding always causes severe consequences [1]. Urban inundation is the phenomenon of flooding in residential areas, roads, administrative areas... in cities satisfying some specific conditions such as inundation depth, inundation time and flooded area. Depending on the topographical conditions of the city area, the flood situation will be different and the names are also different such as floods, inundation ... in the official dispatch of the Ministry of Construction on the requirements for the designing urban drainage system is determined to not flood when the water depth is about 30cm, the flooding time is less than 30 minutes after the inundation phenomenon ends, and the flooded area is not more than 2000m2. Research by Nguyen Viet Hung and colleagues [2] on the building flood maps in "Building inundation maps for flood control, urban planning in Ho Chi Minh City" has identified the level of flooding caused economic damage to people living in 22/24 districts of Ho Chi Minh City. In addition, the study also assessed the degree of flooding and classified according to the frequency of occurrence of urban flooding causing economic damage [2]. Thus, damage caused by flooding can be classified into direct damage and indirect damage [2], with: - Direct damage is the cost people have to spend to repair the property damaged that can be determined (quantifiable) such as repairing damaged yards, foundations, fences, equipment and damaged properties... - Indirect damage is the cost people spend to overcome the consequences caused by flooding in terms of health, reduce income, reduce revenue due to having to quit work or go to work lately / stop...

ECONOMICS - SOCIETY https://jst-haui.vn HaUI Journal of Science and Technology Vol. 60 - No. 11E (Nov 2024)
4
P
-
ISSN 1859
-
3585
E
-
ISSN 2615
-
961
9
Floods cause significant property damage in urban areas of Vietnam. Cases of property being swept away in water; furniture and items inside the home or business are damaged when flood water enters the interior; water corrodes the walls and foundations of a home or business; impact on plants. Usually, studies assessing the impact of floods in general and urban flooding in particular focus on quantifiable damages such as the cost of remediating physical damage or loss of production. Quantifiable damages are usually classified as direct damages. In addition to direct losses, economic losses due to flooding can have consequences that are difficult to determine (quantify) such as job loss, loss of income opportunities, illness, reduced productivity, etc. All types of damage caused by flooding above are considered indirect damage or intangible damage. Thus, damage caused by urban flooding is usually divided into two main categories (1) direct damage and (2) indirect damage [3]. According to Joint Circular No. 43/2015/TTLT-BNNPTNT-BKHDT of the Ministry of Agriculture and Rural Development and the Ministry of Planning and Investment, stipulating the extent of property damage caused by floods to people in the area. However, this circular only takes into account material damage (property, crops). Based on Joint Circular No. 43 above, Research by Nguyen Viet Hung et al [2] has also established a classification of economic damage caused by urban flooding. The classification of economic damage due to urban flooding is based on the ratio between the quantification of direct and indirect remedial costs and the average annual income of each object [2]. For disaster management, the assessment of the risk of economic damage is one of the most useful sources of information [4]. Specifically, in planning or making investment decisions for works and projects, damage risk information is taken into consideration [4, 5, 7, 8]. The following general formula: R = f (H, E, V) (1) Where: H is the probability of occurrence of natural phenomena in the future. It usually calculated through the frequency of occurrence (%). E is an exposure to hazard and used to refer to the presence (by location) of people, environmental services and natural resources, economic, social, cultural properties, etc., where they may be adversely affected by hazards leading to potential future harm, loss or damage. V is a vulnerability, referring to the tendency of factors that are susceptible to the impact of hazards such as people, society. Most of the formula for calculating the risk of economic damage caused by flooding is determined by two basic components, the frequency of occurrence of the agent and the degree of consequences. This is also the direction of assessing the risk of economic damage due to flooding in Ho Chi Minh City today [4]. Ho Chi Minh City - the city of urbanization, modernization and the largest population in the country along with comprehensive socio-economic development. In parallel with the development, urban flooding in the city began to appear in the 1990s and is becoming more complicated in strongly urbanized areas. According to the Centre for Technical Management of Infrastructure, Department of Construction of Ho Chi Minh City, in 2021 and the first half of 2022, Ho Chi Minh City has 46 rains with rainfall over 50mm. Of which, 18 rains caused flooding. High tide tends to be higher next year than the previous year. At the same time, the frequency of occurrence of tidal peaks is increasing. In 2021 and the first half of 2022, Ho Chi Minh City has 10 high tides, above the level II and III alarm levels. These high tides have caused partial flooding of many roads, affecting traffic and people's movement. Following the studies on assessing the extent of flooding, flood damage and economic loss risk by many domestic and foreign authors for Ho Chi Minh City, the article would like to present the results of the research on economic damage risk assessment. due to flooding for people living in District 7, a district with quite special natural conditions with large rivers and canals surrounding it. 2. METHODOLOGIES The study area is District 7, Ho Chi Minh City (HCMC) as shown in Figure 1. The steps to carry out the research are as follows: 2.1. Survey the extent of flooding and damage Survey the extent of flooding and damage caused by flooding through interviews with households. Based on the summary report of flood points in Ho Chi Minh City in 2021 and 2022 of the Centre for Technical Management of Infrastructure, HCMC Department of Construction, the research team determined the frequent flooding points and severity of flooding (an inundation point is a survey site). The number of survey points on the extent of inundation, the extent of damage was determined as a survey of 71 survey locations with 71 survey questionnaires
P-ISSN 1859-3585 E-ISSN 2615-9619 https://jst-haui.vn ECONOMICS - SOCIETY Vol. 60 - No. 11E (Nov 2024) HaUI Journal of Science and Technology
5
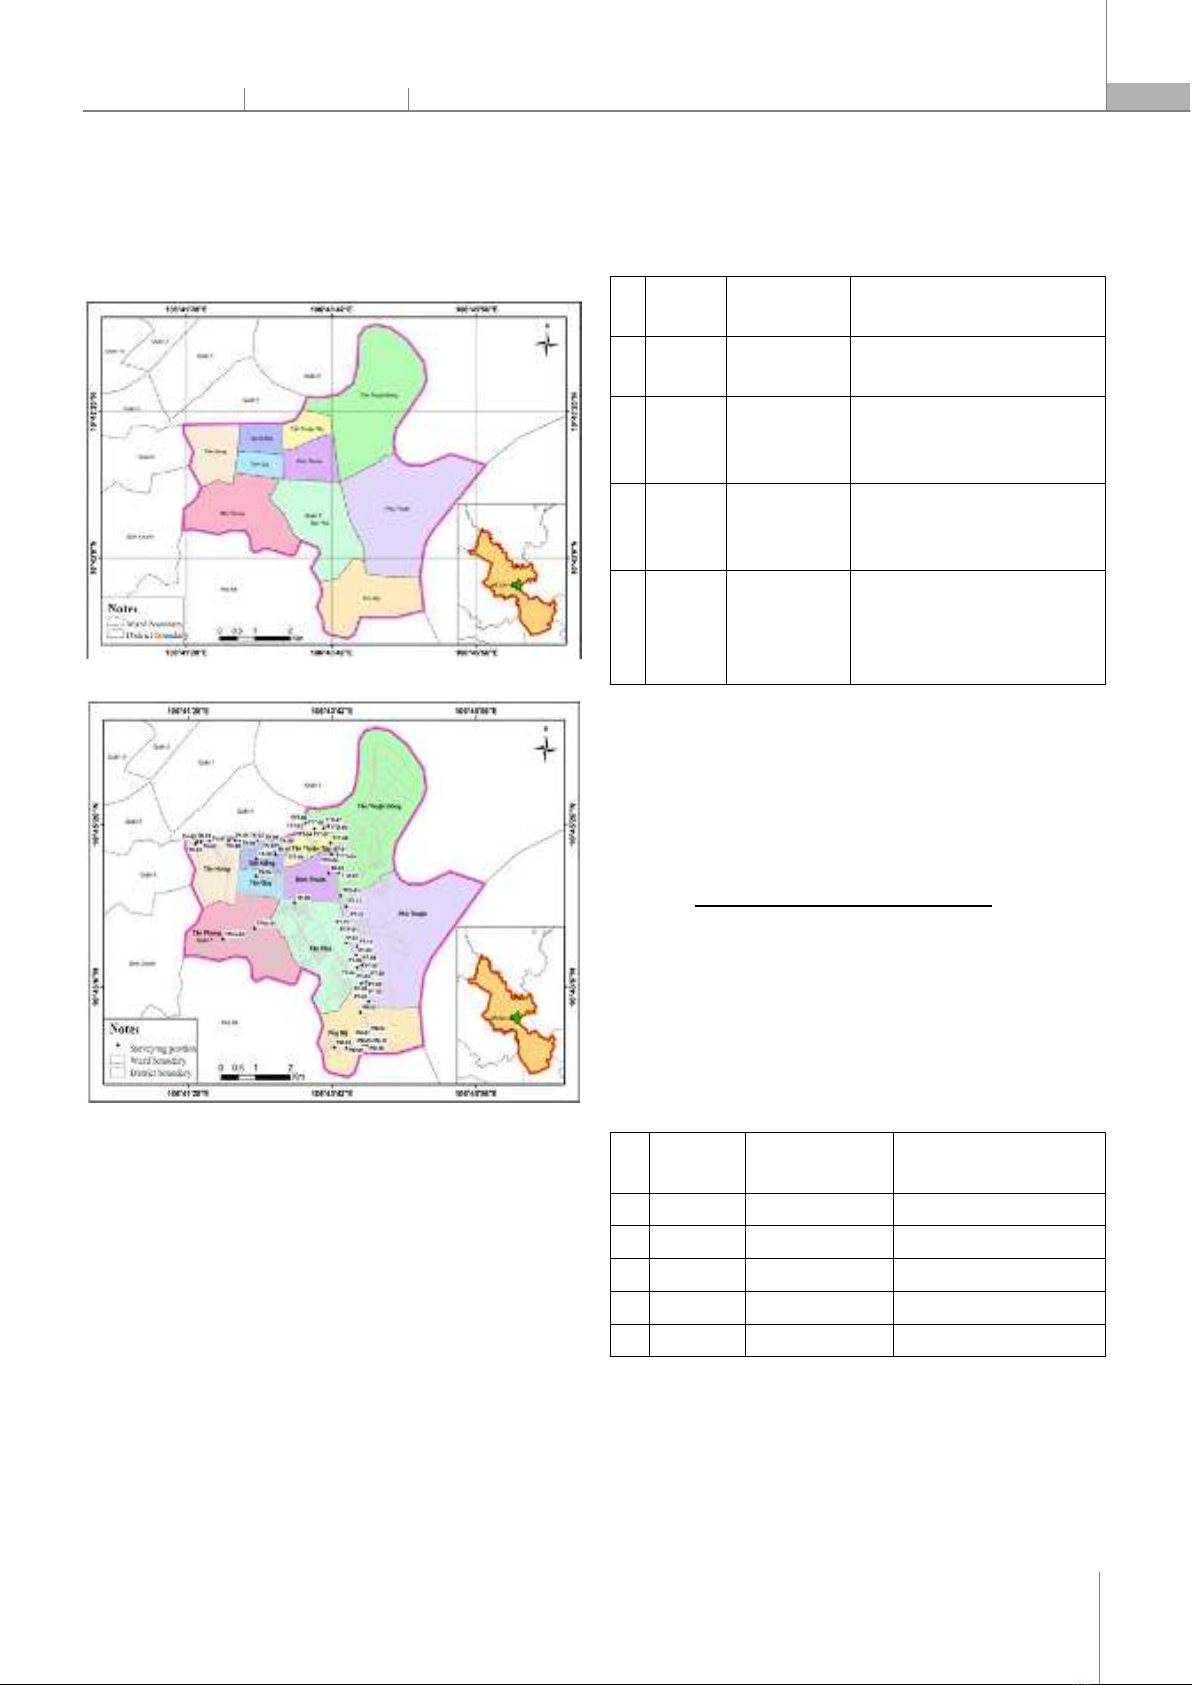
for flooding and 71 survey questionnaires for damage; In addition, the project has conducted more field surveys (recording flooded/non-flooded) for analysis, assessment and zoning. Distribution of survey sites and locations of households interviewed see Figure 2. Figure 1. Map of District 7, Ho Chi Minh City Figure 2. Locating the flood and damage survey area in District 7 2.2. Assessment of urban flooding Assessment of urban flooding is determined by the determining frequency of occurrence in order to mild, moderate and severe flooding [4] as follows: PTH (%) = Nflood /Nmax (%) (2) There are: - PTH (%) - the frequency of occurrence of urban flooding causing the damage. - Nflood - the number of occurrences of flooding at a location causing damage to residents. - Nmax - the maximum number of occurrences of flooding causing damage in the area (Nmax = 24). The classification of flooding levels by frequency of occurrence [4] as shown in the table below (See Table 1). Table 1. Classification of the frequency of occurrence of damaging urban flooding No
Flooding
level Value Meaning 1 Low P
≤
40% Corresponding to the maximum number of occurrences 10 times. 2 Middle 40% < P
≤
65%
Corresponding to 18 ooding occurrences (10 mild ooding and 8 moderate ooding). 3 High 65% < P
≤
90%
Corresponding to 21 flooding occurrences (10 mild flooding, 8 moderate flooding and 3 severe flooding). 4 Very high 90% < P
≤
100%
Corresponding to 24 occurrences of ooding (10 times of mild ooding, 8 times of moderate ooding and 6 times of severe ooding). Source: [4] 2.3. Assessment of economic damage Assessment of economic damage due to urban flooding is determined by the ratio between the total cost of overcoming consequences caused by flooding with the total annual income of households [4] as follows: C =
Total economic damage (TTH) (%)
(3)
total income (TTN) There are: - TTN: total income (VNĐ). - TTH: Total economic damage (VNĐ). The damage classification [4] as the table below (See Table 2). Table 2. Table of levels of damage caused by flooding No Damage levels Value Meaning 1 Light C
≤
15% The light damage level. 2 Middle 15% < C
≤
30% The middle damage level 3 Hard 30% < C
≤
50% The hard damage level. 4 Very hard 50% < C
≤
70% The vary hard damage level 5 Serious 70% < C
≤
100% The complete damage. Source: [4] 2.4. Risk assessment of economic damage Risk assessment of economic damage due to urban flooding. The formula for assessing urban flooding risk is described by the following formula [4]:
ECONOMICS - SOCIETY https://jst-haui.vn HaUI Journal of Science and Technology Vol. 60 - No. 11E (Nov 2024)
6
P
-
ISSN 1859
-
3585
E
-
ISSN 2615
-
961
9
= (). + (). (4) There are: - R is the risk value of economic damage caused by urban flooding. - wP and wC is the weight of the two components of flooding level and damage caused by flooding, respectively 0.473 and 0.527 [4]. Risk levels with the same classification threshold are described as Tables 3 and 4. Table 3. Table of levels of risk of economic damage due to urban flooding No
Risk levels Value Meaning 1 Low R
≤
R1 The light risk damage level. 2 Middle R1 < R
≤
R2 The middle risk damage level 3 High R2 < R
≤
R3 The hard risk damage level. 4 Very high R3 < R
≤
R4 The vary hard risk damage level 5 Serious R4 < R
≤
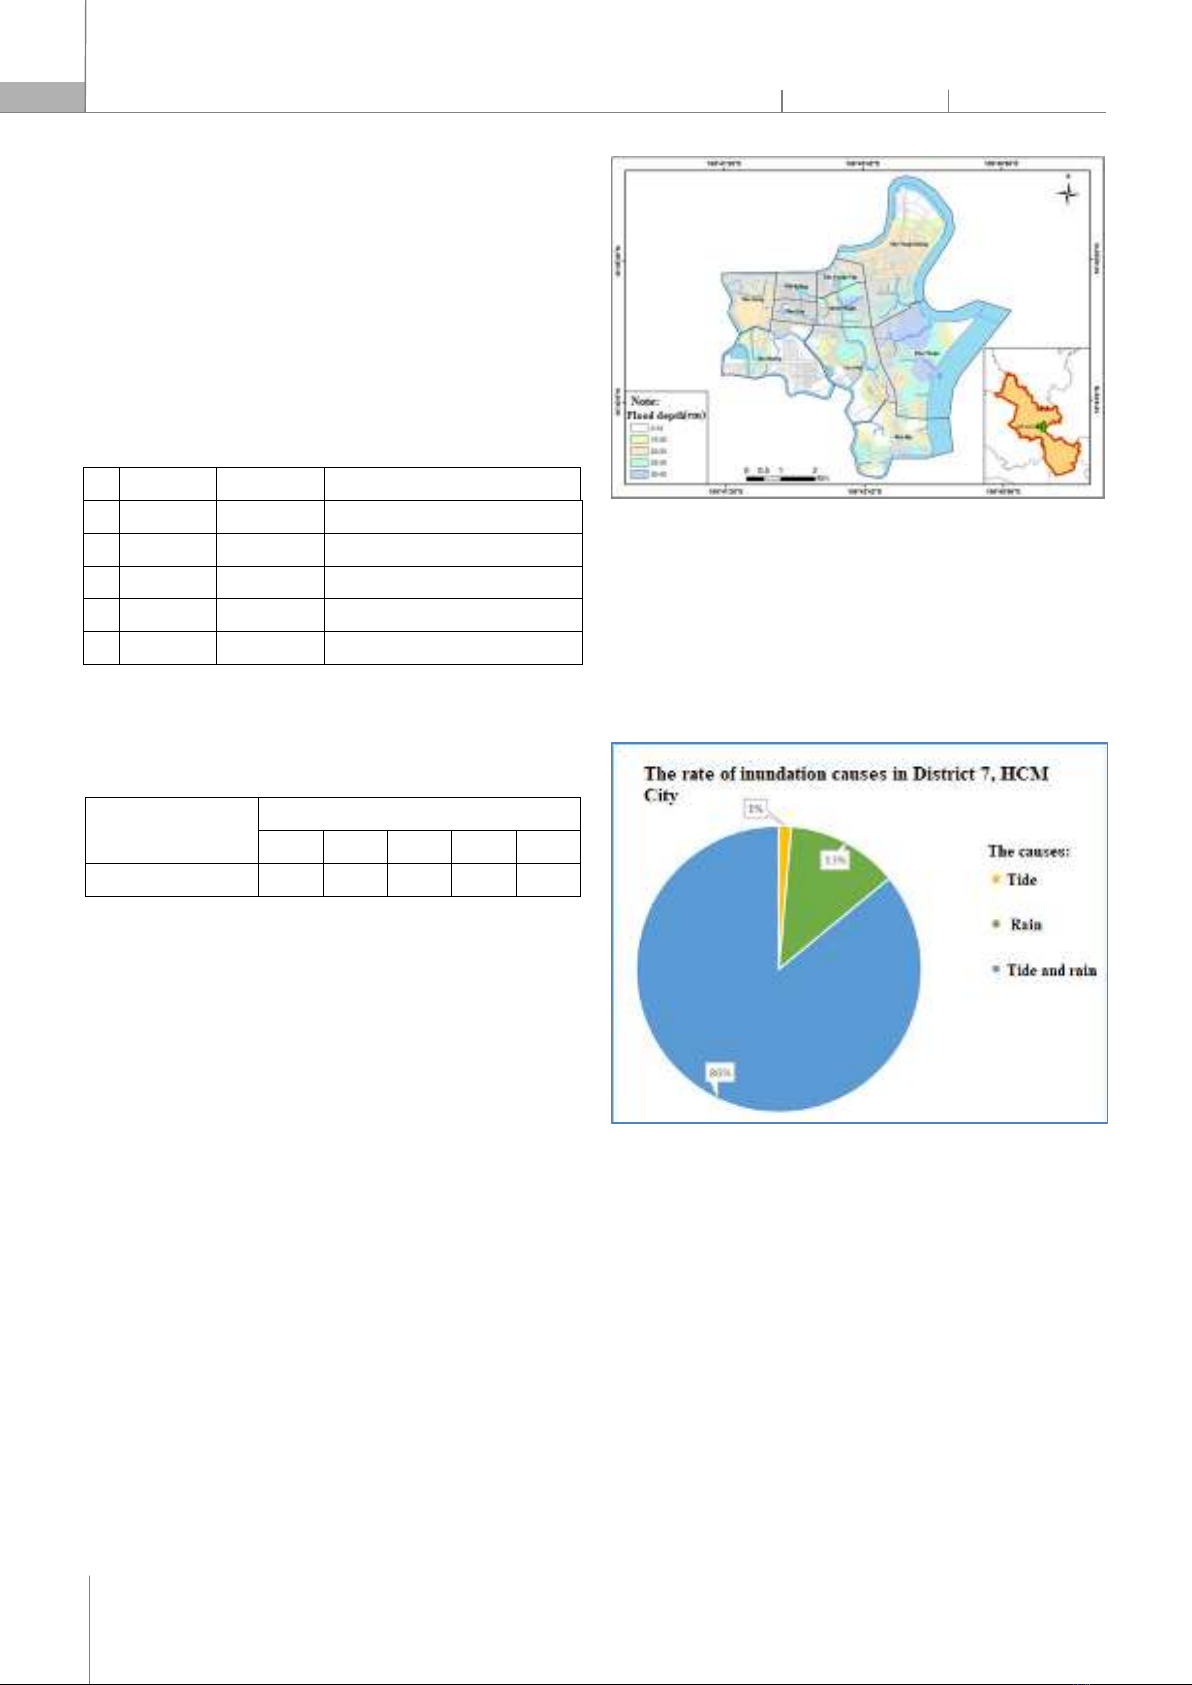
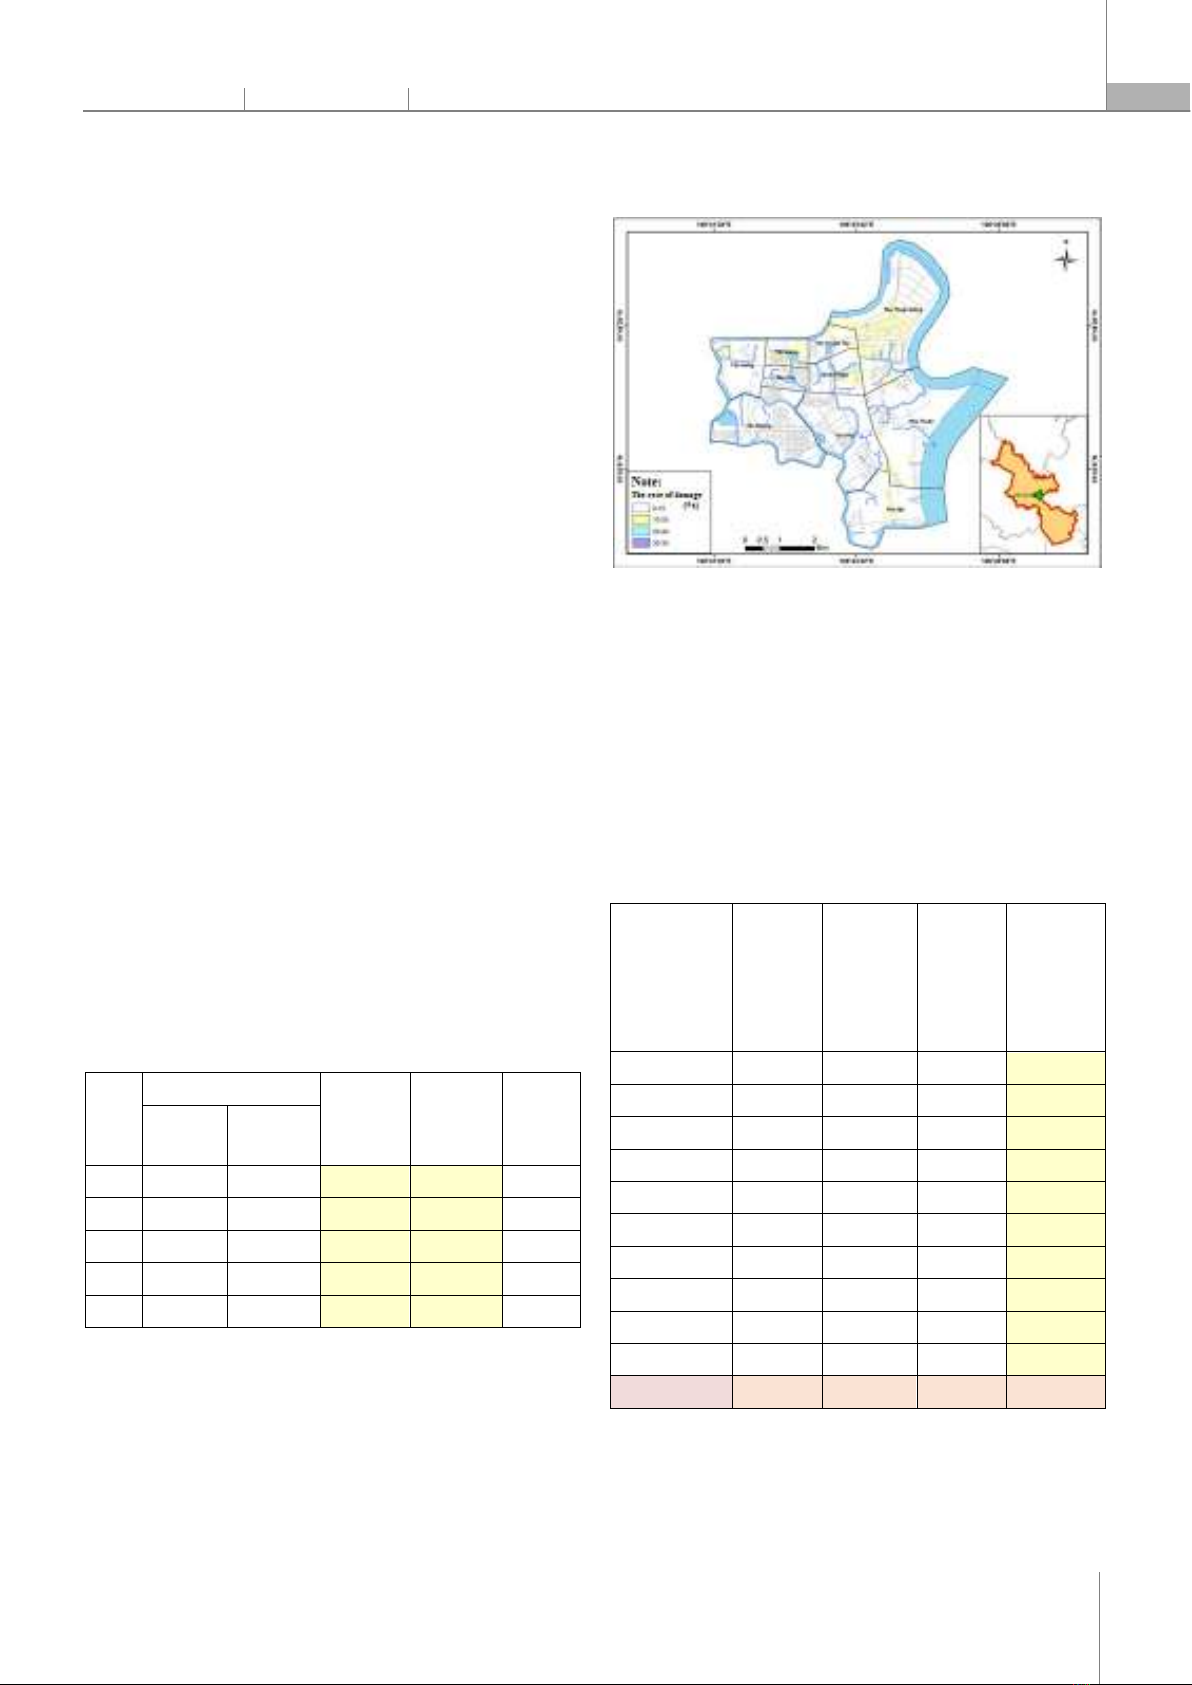
1,0 The complete damage. Source: [4] The threshold value of risk level is determined according to the Table 4 [4]. Table 4. Values of risk thresholds due to urban flooding Location Threshold values P/C (%) R1 R2 R3 R4 R5 District 7 21 39 60 78 100 Source: [4] 3. RESULTS AND DISCUSSION The survey results show that the area of District 7 is not only deeply flooded at roads such as Tran Xuan Soan, Huynh Tan Phat, but also deeply in roads such as Pham Huu Lau, Go O Mai, and Chuyen Dung Chinh. There are also typical flooded locations such as the section Le Van Luong assigned Nguyen Van Linh; Although Go O Mai and Phu Thuan intersect with Huynh Tan Phat, although these points are not flooded for a long time, they are the main roads affecting people in the area. 3.1. Summary of flood survey results and flood zoning The results from more than 70 survey questionnaires through the inundation depth parameters for 2021 - 2022 show that the average depth of flooding is about 23.38cm and the maximum depth of flooding about 45cm. Most of the surveyed areas have mild flooding frequency corresponding to 18 floods causing damage in a year. Inundated areas are identified and zoned according to the degree of depth shown in the map below (See Figure 3). Figure 3. Flood situation map in District 7, HCMC in 2021 - 2022 In addition, the during survey of current urban flooding in District 7, the problem of flood causes was also surveyed. Due to the location of District 7 surrounded by rivers and large canals, there is a high density of canals inside District 7, so the causes of flooding here are mainly tidal combined with rain (See Figure 4). Figure 4. The graph shows the percentage of causes of flooding in District 7, HCMC 3.2. Flooding often occurs in District 7 The damage to households is still inevitable. To determine the extent of damage caused by urban flooding is based on the analysing on damage types for each surveyed household. The extent of damage will be calculated based on the sum of two direct and indirect damages caused to households. There are two types of damages caused by flooding such as: - Direct damages include repair costs, clean-up costs, costs incurred due to traffic jams, business loss costs and other costs directly incurred by urban flooding.
P-ISSN 1859-3585 E-ISSN 2615-9619 https://jst-haui.vn ECONOMICS - SOCIETY Vol. 60 - No. 11E (Nov 2024) HaUI Journal of Science and Technology
7
- Indirect damages include the damages caused by urban flooding indirectly such as medical expenses, expenses due to business closures and late arrivals and absences, incident repair costs, and reduced revenue after flooding. The calculation of each kind of damage caused by flooding are such as: The repair cost = Cost of repairing floor/walls + Cost of repairing yard fence + Cost of repairing furniture and electrical equipment + Cost of repairing water pipes + Cost of repairing vehicles. Other costs directly incurred due to flooding = Cost of renting, buying new tools + Cost of damage to business goods + Cost of damage to business equipment. The clean-up cost = (Time to move assets/goods + Time to clean up after flooding) * income per 1 hour of work. The expenses incurred due to traffic jam = (Time of traffic jam*Number of times of traffic jam*Income per hour worked) + (Time late to work*Income per hour worked) + (Number of days off work due to flooding* Income per 1 working day). Other costs directly incurred due to flooding = Medical examination fee + Number of days off for sale *Income for 1 working day + Post-flood recovery cost + Reduced revenue after flooding. Statistics on damage survey results and damage levels compared to the average annual income of households in District 7 in 2021 - 2022 are as follows (See Table 5). Table 5. The damage calculation results of surveyed households in District 7, Ho Chi Minh City in 2021 - 2022 Code Coordinates Direct damage (Mill.VND)
Indirect damage (Mill.VND)
Rate of damage (C%) Lat Long TH-01 10.750889
106.693153
25 9.5 13.27 TH-02 10.751472
106.693573
15 9.5 4.71 TH-03 10.751406
106.694626
30 16.4 25.80 … … … … …. …. TTD-08
10.744410
106.730194
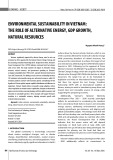
65 16.9 22.76 The most of the surveyed households have a slight damage rate (C 15%), the household with the smallest damage is 1.82% (C = 1.82%). In which, only 11/71 households have moderate damage rate (15% < C 30%) and 1/71 households have high damage rate in the range 30% < C 50% (C = 35%). Zoning economic damage caused by flooding according to the levels as below (See Figure 5). Figure 5. The damage caused by flooding compared with annual income in District 7, HCMC in 2021 - 2022 3.3. Assessing the risk of economic damage due to flooding in District 7 in the period of 2021 - 2022 From the survey results and analysis of flooding levels, economic damage due to flooding of households in District 7, apply formulas No 1 and 2 to calculate the frequency of urban flooding and the economic loss ratio is as follows (See Table 6). Table 6. Table of flooding frequency by ward in District 7, HCMC in 2021 - 2022 Name of wards
Light ooding frequency % (PLight) Middle ooding frequency % (PMiddle) Hard ooding frequency % (PHard) General ooding frequency (P%) Tan Hung 62.9 18.5 18.5 12.1 Tan Kieng 56.2 31.2 12.5 11.4 Tan Thuan Tay 48.4 29.6 21.8 13.3 Tan Phong 61.9 28.5 9.5 10.7 Tan Quy 66.6 16.6 16.6 11.6 Binh Thuan 52.6 33.3 14.0 11.8 Tan Phu 68.4 18.0 13.5 11.1 Phu My 51.8 30.7 17.3 12.4 Phu Thuan 49.5 33.1 17.3 12.5 Tan Thuan Dong 63.6 26.0 10.3 10.8 District 7 58.2 26.5 15.1 11.8 Besides, from the calculation of the damage rate for each household in District 7, the average of the damage rate for each ward in the district is calculated (See Table 7).


![240 câu hỏi trắc nghiệm Kinh tế vĩ mô [chuẩn nhất]](https://cdn.tailieu.vn/images/document/thumbnail/2026/20260126/hoaphuong0906/135x160/51471769415801.jpg)

![Câu hỏi ôn tập Kinh tế môi trường: Tổng hợp [mới nhất/chuẩn nhất]](https://cdn.tailieu.vn/images/document/thumbnail/2025/20251223/hoaphuong0906/135x160/56451769158974.jpg)


![Giáo trình Kinh tế quản lý [Chuẩn Nhất/Tốt Nhất/Chi Tiết]](https://cdn.tailieu.vn/images/document/thumbnail/2026/20260122/lionelmessi01/135x160/91721769078167.jpg)


