
Journal of Development and Integration, No. 78 (2024)
86
K E Y W O R D S A B S T R A C T
ADASYN,
Banking sector,
Customer churn,
Random Forest,
SMOTE.
Customer Churn is now becoming a significant problem in the banking sector. It is necessary
to seek solutions to predict the rate of customer churn in banks; however, the dataset for
customer churn prediction in banks is imbalanced. In this paper, Random Forest (RF)
based on two popular resampling techniques, named SMOTE and ADASYN, are used to
obtain a banking customer churn prediction model. A wide range of metrics, including
Accuracy, Recall, Precision, Specificity, F1 score, Mathews correlation coefficient, and
ROC-AUC, are used to comprehensively evaluate the prediction model. Through the
experimental results, the values of Accuracy and ROC-AUC of the RF model based on
SMOTE and ADASYN indicate positive results. Moreover, this paper also shows feature
importance in the dataset based on the RF algorithm.
Banking customer churn prediction using Random Forest
based on SMOTE and ADASYN approach
Tran Thanh Cong *
Ho Chi Minh City University of Economics and Finance, Vietnam
* Corresponding author. Email: congtt@uef.edu.vn
https://doi.org/10.61602/jdi.2024.78.11
Received: 26-Feb-24; Revised: 08-Apr-24; Accepted: 22-Apr-24; Online: 26-Jul-24
ISSN (print): 1859-428X, ISSN (online): 2815-6234
1. Introduction
It is true that increasing customer satisfaction
is one of the most important purposes of banks
worldwide. These days, customers tend to adopt
new technologies in many aspects of their lives,
including banking services. This leads to a high
level of competition between banks to retain their
customers. Therefore, many banks in the world need
to seek a lot of ways to limit the rate of customer
churn. Customer churn is defined as the leaving of
customers who are currently using these banking
services to use the services of other banking
competitors. Today, the problem of customer
churn in banks has become increasingly common.
Numerous studies have shown that eliminating
customer churn could save a huge amount of money
because obtaining new customers normally costs
up to five times as much as satisfying and retaining
existing ones (Sharma & Kumar Panigrahi, 2011).
Consequently, in order to avoid churn of customers,
the banks have invested in establishing customer
relationship management systems to collect data,
analyze customer behaviors, and suggest customer
retention techniques (De Lima Lemos et al.,
2022).
However, there are several challenges to
identifying churn in the banking sector. Firstly,
there are a million customers currently using bank
services in large banks, particularly international
banks, so it is time-consuming to adequately collect
dataset, and collecting dataset is not synthesized
No. 78 (2024) 86-91 I jdi.uef.edu.vn

87
Journal of Development and Integration, No. 78 (2024)
Tran Thanh Cong
well. Secondly, the banks might not have the ability
to adapt promptly to changes in customer needs.
Thirdly, identifying customer patterns manually
is still challenging for banking staff, although
banks segment customers across local managers.
Therefore, it is important to shift from traditional
approaches to state-of-the-art approaches, such as
applications of machine learning (ML) algorithms,
to analyze customer behaviours and find solutions
to prevent customer churn.
This research studies the behavior of a
representative dataset of 10,000 clients obtained
from Kaggle so as to create a churn predictive
model through a Random Forest (RF) algorithm
based on two popular resampling techniques,
i.e., SMOTE and ADASYN. The performance
of the banking customer churn prediction model
is evaluated through a variety of metrics, such as
Accuracy, Recall, Precision, Specificity, F1 score,
Mathews correlation coefficient, and ROC-AUC.
Additionally, the features sorted from the most
important to the least important are also identified
through the RF algorithm.
The structure of this paper is as follows: The
literature review is covered in Section 2. The
methodology is shown in Section 3. The results
of this study are presented in Section 4. Section 5
presents the conclusion.
2. Literature review
A variety of ML algorithms, consisting of
Decision Tree (DT), Random Forest (RF),
K-Nearest Neighbour (KNN), Logistic Regression
(LR), and Support Vector Machines (SVM), have
been proposed by various researchers for customer
churn prediction over the past decades.
In (Villamosm et al., 2020), ML techniques such
as KNN, SVM, DT, and RF were used to predict
customer churn in banks. Based on the dataset of
10000 bank clients obtained from Kaggle, this
study analyzed customer behavior to explore the
ability of churn. In order to increase the accuracy
of ML models, some feature selection approaches
were implemented to identify the relevant features.
The result of the RF model, which relied on the
oversampling method, had a better accuracy index
than other models.
In (Dias et al., 2020), six different approaches,
including RF, SVM, Stochastic Boosting (SB),
LR, Regression Trees (CART), and Multivariate
Adaptive Regression Splines (MARS) were used to
anticipate churn in the retail banking. This research
developed a methodological framework that has
the ability to anticipate both which customers
stop using banking services and when they stop
it through a future horizon of six months. This
research indicated that SB proves its effectiveness
compared to other approaches based on the dataset
of more than 130 000 customers of a retail bank.
Additionally, this research also demonstrated that,
during a one- to two-month period, two variables—
the total value of bank products held in the previous
months and the presence of debit or credit cards in
another bank—have a favorable impact on churn
prediction. However, during a period of three to
four months, two additional variables—the quantity
of transactions in recent months and the presence
of a mortgage loan outside the bank—played a
significant influence in churn prediction.
In (Lalwani et al., 2022), different approaches,
which are LR, naive bayes, SVM, RF, DT,
and boosting and ensemble techniques, were
employed to predict customer churn based
on a telecommunications dataset. This study
proposed a framework consisting of six phases,
i.e., data pre-processing, feature analysis, feature
selection, splitting process, prediction process, and
validation. In this study, among the aforementioned
approaches, Adaboost and XGboost Classifier had
the highest outcomes in terms of accuracy and
AUC score.
A machine learning (ML) based churn prediction
model was created in (Ahmad et al., 2019) to help
telecom carriers anticipate which customers are
most likely to discontinue their services. This
model was developed using a large data platform
and a novel method for feature engineering and
selection. The performance of the ML model was
assessed using the area under the ROC curve
(AUC) value.
These articles mentioned above did not
consider the problem of an imbalanced dataset
when predicting banking customer churn. In this
paper, we want to concentrate on addressing the
problem of an imbalanced dataset using the RF
algorithm based on SMOTE and ADASYN when
creating customer churn prediction in the banking
sector. Through the RF algorithm, ranking the
features of the dataset that have the most to the
Journal of Development and Integration, No. 78 (2024)
88
least contribution to the prediction model is also
indicated in this article.
3. Methodology
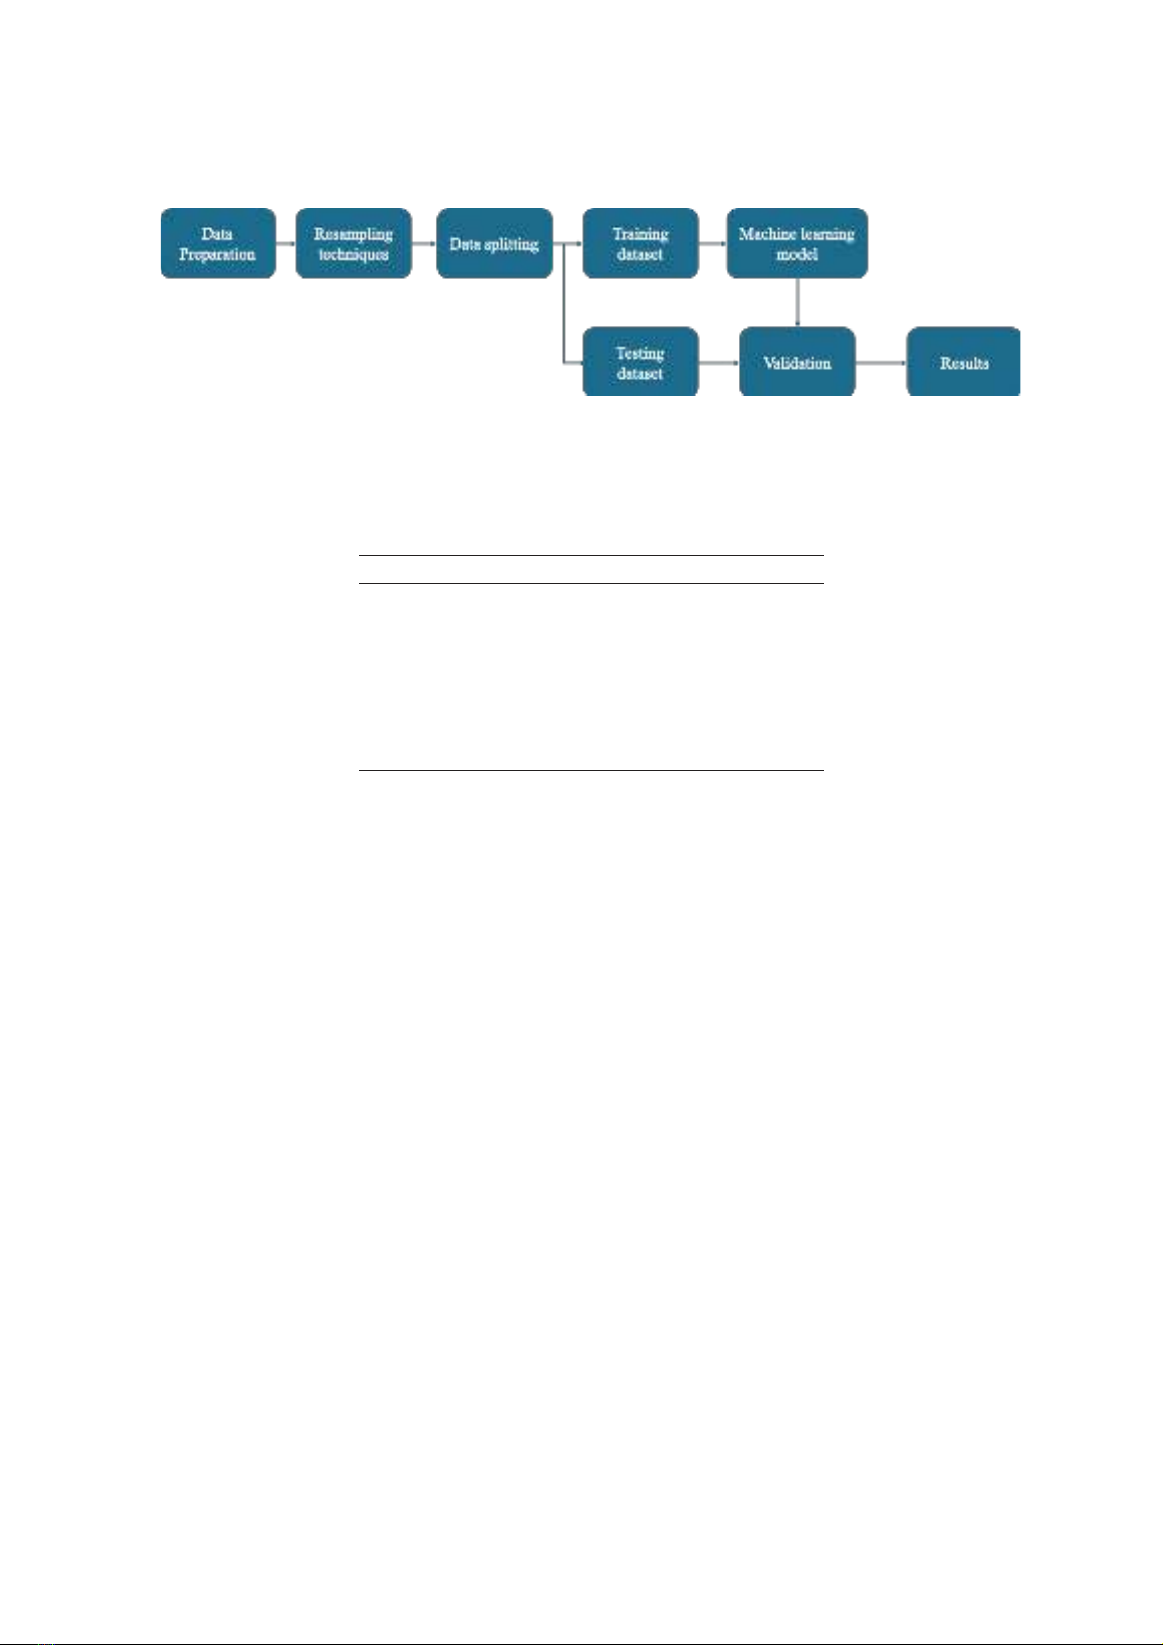
Figure 1 in this paper illustrates the research
methodology for predicting baking customer churn.
There are several steps indicated in Figure 1. Data
preparation is the very first step in the pipeline. As
the dataset is imbalanced, resampling techniques
such as SMOTE and ADASYN are applied in order
to obtain a balanced dataset. Next, data splitting
is implemented into training and testing datasets.
A machine learning model is created based on the
training dataset, and the testing dataset is used
to validate the machine learning model. Various
evaluation metrics to validate the machine learning
model are illustrated in Section 3.3.
3.1. Random forest algorithm
Among the popular algorithms for supervised
learning is RF. Regression and classification issues
both make use of RF. RF is a group method that uses
different kinds of decision trees. When the number
of trees in the forest is considerably increasing, RF
shows superior results and keeps the model from
becoming overfit. Every decision tree in the forest
produces a result, and these findings are combined
to produce forecasts that are more reliable and
accurate (Dang et al., 2021).
3.2. Dataset
The dataset used in this paper is based on Kaggle.
The dataset consists of 13 features (row number,
customerid, surname, creditstore, geography,
gender, age, tenure, balance, numberofproducts,
hascrcard, isactivemember and estimatedsalary)
and one label column, including Class 0 and Class
1, which indicate customer churn or not.
We can determine that the dataset in question is
skewed based on Table 1. Class 0’s number is 7963,
and class 1’s number is 2037. This indicates that
there are roughly 2037 clients who do not transact
with the bank and about 7963 customers who do.
Resampling approaches such as algorithm level,
data level, cost-sensitive learning, and ensemble-
based are used to increase the accuracy of the
RF model (Fernández et al., 2018). Two popular
resampling methods—SMOTE and ADASYN—are
employed in this study to address the unbalanced
Figure 1. Research methodology pipeline
Descriptions Details
Number of columns 13
Labels Class 0 and Class 1
Number of rows 10000
Feature type float64(2), int64(9), object (3)
Missing values None
Customer churn Class 0 7963
Class 1 2037
Table 1. Data description
Tran Thanh Cong

89
Journal of Development and Integration, No. 78 (2024)
dataset. These methods are widely used and have
proven successful in resolving imbalanced datasets
in a variety of applications (Li et al., 2014), (Tran
& Dang, 2021).
3.3. Evaluation metrics of machine learning
model
This work considers a number of evaluation
metrics, including the Confusion Matrix (CF),
Accuracy, Recall, Precision, Specificity, F1 score,
Mathews correlation coefficient (MCC), and ROC-
AUC, in order to completely assess the performance
of the ML model. One of the key measures for
comprehending the performance of an ML model
is CF. In CF, which is displayed in Table 2, true
positive (TP), true negative (TN), false positive
(FP), and false negative (FN) are indicated.
One of the most commonly used measures for
assessing an ML model’s performance is accuracy.
As demonstrated in (1), accuracy is computed by
dividing the number of correctly classified samples
by the total number of samples.
Accuracy = (TP + TN)/(TP + TN + FP + FN)
(1)
As stated in (2), recall is the percentage of
positively categorized samples that are correctly
classified out of all positively and negatively
forecasted samples.
Recall = TP / (TP + FN) (2)
As shown in (3), precision is determined by
Actual Values
Predicted Values
Class Negative (0) Positive (1)
Negative (0) TN FP
Positive (1) FN TP
Range of AUC values Model Performance
0.9 – 1.0 Excellent
0.8 – 0.9 Very good
0.7 – 0.8 Good
0.6 – 0.7 Fair
0.5 – 0.6 Poor
Table 2. Confusion matrix
Table 3. AUC Performance
dividing the number of correctly categorized
positive samples by the total number of positively
anticipated samples.
Precision = TP / (TP + FP) (3)
According to (4), specificity is determined
between negative samples correctly classified and
the total of positive predicted samples and negative
predicted samples.
Specificity = TN / (TN + FP) (4)
According to (5), the F1 measure is the harmonic
mean of recall and precision. There is a range from
0 to 1 in F1 score. It means that the high values
indicate good classification performance.
F1 = 2 * (Precision * Recall) / (Precision +
Recall) (5)
MCC indicates in (6) is the Pearson product-
moment correlation coefficient between the results
of prediction and actual values, expressed as a
contingency matrix way of computation. The issue
of the imbalanced dataset has no effect on MCC.
Tran Thanh Cong
The ROC curve is a visual assessment. Given
that the taxonomic thresholds of the binary
classification systems differ; this curve illustrates
the diagnostic potential of the system. The ratio of
TP to FP rates is plotted to create the ROC curve.
AUC measures the complete two-dimensional area
(6)
Journal of Development and Integration, No. 78 (2024)
90
under the whole ROC curve. AUC uses the total
performance of ML models to evaluate them. In
Table 3, this performance is displayed.
4. Results
The results of the evaluation metrics of RF based
on SMOTE and ADASYN, including of Accuracy,
Precision, F1-score, ROC_AUC, and MCC score,
are shown in Table 4. Overall, the values of these
metrics of RF based on SMOTE and ADASYN are
similar. Accuracy and ROC_AUC values of RF
based on SMOTE and ADASYN are high, while
Precision, Recall, F1-score, MCC score quite
low. This is because the dataset is insufficiently
collected, and the pre-processing dataset is not
optimized when implemented. However, this paper
uses diverse metrics to comprehensively evaluate
machine learning models, particularly RF based on
SMOTE and ADASYN.
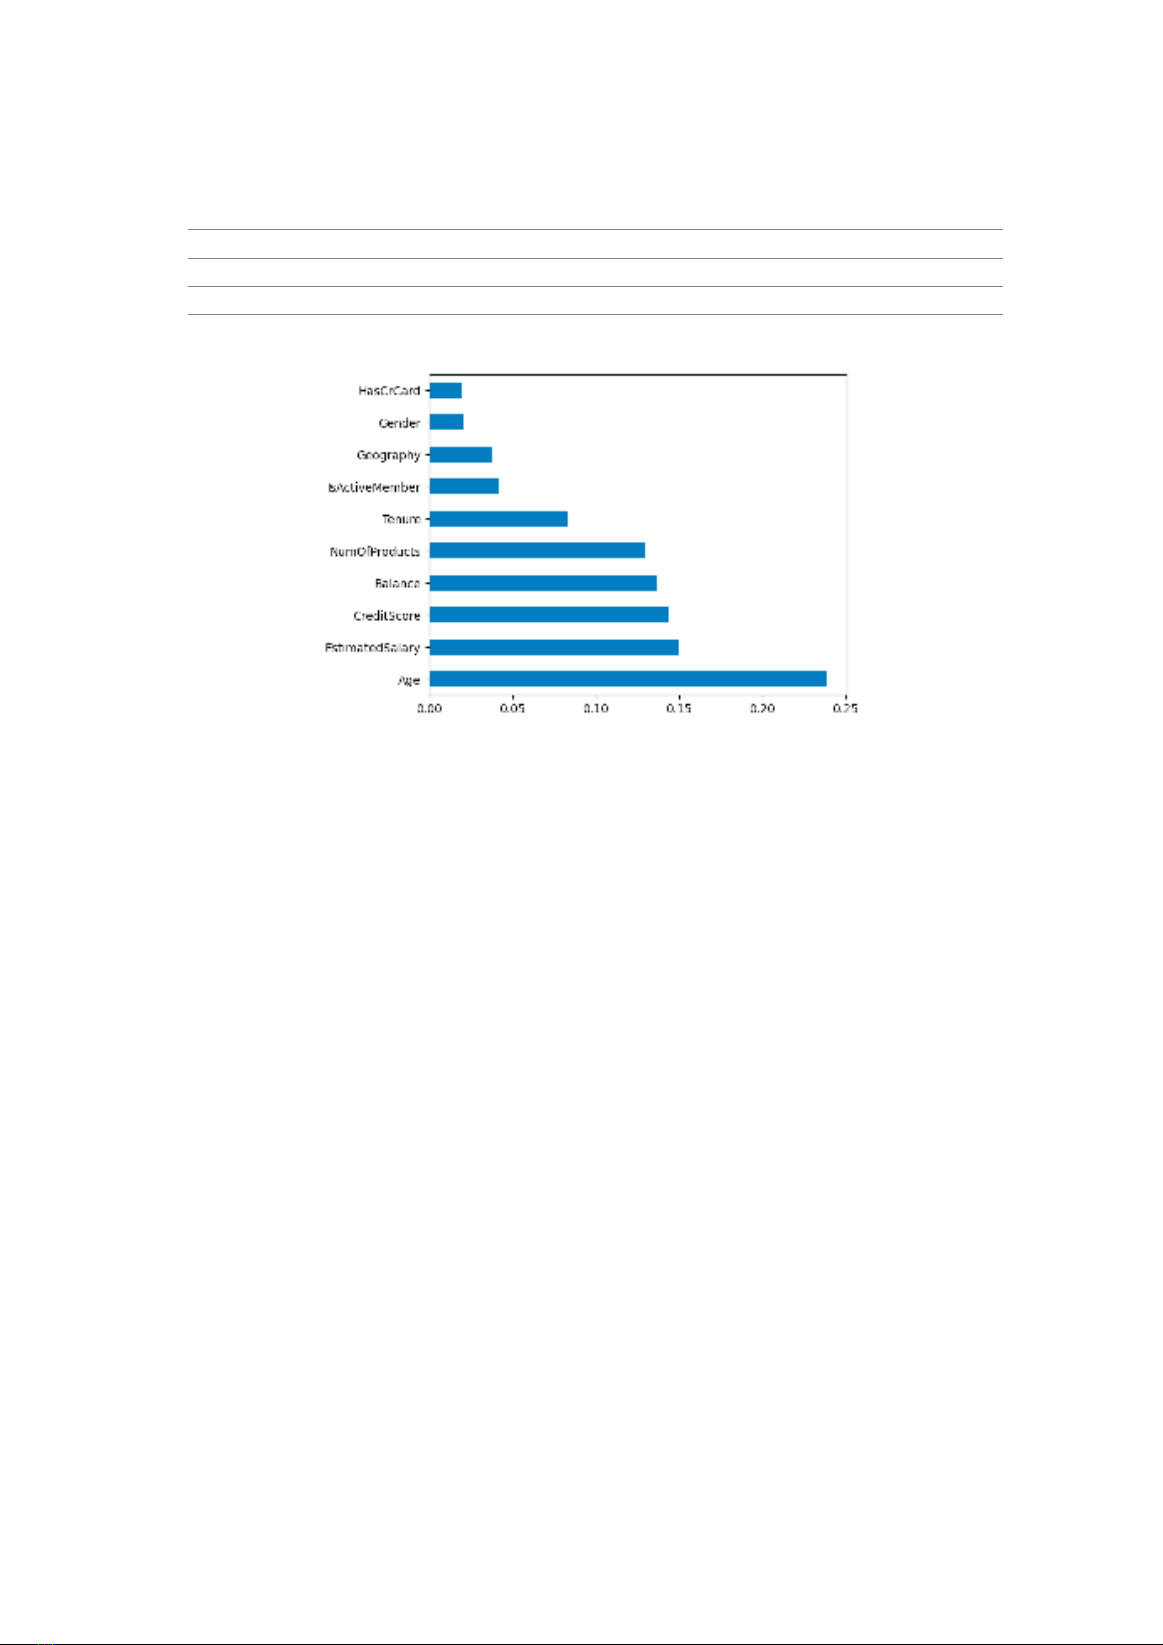
Additionally, as shown in Figure 2, this paper
also identifies feature importance relied on the
RF algorithm. To be more specific, Age is the
most significant feature affecting the customer
churn prediction model, whereas Hascrcard is
the least significant feature affecting this model.
EstimatedSalary, CreditScore, Balance are
important features used to predict customer churn.
5. Conclusion and future work
In this paper, we use the RF algorithm based
on two popular resampling techniques, such as
SMOTE and ADASYN, to create a prediction
model of banking customer churn based on
the imbalanced dataset obtained from Kaggle.
Various evaluated metrics, including Accuracy,
Recall, Precision, Specificity, F1 score, MCC
and ROC-AUC are used to measure the banking
customer churn prediction model in order to have
a comprehensive evaluation. This article indicates
the results of all evaluation metrics, as determined
through our experiments. However, among these
evaluation metrics, only Accuracy and ROC-AUC
show positive results based on the mentioned
dataset. Moreover, so as to help banks analyze
which features affected customer churn most, this
article also ranks features of the dataset from the
highest scores to the lowest scores. Based on this
analysis, banks have appropriate strategies to retain
their customers.
In the future, the performance of the banking
Accuracy Precision Recall F1-score ROC_AUC MCC score
RF based on SMOTE 0.82 0.55 0.66 0.6 0.75 0.49
RF based on ADASYN 0.82 0.55 0.65 0.59 0.76 0.48
Table 4. Results of evaluation metrics
Figure 2. List of features from the most to the least contribution to ML model
Tran Thanh Cong


![Ngân hàng câu hỏi trắc nghiệm Lý thuyết Tài chính - Tiền tệ: Học phần [Mô tả thêm về nội dung học phần nếu có]](https://cdn.tailieu.vn/images/document/thumbnail/2025/20251003/kimphuong1001/135x160/26991759476043.jpg)

![Bài tập Tài chính doanh nghiệp có đáp án [kèm lời giải chi tiết]](https://cdn.tailieu.vn/images/document/thumbnail/2025/20250927/aimy1105nd@gmail.com/135x160/92021759119232.jpg)