
Hindawi Publishing Corporation
EURASIP Journal on Wireless Communications and Networking
Volume 2006, Article ID 31467, Pages 1–10
DOI 10.1155/WCN/2006/31467
On the Geometrical Characteristics of Three-Dimensional
Wireless Ad Hoc Networks and Their Applications
Guansheng Li, Pingyi Fan, and Kai Cai
Department of Electronic Engineering, Tsinghua University, Beijing 100084, China
Received 13 June 2005; Revised 29 August 2005; Accepted 12 December 2005
Recommended for Publication by Yang Xiao
In a wireless ad hoc network, messages are transmitted, received, and forwarded in a finite geometrical region and the transmission
of messages is highly dependent on the locations of the nodes. Therefore the study of geometrical relationship between nodes in
wireless ad hoc networks is of fundamental importance in the network architecture design and performance evaluation. However,
most previous works concentrated on the networks deployed in the two-dimensional region or in the infinite three-dimensional
space, while in many cases wireless ad hoc networks are deployed in the finite three-dimensional space. In this paper, we analyze
the geometrical characteristics of the three-dimensional wireless ad hoc network in a finite space in the framework of random
graph and deduce an expression to calculate the distance probability distribution between network nodes that are independently
and uniformly distributed in a finite cuboid space. Based on the theoretical result, we present some meaningful results on the finite
three-dimensional network performance, including the node degree and the max-flow capacity. Furthermore, we investigate some
approximation properties of the distance probability distribution function derived in the paper.
Copyright © 2006 Guansheng Li et al. This is an open access article distributed under the Creative Commons Attribution License,
which permits unrestricted use, distribution, and reproduction in any medium, provided the original work is properly cited.
1. INTRODUCTION
A wireless ad hoc network can be considered as one consist-
ing of a collection of nodes, and the relationship between
them is peer to peer. That is to say, it adopts a non central-
ized and self-organized structure. On the one hand, in con-
trast to other networks, all the nodes in wireless ad hoc net-
works can transmit, receive, and forward messages, thus it
does not require supports of the backbone networks. These
characteristics make it superior to those schemes requiring
infrastructure supports in respect of fast deploying at rela-
tively low cost. Thereby, it may be especially useful in battle-
field, disaster relief, scientific exploration, and so forth. On
the other hand, the locations of nodes are random, which
makesitmoredifficult to analyze the performance of wire-
less ad hoc networks.
Generally, wireless ad hoc networks can be modelled in
the framework of random graph. Nodes and links of a net-
workareconsideredasverticesandedgesofarandomgraph
G(V,E), respectively, where Vis the set of vertices, each with
a random location, and Eis the set of existing edges between
vertices. In the symmetrical case, all nodes of the network are
assumed to have the same transmission power and thus the
same covering radius R, which is determined by the inverse
power law model of attenuation and a predetermined thresh-
old of power level for successful reception [1], that is,
P0R
d0−n
=Pthreshold,(1)
where P0is the power received at a close-in reference point
in the far-field region of the antenna at a small distance d0
from the transmitting antenna and nis the path loses com-
ponent depending on the environment. In the model, there
exists an edge (or a link) between node sand node tif the
distance between them d(s,t) is not larger than the covering
radius R(Figure 1). Both Ramamoorthy et al. [2]andLi[3]
adopted such kind of models, called random symmetric pla-
nar point graph and random geometric graph, respectively.
Further studies go along in the framework of random graph
theory. For example, Li [3] studied network connectivity and
Ramamoorthy et al. [2] studied max-flow capacity analysis of
network coding. The random graph model provides a mean-
ingful framework for analyzing the wireless ad hoc network,
especiallywhenitstopologyisrandom.
It is obvious that the distance d(s,t)betweennodessand
tin the wireless ad hoc network is of great importance for
further investigations. According to the model above, d(s,t)
determines whether two randomly chosen nodes sand tare

2 EURASIP Journal on Wireless Communications and Networking
Figure 1: Random graph model of wireless ad hoc network.
able to communicate with each other directly with a given
covering radius, and it also determines the characteristics
of the whole network, such as the network topology and
the max-flow capacity. Moreover, in their landmark paper,
Gupta and Kumar [4] took into account the distance be-
tween the source and terminal of messages in measuring the
transport capacity of wireless networks. Since the probabil-
ity distribution gives a relatively thorough description of a
random variable, in [5], we analyzed the distance probabil-
ity distribution between nodes in the finite two-dimensional
region under the assumption that they are independent and
uniformly distributed, and presented the results for the rect-
angular region and the hexagonal region. In this paper, we
will study the case of the finite three-dimensional wireless
networks, which represents a wide category of practical net-
works, such as those deployed in the air space, in a building,
or in other three-dimensional sensor networks. A formula to
calculate the distance probability distribution between nodes
in a finite cuboid space is deduced.
The node degree, defined as the number of a node’s
neighbors with which the node can communicate directly
without relay, is an important measure of network. It de-
scribes local connectivity and also influences global prop-
erties. For networks in the infinite two-dimensional region,
based on the inverse power law model of attenuation with
lognormal shadowing fading, Orriss and Barton [6]proved
that the number of audible stations of a station, correspond-
ing to the node degree in this paper, obeys the Poisson dis-
tribution. This also comprehends the special case of random
graph model above, which does not allow random shadow-
ing. Verdone [7] extended the discussion to the infinite three-
dimensional space and got the same conclusion. However,
there are many differences between networks in the finite
space and those in the infinite space due to the edge effect
of the finite region [2]. For a wireless ad hoc network in
the finite two-dimensional region, we presented, in [5], that
the probability distribution of node degree is much more
Yb
Bd(A,B)
a
A
Rt
Z
0
r
S(t,A,R)
X
1
Figure 2: Illustration for the three-dimensional cuboid space.
complicated, even in the absence of random shadowing. In
this paper, we will extend the result in [5] to the finite three-
dimensional network.
The max-flow capacity of a network [8] is another im-
portant performance measure and is the upper bound of
transmission capacity of a network. In the single-source
single-terminal transmission, Ahuja et al. [9] proved that the
max-flow capacity between the source node and the termi-
nal node can be achieved only by routing. And in the single-
source multiple-terminal transmissions, Ahlswede et al. [10]
andLietal.[11] showed that the global max-flow capac-
ity, which is the minimum of the max-flows between each
pair of source and terminal, can be achieved by applying net-
work coding. Ramamoorthy et al. [2] investigated the ca-
pacity of network coding for random networks by studying
the relationship between max-flow capacity of network and
the probability of links’ existence in random networks in a
unit square region. In this paper, based on the random graph
model, we will present further results on the max-flow capac-
ity of the three-dimensional networks in a finite space, under
the assumption that each link has unit capacity.
The rest of this paper is organized as follows. In Section 2,
we deduce the distance probability distribution function be-
tween nodes that are independent and uniformly distributed
in cuboid space. Then, on the basis of the distribution func-
tion, some meaningful results on the wireless ad hoc network
characteristics are presented, including the node degree in
Section 3 and the max-flow capacity in Section 4.Somenu-
merical results are presented in Section 5 on the approxima-
tion property of the distance probability distribution func-
tion. Finally, we conclude the paper in Section 6.
2. DISTANCE PROBABILITY DISTRIBUTION
BETWEEN NODES IN CUBOID SPACE
As mentioned in Section 1, the study of the distance prob-
ability distribution is of great importance for further study.
In this section, we discuss the probability distribution of dis-
tance between nodes in a cuboid space under the assumption
that all nodes are independent and uniformly distributed in
the space.
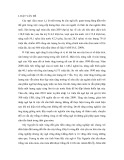
As shown in Figure 2,letAand Bdenote two arbitrary
nodes in cuboid space Cof a×1×b(a≤1≤b). The distance
between Aand Bis denoted by d(A,B) and its probability
distribution by F(R)=P(d(A,B)≤R). In [5], we presented

Guansheng Li et al. 3
the probability distribution of distance between nodes in the
rectangular region, which is the basis for the discussion of the
three-dimensional case. The results in [5] is as follows.
Theorem 1. Let A′and B′be two points which are indepen-
dent and uniformly distributed in a 1×b(1 ≤b)rectangular
region. Then the probability distribution function of distance
between A′and B′,thatis, f(r)=P(d(A′,B′)≤r),is
f(r)=EA′S(A′,r)
S,(2)
or equivalently
EA′S(A′,r)=S×f(r), (3)
where S=1×bdenotes the area of the rectangular region,
S(A′,r)denotes the area where Disc(A′,r)and the rectangular
region overlap, where Disc(A′,r)represents a disc with radius
rand center A′,andEA′[S(A′,r)] denotes the expectation of
S(A′,r)in location of A′. Further, the expression of f(r)is as
follows:
f(r)=
⎧
⎪
⎪
⎪
⎪
⎪
⎪
⎪
⎪
⎪
⎪
⎪
⎪
⎪
⎪
⎪
⎪
⎪
⎪
⎪
⎪
⎨
⎪
⎪
⎪
⎪
⎪
⎪
⎪
⎪
⎪
⎪
⎪
⎪
⎪
⎪
⎪
⎪
⎪
⎪
⎪
⎪
⎩
f1(r)=πr2
b−4(b+1)r3
3b2+r4
2b2,0≤r<1,
f2(r)=bπ −1
b2r2−2r2
barccos 1
r+22r2+1
3b√r2−1−4
3br3+1
6b2,1≤r<b,
f3(r)=πr2
b−2r2
barccos b
r+arccos1
r+22r2+1
3b√r2−1
+22r2+b2
3b2√r2−b2−r4
2b2−b2+1
b2r2+b4+1
6b2,b≤r<√b2+1,
f4(r)=1, r≥√b2+1.
(4)
Now come back to the three-dimensional case. First, let A
be settled and Buniformly distributed in the cuboid space C,
as shown in Figure 2. Let Sphere(A,R) denote a sphere with
center Aand radius R,andV(A,R) denote the volume of
the space where Sphere(A,R) and the cuboid space Cover-
lap. It is obvious that the probability of d(A,B)≤R,de-
noted by FA(R), is equal to that one where point Bfalls inside
Sphere(A,R). Thus,
FA(R)=V(A,R)
V,(5)
where V=a×bdenotes the volume of cuboid C. Further-
more, if point Ais also uniformly distributed in the cuboid C
and is independent of the location of point B, the probability
of d(A,B)≤R,denotedbyF(R), is the expectation of FA(R)
with uniformly distributed location of point A, that is,
F(R)=EAFA(R)=EAV(A,R)
V.(6)
Next, we will discuss the calculation of F(R). Let S(t,A,R)
denote the area of an X-axial cross section of the space where
Sphere(A,R) and the cuboid space Coverlap, with distance t
from A.Thus,
V(A,R)=TS(t,A,R)dt,(7)
where Tdenotes the integral region of t. Then, we get the
following expression:
F(R)=EAV(A,R)
V
=EA1
ab TS(t,A,R)dt
=1
ab TEAS(t,A,R)dt
=1
ab TP(t,A,R)b×f(r)dt
=1
aTP(t,A,R)f(r)dt,
(8)
where rdenotes the radius of the X-axial cross section of
Sphere(A,R) with distance tfrom the sphere center A,and
EA[S(t,A,R)] =P(t,A,R)[b×f(r)] denotes the expectation
of S(t,A,R) in random location of A.P(t,A,R)isdefinedas
the probability that the center of the X-axial cross section of
Sphere(A,R) with distance tfrom Ais inside the cuboidal
space C, which reflects the distribution of point Aalong the
X-axis. And b×f(r) denotes the expectation of S(t,A,R)
with the qualification that the center of the section is inside
the cuboid space C,whichisderivedfrom(
3)andreflects
the distribution of Ain the Y−Zplane. Thus, the problem
in three-dimensional space can be reduced to the combina-
tion of one in one-dimension and one in two-dimension. It

4 EURASIP Journal on Wireless Communications and Networking
is obvious that
r=R2−t2,|t|≤R,
P(t,A,R)=⎧
⎪
⎨
⎪
⎩
1
aa−|t|,|t|≤a;
0, otherwise.
(9)
Thus,
F(R)=1
aT
a−|t|
af(r)dt =2
aT+
a−t
af(r)dt, (10)
where T+denotes the integral region of t≥0. Further, sub-
stituting twith √R2−r2,wehave
F(R)=2
aEr
P(r)f(r)dr,P(r)=r
√R2−r2−r
a, (11)
where f(r)isaspresentedin(
4) and integral region Eris
[0, R] for the case R<aand [√R2−a2,R]forR≥a,respec-
tively. It is not hard to see that F(R) has the following two
different expressions:
F(R)=2
aEr
P(r)f(r)dr
=⎧
⎨
⎩
F1(R), a≤1≤band √a2+1<b;
F2(R), a≤1≤band √a2+1≥b,
(12)
where F1(R)andF2(R) each have segmented expressions,
that is,
F1(R)=
⎧
⎪
⎪
⎪
⎪
⎪
⎪
⎪
⎪
⎪
⎪
⎪
⎪
⎪
⎪
⎪
⎪
⎪
⎪
⎪
⎪
⎪
⎪
⎪
⎪
⎪
⎪
⎪
⎪
⎪
⎪
⎪
⎪
⎪
⎪
⎪
⎪
⎪
⎨
⎪
⎪
⎪
⎪
⎪
⎪
⎪
⎪
⎪
⎪
⎪
⎪
⎪
⎪
⎪
⎪
⎪
⎪
⎪
⎪
⎪
⎪
⎪
⎪
⎪
⎪
⎪
⎪
⎪
⎪
⎪
⎪
⎪
⎪
⎪
⎪
⎪
⎩
2
aR
0P(r)f1(r)dr,0≤R<a,
2
aR
√R2−a2P(r)f1(r)dr,a≤R<1,
2
a1
√R2−a2P(r)f1(r)dr +2
aR
1P(r)f2(r)dr,1≤R<√1+a2,
2
aR
√R2−a2P(r)f2(r)dr,√1+a2≤R<b,
2
ab
√R2−a2P(r)f2(r)dr +2
aR
bP(r)f3(r)dr,b≤R<√a2+b2,
2
aR
√R2−a2P(r)f3(r)dr,√a2+b2≤R<√1+b2,
2
a√1+b2
√R2−a2P(r)f3(r)dr +2
aR
√1+b2P(r)f4(r)dr,√1+b2≤R<√1+a2+b2,
2
aR
√R2−a2P(r)f4(r)dr,√1+a2+b2≤R,
F2(R)=
⎧
⎪
⎪
⎪
⎪
⎪
⎪
⎪
⎪
⎪
⎪
⎪
⎪
⎪
⎪
⎪
⎪
⎪
⎪
⎪
⎪
⎪
⎪
⎪
⎪
⎪
⎪
⎪
⎪
⎪
⎪
⎪
⎪
⎪
⎪
⎪
⎪
⎪
⎪
⎪
⎪
⎪
⎪
⎨
⎪
⎪
⎪
⎪
⎪
⎪
⎪
⎪
⎪
⎪
⎪
⎪
⎪
⎪
⎪
⎪
⎪
⎪
⎪
⎪
⎪
⎪
⎪
⎪
⎪
⎪
⎪
⎪
⎪
⎪
⎪
⎪
⎪
⎪
⎪
⎪
⎪
⎪
⎪
⎪
⎪
⎪
⎩
2
aR
0P(r)f1(r)dr,0≤R<a,
2
aR
√R2−a2P(r)f1(r)dr,a≤R<1,
2
a1
√R2−a2P(r)f1(r)dr +2
aR
1P(r)f2(r)dr,1≤R<b,
2
a1
√R2−a2P(r)f1(r)dr +2
ab
1P(r)f2(r)dr
+2
aR
bP(r)f3(r)dr,b≤R<√1+a2,
2
ab
√R2−a2P(r)f2(r)dr +2
aR
bP(r)f3(r)dr,√1+a2≤R<√a2+b2,
2
aR
√R2−a2P(r)f3(r)dr,√a2+b2≤R<√1+b2,
2
a√1+b2
√R2−a2P(r)f3(r)dr +2
aR
√1+b2P(r)f4(r)dr,√1+b2≤R<√1+a2+b2,
2
aR
√R2−a2P(r)f4(r)dr,√1+a2+b2≤R.
(13)

Guansheng Li et al. 5
00.511.52
Distance
0
0.1
0.2
0.3
0.4
0.5
0.6
0.7
0.8
0.9
1
Probability distribution
Simulation
Theory
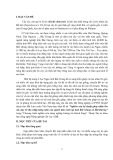
Figure 3: The distance probability distribution between nodes that
are independent and uniformly distributed in a 0.5×1×2 cuboid
space. The curve marked by “∗” is the result of simulation and that
by “◦” is the theoretical result.
Hitherto, we have given the expression to calculate the
distance probability distribution between nodes that are in-
dependent and uniformly distributed in an a×1×bcuboid
space. It is not hard to derive an explicit formula from the
above expressions. Moreover, since F(R) is a single integral
and both P(r)and f(r) have relatively simple expressions,
one can use the above expressions to get his required results
through numerical method in practice, instead of using the
complicated explicit expression. Hence, we omit the explicit
expression in detail here.
Simulation is conducted in a 0.5×1×2cuboidspace.Each
time, two nodes are generated independently and uniformly
in the space and the distance between them are calculated. A
total of 10000 such trials are carried out. The simulation and
theoretical results on the distance probability distributions
between nodes are plotted in Figure 3,whichdemonstrates
the correctness of our theoretical expression.
3. NODE DEGREE
Recall that in a wireless ad hoc network, the degree of a
node is defined as the number of its neighbors, that is, the
number of nodes that can receive its message directly with-
out relay [3]. It is obvious that one node’s degree is equiv-
alent to the number of the nodes located in its power cov-
ering range except itself (Figure 1). From the viewpoint of
successful exchange of messages, node degree is an impor-
tant factor which represents the local topological status of the
wireless ad hoc network. To a certain extent, the node loca-
tions and their corresponding degrees would affect the con-
figuration of the wireless ad hoc network and even the total
network throughput. Verdone [7] proved that in an infinite
three-dimensional space, the node degree obeys the Poisson
distribution. However, in the case of a finite space, the ex-
plicit expression of the probability distribution of the node
degree is more complicated, even in the absence of random
shadowing. In this section, we will discuss this problem based
on the result in Section 2.
Suppose the nodes of an n-node wireless ad hoc network
are independent and uniformly distributed in a cuboid space
with the same covering radius R. According to the discussion
in Section 2, for an arbitrary settled node A=(x,y,z)in
the network, it is obvious that its degree obeys the binomial
distribution with parameters n−1andFA(R), that is,
PAd(A)=k=n−1
kFA(R)k1−FA(R)(n−k−1),
FA(R)=V(A,R)
V,
(14)
where V(A,R), V,andFA(R)areasdefinedinSection 2.
Furthermore, if node Ais uniformly distributed in the finite
space, the probability distribution of node degree can be for-
mulated as follows:
Pd(A)=k=EAPAd(A)=k
=EAn−1
kFA(r)k1−FA(R)(n−k−1).
(15)
Based on the expression, one can calculate the probability
distribution of the node degree through numerical method.
In the terminology of communication, such a probability
distribution equals the probability distribution of the num-
ber of nodes with which a randomly chosen node can com-
municate directly. In the symmetrical case, where all nodes
have the same covering radius, this probability distribution
also equals that of the number of nodes that may interfere
with the reception of a certain nodes if they transmit signals
simultaneously.
Note that P{d(A)=k}is neither the binomial distribu-
tion with parameter F(R), that is,
Pd(A)=k=n−1
kF(R)k1−F(R)(n−k−1), (16)
nor the widely used Poisson distribution with parameter λ=
(n−1)F(R), that is,
Pd(A)=k=λk
k!e−λ, (17)
where F(R) is the distance probability distribution between
nodes, which is equal to the probability that two randomly
chosen nodes can communicate with each other directly


![Bộ Thí Nghiệm Vi Điều Khiển: Nghiên Cứu và Ứng Dụng [A-Z]](https://cdn.tailieu.vn/images/document/thumbnail/2025/20250429/kexauxi8/135x160/10301767836127.jpg)
![Nghiên Cứu TikTok: Tác Động và Hành Vi Giới Trẻ [Mới Nhất]](https://cdn.tailieu.vn/images/document/thumbnail/2025/20250429/kexauxi8/135x160/24371767836128.jpg)


