
Pfkfb3 is transcriptionally upregulated in diabetic mouse
liver through proliferative signals
Joan Duran
1,
*, Merce
`Obach
1,
*, Aurea Navarro-Sabate
1
, Anna Manzano
1
, Marta Go
´mez
1
,
Jose L. Rosa
1
, Francesc Ventura
1
, Jose C. Perales
2
and Ramon Bartrons
1
1 Unitat Bioquı
´mica i Biologia Molecular, Universitat de Barcelona, Spain
2 Unitat de Biofı
´sica, Departament de Cie
`ncies Fisiolo
`giques, IDIBELL, Universitat de Barcelona, Spain
Introduction
Diabetes is a common metabolic disorder in humans,
associated with significant morbidity and mortality. In
this pathological situation, the liver, one of the major
targets of insulin action, develops biochemical and
functional abnormalities, which include alterations in
carbohydrate, lipid and protein metabolism and
changes in antioxidant status [1]. Insulin-dependent
diabetes mellitus is currently modelled by the injection
of streptozotocin (STZ) in rodents, which degenerates
pancreatic insulin-producing b-cells [2]. This model is
characterized by decreased plasma insulin levels, severe
hyperglycaemia and alterations in insulin-dependent
signal transduction [3]. STZ-induced diabetes in rats is
also associated with hepatomegaly as a result of the
Keywords
6-phosophofructo-2-kinase ⁄fructose-2,6-
bisphosphatase; diabetes; fructose-2,6-
bisphosphate; liver; streptozotocin
Correspondence
R. Bartrons, Unitat Bioquı
´mica i Biologia
Molecular, Universitat de Barcelona, Feixa
Llarga s ⁄n, E-08907 L’Hospitalet, Barcelona,
Spain
Fax: 34934024268
Tel: 34934024252
E-mail: rbartrons@ub.edu
*These authors contributed equally to this
work
(Received 3 April 2009, revised 12 June
2009, accepted 17 June 2009)
doi:10.1111/j.1742-4658.2009.07161.x
The ubiquitous isoform of 6-phosphofructo-2-kinase ⁄fructose-2,6-bisphos-
phatase (uPFK-2), a product of the Pfkfb3 gene, plays a crucial role in the
control of glycolytic flux. In this study, we demonstrate that Pfkfb3 gene
expression is increased in streptozotocin-induced diabetic mouse liver. The
Pfkfb3 ⁄-3566 promoter construct linked to the luciferase reporter gene was
delivered to the liver via hydrodynamic gene transfer. This promoter was
upregulated in streptozotocin-induced diabetic mouse liver compared with
transfected healthy cohorts. In addition, increases were observed in Pfkfb3
mRNA and uPFK-2 protein levels, and intrahepatic fructose-2,6-bisphos-
phate concentration. During streptozotocin-induced diabetes, phosphoryla-
tion of both p38 mitogen-activated protein kinase and Akt was detected,
together with the overexpression of the proliferative markers cyclin D and
E2F. These findings indicate that uPFK-2 induction is coupled to enhanced
hepatocyte proliferation in streptozotocin-induced diabetic mouse liver.
Expression decreased when hepatocytes were treated with either rapamycin
or LY 294002. This shows that uPFK-2 regulation is phosphoinositide
3-kinase–Akt–mammalian target of rapamycin dependent. These results
indicate that fructose-2,6-bisphosphate is essential to the maintenance
of the glycolytic flux necessary for providing energy and biosynthetic
precursors to dividing cells.
Abbreviations
C⁄EBP, CCAAT ⁄enhancer-binding protein; CDK, cyclin-dependent kinase; EGF, epidermal growth factor; EMSA, electrophoresis mobility
shift assay; ERK, extracellular signal-regulated kinase; Fru-2,6-P
2
, fructose-2,6-bisphosphate; GFP, green fluorescent protein; iNOS, inducible
nitric oxide synthase; LAP, liver activation protein; LPS, lipopolysaccharide; mTOR, mammalian target of rapamycin; mTORC 1 ⁄2, mTOR
complex 1 ⁄2; NF jB, nuclear factor kappa-light-chain-enhancer of activated B cells; PCNA, proliferating cell nuclear antigen; PEPCK,
phosphoenolpyruvate carboxykinase; PFK-2, 6-phosphofructo-2-kinase ⁄fructose-2,6-bisphosphatase (EC 2.7.1.105 ⁄EC 3.1.3.46); PI3K,
phosphoinositide 3-kinase; Rb, retinoblastoma; ROS, reactive oxygen species; STZ, streptozotocin; TBARS, thiobarbituric acid reactive
substances; uPFK-2, ubiquitous PFK-2.
FEBS Journal 276 (2009) 4555–4568 ª2009 The Authors Journal compilation ª2009 FEBS 4555

high cell proliferation rates and decreased apoptosis
[1,3,4]. In addition, the mechanisms that regulate cell
division are upregulated in STZ-induced diabetic mice.
This observation is consistent with the robust repair of
tissue damage caused by hepatotoxicants observed in
diabetic mouse liver [4]. On days 5 and 10 after STZ
treatment, significantly higher numbers of G2 cells
were found in diabetic liver compared with controls
[3,4].
Cell proliferation and tumour growth are supported
by high glycolytic flux. This is mainly controlled by
6-phosphofructo-1-kinase, which is potently activated
by the regulatory metabolite fructose-2,6-bisphosphate
(Fru-2,6-P
2
) [5,6]. 6-Phosphofructo-2-kinase ⁄fructose-
2,6-bisphosphatase (PFK-2) is a homodimeric enzyme
that catalyses the synthesis and degradation of Fru-
2,6-P
2
[6–9]. Since the discovery of this system in the
liver, other mammalian isozymes have been identified
with a range of expression profiles and kinetic
responses to allosteric effectors, hormonal and growth
factor signals [7–10]. These isozymes are generated by
alternative splicing from four independent genes, desig-
nated Pfkfb1–4 [11]. The Pfkfb3 gene encodes a ubiq-
uitous PFK-2 (uPFK-2) isozyme [12], which is induced
by progesterone [13], inflammatory stimuli [14] and
hypoxia [15,16], and is degraded through the ubiqu-
itin–proteasome proteolytic pathway [17]. The Pfkfb3
gene product has the highest kinase to bisphosphatase
activity ratio and thus maintains elevated Fru-2,6-P
2
levels, which, in turn, sustain high glycolytic rates in
the cell [18]. This gene has been implicated in cell pro-
liferation as it is ubiquitously expressed in proliferating
tissues, transformed cell lines and in various tumours
[13,14,19–22]. Recently, in order to determine the
effects of uPFK-2 overexpression in mouse liver and to
examine its involvement in metabolic disturbances, we
designed a transgenic mouse model that overexpresses
Pfkfb3. These transgenic animals sustained high Fru-
2,6-P
2
levels in the liver and increased weight gain [23].
In the liver of STZ-induced diabetic rats, the levels
of Fru-2,6-P
2
and 6-phosphofructo-2-kinase activity
decreased and the phosphorylation of the bifunctional
enzyme increased, correlating with a fall in hepatic
Fru-2,6-P
2
, ketonaemia and glycaemia [24–26]. Similar
results have been reported in diabetic mouse liver,
underscoring the role played by Fru-2,6-P
2
in the con-
trol of fuel metabolism [27]. In the present study, we
demonstrate that Pfkfb3 gene expression increases pro-
gressively in STZ-induced diabetic mouse liver, leading
to progressive and partial recovery of Fru-2,6-P
2
levels,
and implicating this gene in liver metabolism. In addi-
tion, we developed an in vivo promoter assay method
based on a hydrodynamic gene delivery technique in
order to determine whether the increased Pfkfb3
expression in diabetic liver was a result of transcrip-
tional upregulation via promoter activation. The rela-
tionship between hepatocyte proliferation and Pfkfb3
gene induction in STZ-induced diabetic mouse liver
was also studied. Our results strongly support the
hypothesis that this gene is transcriptionally upregulat-
ed through cell proliferation pathways, involving Akt
phosphorylation and cyclin D and E2F transcription
factor transactivation in the liver.
Results
Pfkfb3 gene expression and Fru-2,6-P
2
concentra-
tion in STZ-induced diabetic mouse liver
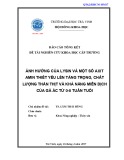
Fifteen days after STZ injection, C57 ⁄BL6 mice
showed significantly higher plasma glucose levels
(257.4 ± 29.2 versus 61.3 ± 8.9 mgÆdL
)1
in noninject-
ed controls) and almost nondetectable plasma insulin
levels (< 0.15 lgÆL
)1
) after 16 h of starvation (Fig. 1).
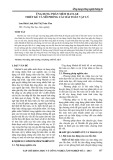
In these conditions, we analysed Pfkfb3 mRNA
expression and protein levels. As shown in Fig. 2A,
Pfkfb3 mRNA expression increased significantly
between day 8 and day 15 after STZ injection to a
peak on day 15. UPFK-2 protein expression also rose
progressively during the time course of the experiment
(Fig. 2B). To assess the functionality of the overex-
pressed uPFK-2 isozyme, we next analysed the Fru-
2,6-P
2
concentration in liver. The concentration of
hepatic Fru-2,6-P
2
decreased after fasting, recovering
slowly in STZ diabetes, and reaching 30% of fed
values on day 15 after injection (Fig. 2C).
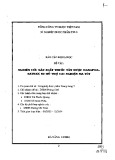
In order to assess the overall contribution of uPFK-
2 compared with the other isozymes, we also measured
the mRNA and protein levels of the other isozymes at
day 0 and 15 of STZ-induced diabetes. Significant vari-
ation in the levels of uPFK-2 expression and protein
0
100
200
300
400
500
600
700
0 2 4 6 8 10 15
Days after STZ
Fed
Fasted
> 600 mg·dL–1
Glycaemia (mg·dL–1)
Fig. 1. Blood glucose levels during the STZ-induced diabetes time
course in fed and fasting conditions (n= 10 animals per group).
Pfkfb3 upregulation in STZ-induced diabetic mouse liver J. Duran et al.
4556 FEBS Journal 276 (2009) 4555–4568 ª2009 The Authors Journal compilation ª2009 FEBS

were found after STZ treatment (Fig. 3A,B). The
mRNA expression of the other isozymes either did
not change significantly (PFKFB1) or decreased
(PFKFB4). In addition, we measured the ‘total’ and
‘active’ PFK-2 activities. In the conditions of the
assay, the ‘total’ and ‘active’ forms correspond to the
V
max
activity and to the activity of the nonphosphory-
lated form of the enzyme, respectively [28,29]. Both the
‘total’ and ‘active’ forms increased after STZ treatment
(Fig. 4). Compared with the ‘total’ activity, the ‘active’
form was low in the liver of starved animals (day 0),
suggesting that the enzyme present is inhibited by
phosphorylation (PFKFB1). In contrast, the activity of
the ‘active’ form on day 15 increased, in spite of
the fact that the animals were starved and diabetic,
suggesting an isoenzymatic change.
0
2
4
6
8
10
12
14
Day 0 Day 2 Day 4 Day 6 Day 8 Day 10 Day 15
**
**
**
Pfkfb3 expression (fold change)
0
0.4
0.8
1.2
1.6
2.0
2.4
2.8
Liver Fru-2,6-P
2
(nmol·g–1)
5.6
6.0 Fed
**
**
**
**
Days after
STZ 0 6 8 0 10 150 24
uPFK-2
Loading control
Day 0 Day 2 Day 4 Day 6 Day 8 Day 10 Day 15
A
B
C
Fig. 2. Pfkfb3 gene expression analysis in livers from STZ-induced
diabetic mice. (A) Quantitative real-time PCR analysis of Pfkfb3
expression was performed using RNA extracts from mouse livers
0, 2, 4, 6, 8, 10 and 15 days after STZ injection (n= 10 animals per
group). The data represent the fold change versus the lowest day 0
value, and are normalized to 18S cDNA. Statistically significant dif-
ferences (**P< 0.01) in diabetic mouse livers at 8, 10 and 15 days
after STZ injection were observed compared with controls (day 0).
(B) Western blot against uPFK-2 was performed with 50 lg of total
cell extract from the same animals. Protein was used as loading
control. (C) Liver Fru-2,6-P
2
values in fasted control (day 0) and 2,
4, 6, 8, 10 and 15-days after STZ injection. All points and bars rep-
resent the mean ± standard error of the mean (SEM) of the data
obtained (n= 10 animals per group). Statistically significant differ-
ences (*P< 0.05; **P< 0.01) were found on 2, 6, 8, 10 and
15 days after STZ versus control (day 0). Fed control value (in grey)
is indicated as a reference.
CT
A
B
STZ
uPFK-2 (PFKFB3)
(day = 15)
LPFK-2 (PFKFB1)
tPFK-2 (PFKFB4)
Loading control
1.5
0
0.5
1
Pfkfb1 expression
(fold change)
Pfkfb3 expression
(fold change)
Pfkfb4 expression
(fold change)
10 **
0
2
4
6
8
1.5
CT STZ
0
0.5
1
**
(Day = 15)
Fig. 3. Expression of the PFKFB isozymes in livers from STZ-
induced diabetic mice. Western blot against LPFK-2, uPFK-2 and
tPFK-2 (A) and quantitative real-time PCR using specific primers for
Pfkfb1,Pfkfb3 and Pfkfb4 genes (B). For western blot, 50 lgof
total liver extracts were used. Diabetic mice in the fasting condition
(16 h) and 15 days after STZ injection were compared with con-
trols. Protein was used as loading control. For Pfkfb3 mRNA quanti-
tative analysis, total liver RNA from control (day 0) and STZ-induced
diabetic (day 15) mice was used. The data represent the fold
change versus the lowest day 0 value and were normalized to 18S
cDNA. All graph points and bars represent the mean ± standard
error of the mean (SEM) of the data obtained. Statistically signifi-
cant increases (**P< 0.01) in diabetic mouse livers compared with
controls were observed for Pfkfb3 gene determination.
J. Duran et al. Pfkfb3 upregulation in STZ-induced diabetic mouse liver
FEBS Journal 276 (2009) 4555–4568 ª2009 The Authors Journal compilation ª2009 FEBS 4557

To identify possible liver damage caused by STZ
treatment, we measured plasma transaminase levels.
Alanine aminotransferase activities increased slightly
only during the first 5 days (37.8 ± 9.1 UÆL
)1
on the
fifth day versus 23.3 ± 5.6 UÆL
)1
in controls), return-
ing to control values afterwards.
uPFK-2 immunohistochemical analysis in the liver
uPFK-2 isozyme was overexpressed in the hepatic
parenchyma of diabetic mice (Fig. 5A). The expression
of proliferating cell nuclear antigen (PCNA) was also
increased at day 15 (Fig. 5B). Detailed observation of
uPFK-2-positive cell distribution revealed a clustering
formation of these hepatocytes (Fig. 5A,C), in accor-
dance with a previous report of a PCNA expression
pattern in mice liver 5 and 10 days after STZ injection
[4]. Next, hydrodynamic transfection of the green fluo-
rescent protein (GFP) expression vector was performed
to distinguish between perivenous and periportal
hepatocytes [30]. UPFK-2-overexpressing hepatocytes
were predominantly located in the perivenous zone [31]
of the liver (Fig. 5C, merged).
Mouse liver transfection of Pfkfb3/-3566
promoter construct during STZ-induced diabetes
development
To elucidate whether increased Pfkfb3 expression was
caused by its transcriptional upregulation via promoter
activation, we developed an in vivo promoter assay
method based on the hydrodynamic gene delivery tech-
nique. Hydrodynamic gene transfer is an efficient sys-
tem that allows the DNA to distribute mainly to the
liver [30]. The Pfkfb3 ⁄-3566 promoter construct (con-
0
2
4
6
8
10
12
14
16
18
20
Da
y
0 Da
y
15
PFK-2 activity (µU·(mg protein)–1)
PFK-2 activity (µU·(mg protein)–1)
* *
Total PFK-2 Act
i
v
i
ty Act
i
ve PFK-2 Act
i
v
i
ty
0
1
2
3
4
5
6
7
8
*
Da
y
0 Da
y
15
Fig. 4. Hepatic PFK-2 activity. Liver ‘total’ and ‘active’ PFK-2 activi-
ties in fasted control (day 0) and at day 15 after STZ-induced diabe-
tes. All graph points and bars represent the mean ± standard error
of the mean (SEM) of the data obtained (n= 10 animals per group).
Statistically significant differences (*P< 0.05; **P< 0.01) were
found in diabetic animals versus controls (day 0).
Control liver
A
B
C
D
Diabetic liver
(day 15 after STZ injection)
uPFK-2
uPFK-2 GFP Merged
PCNA
Control STZ (day 15)
Loading control
14
**
4
6
8
10
12
*
*
Pfkfb3 promoter-luciferase activity
(fold induction)
0
2
Day 0 Day15 Day 10 Day 8 Day 6 Day 4 Day 2
Fig. 5. UPFK-2 immunostaining and hydrodynamic transfection
analysis of Pfkfb3 ⁄-3566 promoter construct. (A) uPFK-2 immuno-
staining in control and diabetic mouse livers. Fixed liver samples
included in OCT were cut and prepared for immunohistochemistry
procedures. Immunostaining was performed by indirect immunoflu-
orescence using uPFK-2 (1 : 10) primary antibody, followed by an
rabbit IgG secondary antibody conjugated to Alexa-Fluor 568. Omis-
sion of primary antibody was used as a negative control. (B) For
western blot against PCNA, 50 lg of total liver extract were used
and protein was employed as a loading control. (C) Animals (n=10
for each condition) were cotransfected, using hydrodynamic gene
delivery, with Pfkfb3 ⁄-3566 promoter construct, and GFP expres-
sion vector was injected through the mouse tail vein in a volume of
10% of the body weight. The liver transfection efficiency was
assessed using the percentage of hepatocytes expressing GFP.
Clusters of hepatocytes overexpressing uPFK-2 colocalize with GFP
in perivenous cells. (D) Hydrodynamic transfection analysis of
Pfkfb3 ⁄-3566 promoter construct at baseline (day 0) and 2, 4, 6, 8,
10 and 15 days after STZ injection. Statistically significant differ-
ences in luciferase activity were observed in livers from mice on
days 4, 10 (*P< 0.05) and 15 (**P< 0.01) after STZ injection com-
pared with controls.
Pfkfb3 upregulation in STZ-induced diabetic mouse liver J. Duran et al.
4558 FEBS Journal 276 (2009) 4555–4568 ª2009 The Authors Journal compilation ª2009 FEBS

taining a 3566-nucleotide fragment of the Pfkfb3 pro-
moter) linked to the luciferase reporter gene was deliv-
ered into mouse liver during diabetes development. As
indicated by the cotransfection of Pfkfb3 ⁄-3566 and
GFP constructs (Fig. 5C), approximately 20–40% of
the liver cells were transfected. Moreover, no signifi-
cant differences were found in alanine aminotransfer-
ase levels 24 h after transfection between animal
groups (Pfkfb3 ⁄-3566 + GFP; GFP). Alanine amino-
transferase levels were in the range of those receiving
saline (data not shown), indicating that the liver was
not affected after transfection treatment. Transient
in vivo transfection of the Pfkfb3 ⁄-3566 promoter
construct demonstrated significant luciferase activity on
day 4 (around four-fold), and large increases (8–12-fold)
on days 10 and 15 after STZ injection, in comparison
with basal values (Fig. 5D).
Involvement of pro-inflammatory signals and
oxidative stress in Pfkfb3 expression in diabetic
liver
Nuclear factor kappa-light-chain-enhancer of activated
B cells (NF-jB) has been found to be expressed in
liver epithelium, where it regulates hepatic cell prolifer-
ation and survival during regeneration and develop-
ment [32]. Furthermore, we have previously described
various NF-jB consensus sequences in the Pfkfb3 gene
promoter [16]. In the light of these data, we examined
whether NF-jB might be responsible for Pfkfb3 activa-
tion in our diabetic model. The presence of NF-jBin
liver nuclear extracts from days 0, 4, 8 and 15 after
STZ injection was studied by electrophoresis mobility
shift assay (EMSA). No changes in phosphorylated
NF-jB oligonucleotide interactions were found
between the various time course samples (Fig. 6A). In
addition, in order to rule out NF-jB involvement in
Pfkfb3 upregulation, we used RAW wild-type and
RAW IjBa dominant active (IjB aDA) cells [33]. In
RAW wild-type cells, inducible nitric oxide synthase
(iNOS) expression increased gradually 8, 16 and 24 h
after lipopolysaccharide (LPS) treatment; at the same
time, NF-jB was induced. Moreover, no expression of
this pro-inflammatory marker was detected in RAW
IjB aDA cells after LPS treatment. In these condi-
tions, small changes in uPFK-2 protein levels were
found in the presence or absence of LPS in both cell
lines (Fig. 6B). Furthermore, no iNOS expression was
detected in any liver sample from any day of the study
(data not shown). The steady-state levels of lipoperoxi-
dation product (thiobarbituric acid reactive substances,
TBARS) concentration and catalase activity were
determined to rule out the involvement of oxidative
stress in our STZ diabetic model. No significant differ-
ences were found between post-STZ injection liver
samples (results not shown).
Cell growth and proliferation in STZ-induced
diabetic mouse liver
Several reports have described a significantly larger
number of G2 cells in STZ-induced diabetic mouse
liver than in nondiabetic cohorts [4]. Moreover, Pfkfb3
gene expression has also been found to be increased in
proliferating cells [22,34]. We studied various cell
growth and proliferation markers in order to find a
plausible explanation for uPFK-2 overexpression in
STZ-induced diabetic mouse liver. The hepatocyte pro-
liferation observed in response to growth and auto-
crine factors is attempted, at least in part, via the
activation of the phosphoinositide 3-kinase (PI3K)
pathway and its downstream signal transduction effec-
tors [35–38]. In addition, the predominant role of
PI3K and the mammalian target of rapamycin
(mTOR) in DNA replication and cyclin D activation
has been reported [35,36]. To evaluate the involvement
of this pathway in our STZ-induced diabetic model,
phosphorylation of Akt on Ser473 (P-Akt Ser473) [39]
and cyclin D expression were studied. Moreover, it has
been speculated that, in type I diabetes mellitus, p38
Days after
STZ c+
048 15
Hours after
LPS treatment 8816 1624 240
iNOS
uPFK-2
RAW mock RAW DA
Loading control
A
B
Fig. 6. Oxidative stress analysis. (A) Fresh liver nuclear extracts from
days 0, 4, 8 and 15 after STZ injection were tested for the presence
of NF-jB transcription factor by EMSA. A
32
P-labelled oligonucleotide
containing the NF-jB consensus binding site was used as probe.
A nuclear cell extract from SH-SY-5Y cells was used as positive
control (c+). (B) Western blot of RAW WT and RAW IjBaDA cells
treated with LPS (1 lgÆmL
)1
) for 0, 8, 16 and 24 h. Fifty micrograms
of total cell extracts were blotted using antibodies against iNOS (as
positive control) and uPFK-2 enzymes. Protein was used as a loading
control.
J. Duran et al. Pfkfb3 upregulation in STZ-induced diabetic mouse liver
FEBS Journal 276 (2009) 4555–4568 ª2009 The Authors Journal compilation ª2009 FEBS 4559


![Bộ Thí Nghiệm Vi Điều Khiển: Nghiên Cứu và Ứng Dụng [A-Z]](https://cdn.tailieu.vn/images/document/thumbnail/2025/20250429/kexauxi8/135x160/10301767836127.jpg)
![Nghiên Cứu TikTok: Tác Động và Hành Vi Giới Trẻ [Mới Nhất]](https://cdn.tailieu.vn/images/document/thumbnail/2025/20250429/kexauxi8/135x160/24371767836128.jpg)


